Abstract
Cartesian tensor basis have been widely used to approximate spherical functions. In Medical Imaging, tensors of various orders have been used to model the diffusivity function in Diffusion-weighted MRI data sets. However, it is known that the peaks of the diffusivity do not correspond to orientations of the underlying fibers and hence the displacement probability profiles should be employed instead. In this paper, we present a novel representation of the probability profile by a 4th order tensor, which is a smooth spherical function that can approximate single-fibers as well as multiple-fiber structures. We also present a method for efficiently estimating the unknown tensor coefficients of the probability profile directly from a given high-angular resolution diffusion-weighted (HARDI) data set. The accuracy of our model is validated by experiments on synthetic and real HARDI datasets from a fixed rat spinal cord.
Keywords: Displacement probability, Tensors, Fourier Transform, DW-MRI
1. INTRODUCTION
In Medical Imaging, due to the advances in the imaging technology over the last decade, it has become possible to acquire high angular resolution magnetic resonance (MR) images that allows one to infer the apparent diffusivity of water in tissue. Several physical quantities that can be estimated from the acquired MR data such as the diffusivity of water and the displacement probability of its molecules are spherical functions. There are several ways to model a spherical function. One way is to employ the spherical harmonics basis whose natural space is the unit sphere. Cartesian tensor basis evaluated on the unit sphere can also be used for modeling spherical functions and since they are multi-linear forms, are quite efficient to compute and lead to simple formulations.
Cartesian tensor basis of order 2 has been used in literature for approximating the local diffusivity in DT-MRI [1]. In this case the diffusivity can be written in the form vT Dv, where D is a 3 × 3 symmetric positive definite matrix. However, 2nd-order tensors are incapable of modeling complex geometry of the diffusivity function in practice for many cases (see [2, 3], such as in the presence of fiber-crossings, and a higher-order approximation must be employed instead. Higher-order tensors have been used to model either the local diffusivity function [4, 5], or the Kurtosis component of it [6]. However, in all cases the peaks of the estimated higher-order tensor do not necessarily yield the distinct orientations of the underlying distinct fiber bundles [2]. Hence, one should instead employ the displacement probability profiles given by the Fourier integral
| (1) |
where q is the reciprocal space vector, S(q) is the DW-MRI signal value associated with vector q, S0 the zero gradient signal and r and r0 is the direction and magnitude respectively of the displacement vector. However, the computation of the integral in Eq. 1 is a task that involves numerical integration or approximations.
In order to avoid the aforementioned computational effort and the possible inaccuracies introduced by this step, one can directly estimate the displacement probability from the given DW-MRI data. In this paper we propose a novel representation of the displacement probability profile by using the 4th-order Cartesian tensor basis. 4th-order tensors have been studied recently in [5] showing their capability to model multi-lobed diffusivity functions. In our model, the lobes of the probability profile, which is expressed in the form of a 4th-order tensor, correspond directly to orientations of distinct fiber distributions and thus there is no need to evaluate the integral of Eq.1. We also present a novel method for efficiently estimating the 15 unknown tensor coefficients of the displacement probability from a given HARDI dataset. We compare the performance of our method in computing accurate fiber orientations with several other existing techniques, demonstrating the efficiency and accuracy of our model.
2. SPHERICAL FUNCTION TENSORIAL APPROXIMATION
A spherical function can be approximated by a nth-order Cartesian tensor expressed in the following form
| (2) |
where v =[v1 v2 v3]T is a unit vector. The spherical functions modeled by Eq. 2 are antipodal symmetric (T(v) = T(−v)) for even orders.
The ability of a Cartesian tensors to approximate the complex geometry of a spherical function with many lobes increases with the order. A 2nd-order tensor (commonly used in DT-MRI) can only be used for approximating antipodal symmetric spherical functions with a single lobe. For approximating functions with more lobes, higher-order tensors are required. In the following sections, we employ higher-order tensors to model the displacement probability profile in HARDI datasets.
3. HIGHER-ORDER BASIS FOR HARDI APPROXIMATION
In this section we present a novel representation of the displacement probability profile as a higher-order tensor and a method for direct estimation from a given DW-MRI dataset. We model the probability profile by using the 4th-order Cartesian tensor basis as follows
| (3) |
where ci,j,k(r0) are the tensor coefficients estimated for a given magnitude r0 of the displacement vector. Given r0, Eq. 3 is a spherical function since the only argument is the unit vector r. In the case of 4th-order tensors there are 15 unique unknown coefficients ci,j,k(r0) that need to be estimated. However, since in our application, the given data is the DW-MRI signal and not the displacement probability, we need to define a set of functions that approximate the signal, and have the following properties: a) their Fourier integral gives the 4th-order tensorial basis functions, and b) can be computed analytically.
A set of functions that have the above properties is presented in the right column of table 1. This set of functions was obtained by taking all the possible combinations of partial derivatives (∂/∂q1)i(∂/∂q2)j(∂/∂q3)kB(q), where i + j + k = 4 and B(q) is a real-valued function in ℜ3 defined as
| (4) |
The Fourier integral of each partial derivative of Eq. 4 is expressed as
| (5) |
where c is a constant whose value is not dependent on r. Note that the left side of Eq. 5 is a Cartesian tensor basis function. Hence we can employ the functions presented in table 1 to model the displacement probability profile as
| (6) |
In the model proposed in Eq.6, the approximated DW-MRI signal has asymptotic behavior (when ∥ q ∥→ ∞) similar to that of the commonly used Stejskal-Tanner equation [7]. Furthermore, by substituting Eq. 5 into 6 the displacement probability profile is modeled as a 4th-order tensor (Eq. 3). By using known properties of the Fourier transform, the integral in Eq. 6 can be re-written in the following more convenient form that we will use later in Sec. 4.
| (7) |
where, . Note the presence of r0 in the argument of B(q/r0).
Table 1.
Proposed basis functions
| P(r) basis | Corresponding S(q)/S0 basis |
|---|---|
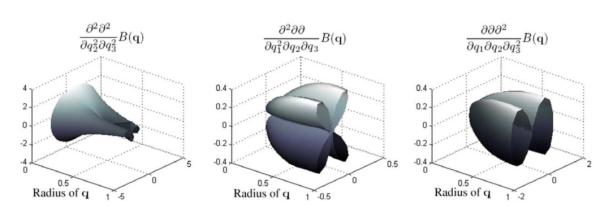
Figure 1 shows 3D plots of three of the basis functions (∂/∂q1)i(∂/∂q2)j(∂/∂q3)kB(q). By observing the figure, we can see the variability in the shape of the basis functions (e.g. crosses and peanut-like shapes). These characteristics of the functions provide the ability to our model to approximate complex geometries such as fiber crossings. In the next section we employ our proposed model (given by Eq. 7) to approximate the displacement probability profiles from a given set of high angular resolution diffusion-weighted images.
Fig. 1.

3D plots of three of the basis functions from Table 1. The functions were evaluated for varying ∥ q ∥ over a unit by circle of directions q. The circle was defined fixing the elevation spherical coordinate to π/3 and varying azimuth.
4. FAST ESTIMATION FROM HARDI DATASETS
Given a set of N diffusion-weighted MR images Sn associated with diffusion gradient directions gn, n = 1 … N, we seek to estimate the 15 unknown coefficients in Eq. 7 by minimizing the following energy
| (8) |
where S0 is the zero gradient image. If N > 15 Eq. 8 can be minimized by solving an over-determined linear system. This system is formed by constructing an N-dimensional vector S that consists of the signal values Sn and a N × 15 matrix A whose entries are the values of our 15 dimensional basis (∂/∂q1)i(∂/∂q2)j(∂/∂q3)kB(αgn) ∀n = 1 … N, where α = ∥ qn ∥ /r0. We note that α depends only on r0 if the diffusion-weighted images were acquired with a fixed b-value since in this case ∥ qn ∥ is the same constant ∀n = 1 … N. In our experiments we used α = 0.5. The estimated coefficients are the components of the vector x in the following over-determined linear system Ax = S, which can be solved very efficiently.
After solving the above system, we can compute the directions of the distinct fiber populations by finding the peaks of Eq. 3. The probability profile can be visualized by plotting Eq. 3 as a spherical function (i.e. for all unit vectors r) as shown in the experimental result section.
5. EXPERIMENTAL RESULTS
In this section we present experimental results on our method applied to simulated DW-MRI data as well as real HARDI data from a fixed rat spinal cord.
5.1. Synthetic data experiments
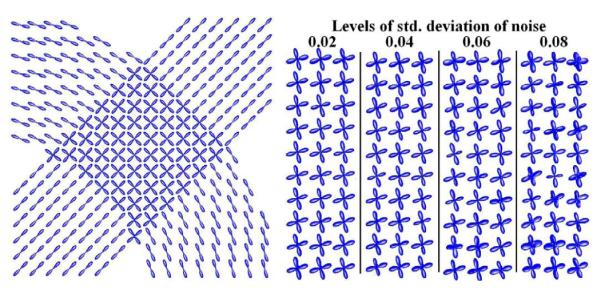
In order to test our method in approximating displacement probability profiles from single fibers as well as from fiber crossings, we synthesized a HARDI dataset of size 128 × 128 by simulating two fiber bundles crossing each other using the realistic diffusion MR simulation model in [8] (b-value=1250 s/mm2, 81 gradient directions).The probability profiles that were estimated from this dataset by using our method are presented in Fig. 2(left) showing correct fiber orientations.
Fig. 2.

Probability profiles estimated by applying our method to simulated data of: left) 2-fiber crossing bundle and right) corrupted crossings for different amounts of Riccian noise.
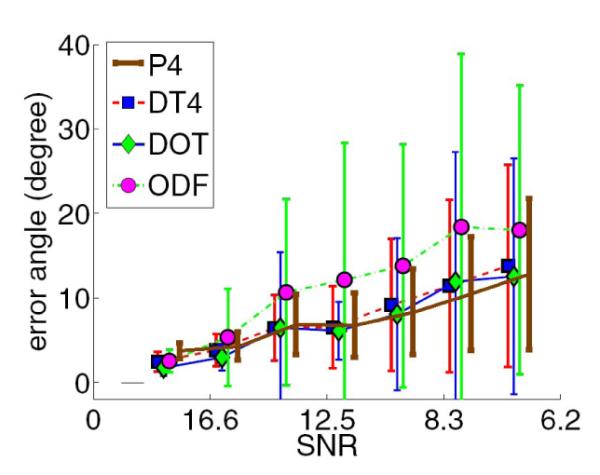
Furthermore, in order to compare our proposed method with other existing techniques, we performed another experiment using simulated noisy MR signal of 2-fiber crossings with different amounts of Riccian noise (Fig. 2 right). We estimated the displacement probability profiles from the corrupted signal using our proposed method and the following existing methods: a)the DOT method described in [2],b) the ODF method presented in [9] and c) the positive 4th-order diffusion tensor model in [5]. For all methods we computed the estimated fiber orientation errors for different amount of noise in the data (shown in Fig. 3). The results conclusively demonstrate the accuracy of our method, showing small fiber orientation errors (~ 6°) for typical amount of noise with signal to noise ratios (SNR): 12.5-16.6. Furthermore, by observing the plot, we also conclude that the accuracy of our proposed method is very close to that of the DOT method and is better than the ODF method for higher noise cases. Here, we should note that our method estimated each probability profile in approximately 2ms (on a Pentium 2.4GHz) which demonstrates the efficiency of our method.
Fig. 3.

Fiber orientation errors for different SNR in the data using our method (P4) and three other existing methods: 1) DOT, 2) ODF and 3) 4th-order DT. In the experiment we used simulated MR signal of a 2-fiber crossing, whose probability profile is shown in Fig.2(right).
5.1.1. Real data experiments
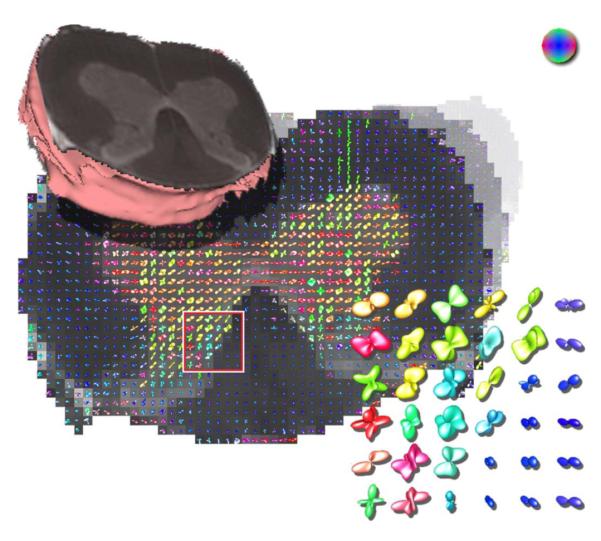
Figure 4 shows a real data example from a fixed rat spinal cord. The protocol that used in this experiment included acquisition of 22 images using a pulsed gradient spin echo pulse sequence with repetition time (TR) = 1.5 s, echo time (TE) = 27.2 ms, bandwidth = 30 kHz, field-of-view (FOV) = 4.3 × 4.3 mm. After the first image set was collected without diffusion weighting (b ~ 0 s/mm2), 21 diffusion-weighted image sets with gradient strength (G) = 664 mT/m, gradient duration (δ) = 1.5 ms, gradient separation (Δ) = 17.5 ms and diffusion time (Tδ) = 17 ms were collected. The image without diffusion weighting had 8 signal averages, and each diffusion-weighted image had 2 averages. By observing figure 4 it is clear that the white matter probability profiles shows peaks that correspond to fiber tracts which, as expected, are predominantly in the axial direction which is represented by the blue color. This indicates that our proposed method estimates correct fiber orientations in real HARDI datasets. The same figure also presents (in the zoomed plate) regions where more complex probability profiles were estimated that show the underlying complexity of the tissue structures.
Fig. 4.

Estimated probability profiles from real data of a rat’s fixed spinal cord. The zoomed ROI shows single fiber distributions in white matter and other more complex tissue structures.
6. CONCLUSIONS
In this paper we presented a novel representation of the displacement probability profile as a higher-order (4th) tensor. We constructed a set of basis functions that can approximate the DW-MRI signal and also have the property that their Fourier transform can be computed analytically giving the 4th-order Cartesian basis. We presented a method for computing efficiently the unknown tensor coefficients directly from given DW-MRI datasets by solving an over-determined linear system. We compared the performance of our method in estimating fiber orientation with other existing techniques, demonstrating the accuracy of our proposed method. Finally, we applied our framework in real HARDI datasets from fixed rat’s spinal cord showing the ability of our model to estimate single-fiber and also multiple-fiber distributions.
7. REFERENCES
- [1].Basser PJ, Mattiello J, Lebihan D. Estimation of the Effective Self-Diffusion Tensor from the NMR Spin Echo. J. Magn. Reson. B. 1994;vol. 103:247–254. doi: 10.1006/jmrb.1994.1037. [DOI] [PubMed] [Google Scholar]
- [2].Özarslan E, et al. Resolution of complex tissue microarchitecture using the diffusion orientation transform (DOT) NeuroImage. 2006;vol. 31:1086–1103. doi: 10.1016/j.neuroimage.2006.01.024. [DOI] [PubMed] [Google Scholar]
- [3].Jian B, et al. A novel tensor distribution model for the diffusion-weighted MR signal. NeuroImage. 2007;vol. 37(no 1):164–176. doi: 10.1016/j.neuroimage.2007.03.074. [DOI] [PMC free article] [PubMed] [Google Scholar]
- [4].Özarslan E, Vemuri BC, Mareci T. Fiber orientation mapping using generalized diffusion tensor imaging. ISBI. 2004:1036–1038. [Google Scholar]
- [5].Barmpoutis A, et al. Symmetric positive 4th order tensors and their estimation from diffusion weighted MRI. IPMI-LNCS. 2007;vol. 4584:308–319. doi: 10.1007/978-3-540-73273-0_26. [DOI] [PMC free article] [PubMed] [Google Scholar]
- [6].Jensen JH, et al. Diffusional kurtosis imaging: The quantification of non-gaussian water diffusion by means of magnetic resonance imaging. MRM. 2005;vol. 53(no 6):1432–1440. doi: 10.1002/mrm.20508. [DOI] [PubMed] [Google Scholar]
- [7].Stejskal EO, Tanner JE. Spin diffusion measurements: spin echoes in the presence of a time-dependent field gradient. J. Chem. Phys. 1965;vol. 42(1):288–292. [Google Scholar]
- [8].Söderman O, Jönsson B. Restricted diffusion in cylindrical geometry. J. Magn. Reson. 1995;vol. A(117):94–97. [Google Scholar]
- [9].Descoteaux M, et al. Regularized, fast and robust analytical q-ball imaging. MRM. vol. 58(no 3):497–510. doi: 10.1002/mrm.21277. [DOI] [PubMed] [Google Scholar]


