

Abstract
Chromosomal common fragile sites (CFSs) are genetically unstable regions of the genome that are induced by conditions that impair DNA replication. In this report, we show that treatment with the DNA polymerase inhibitor, aphidicolin (APH), slows the replication rate throughout S phase. To investigate the unusual sensitivity of CFSs to APH-induced replication stress, we examined replication dynamics within a 50 kb region of the most frequently expressed CFS, FRA3B. We mapped four origins of replication, ori 1–4, using two independent methods. In untreated cells, we detected significantly less newly replicated DNA at FRA3B ori 1–3, as compared with three control origins located within non-fragile regions (NCFSs). In APH-treated cells, all FRA3B and control origins tested were active; however, there was a significant increase of nascent strand DNA at the control origins and, to a lesser extent, at the FRA3B ori 1–3. On the basis of these observations and the theoretical modeling of the nascent strand abundance assay developed in this study, we hypothesize that CFS origins may be less efficient, and that APH treatment slows replication fork movement near these origins to a greater extent, resulting in impaired DNA replication and, ultimately, leading to the genetic instability characteristic of CFSs.
INTRODUCTION
Common fragile sites (CFSs) are chromosomal loci that show gaps, breaks or rearrangements in metaphase chromosomes when cells are cultured under conditions that impair DNA replication, such as treatment with low doses of aphidicolin (APH), a DNA polymerase α, δ and ε inhibitor (1,2). CFSs represent highly unstable regions of the genome, and deletions and rearrangements within these regions have been observed in a variety of cancer cells (3,4).
Eighty-nine CFSs are listed in the genome database; of these, 15 have been cloned (2,5). The FRA3B at 3p14.2 is the most frequently expressed CFS, and breakage is seen in up to 50% of cells exposed to APH (6). Sequence comparison of the various CFSs has not revealed a common motif, such as a trinucleotide repeat, that may be responsible for fragility; however, the CFSs are AT-rich and high in long interspersed nuclear elements and medium reiterated repeats (2,7). Analysis of the flexibility of DNA based on the twist angle of the double helix has revealed that CFSs contain regions of high flexibility and low DNA stability (8,9).
Laird et al. (10) hypothesized that fragile sites are late-replicating regions of the genome. Replication dynamics have been evaluated for four CFSs, FRA3B, FRA16D, FRA7G and FRA7H (11). Although not all of these replicate in late S phase (FRA3B and FRA16D replicate late, whereas FRA7G and FRA7H replicate in mid-S), APH induces a significant delay in replication, thereby linking late or slow replication to CFS expression. However, there are no reports of the effect of low doses of APH on cell cycle progression, origin activation and replication fork progression, as well as their relationship to fragile site expression.
In this study, we show that APH treatment slows the DNA replication rate across the entire genome throughout the S phase. This effect could be the result of replication fork stalling, slower fork movement and/or a decrease in origin firing in response to the S-phase checkpoint. To characterize the replication dynamics within CFS and non-fragile regions (NCFSs) under basal conditions, and to evaluate the effects of APH, we mapped four origins of replication within a 50 kb region of FRA3B. Our analysis of replication dynamics suggests that CFSs behave differently, i.e. they have a lower origin efficiency and/or faster fork speed, under basal growth conditions. Moreover, APH treatment differentially affects origins within CFS versus NCFS regions. Our data support a model in which APH treatment slows replication fork movement to a greater extent in proximity to CFS origins, e.g. APH may affect origin efficiency and/or block some replication forks very close to the origins within CFS sequences. Overall, our results shed new insights into the mechanisms by which CFSs exhibit greater sensitivity to APH-induced replication stress.
RESULTS
APH treatment extends the S phase and slows the replication rate
We assessed the effect of APH on the global replication dynamics of human lymphoblastoid cells by flow cytometric analysis of the progression of cells synchronized in G1/S through the cell cycle in the presence or absence of 0.4 µm APH. Upon release from the block, the majority of the cells reach early-S phase by 2 h, mid-late-S phase by 4 h and late-S to G2 phase by 6 h; a distinct G2 peak is observed at 7–8 h (Fig. 1A). With APH treatment, the cells progress very slowly and gradually through the S phase (Fig. 1B). The majority of the untreated cells are in early-S phase by 4–7 h, mid-S phase by 8–12 h and late-S phase between 14 and 18 h. A G2 peak is evident between 18 and 22 h. Thus, APH slows the replication rate throughout the S phase, extending the S phase from 7 h in untreated cells to 20 h in APH-treated cells. This result suggests that replication forks progress more slowly or stall in APH-treated cells and/or that fewer origins are active. Of note, the low dose of APH used in this study has been shown to activate the S-phase checkpoint (12,13); thus, a decrease in the number of active origins is anticipated.
Figure 1.

Analysis of the effect of APH on cell cycle progression in lymphoblastoid cells. Cells in log phase were synchronized at the G1/S border by a double-thymidine block, and released in the (A) absence or (B) presence of APH. Cells were harvested at 1 or 2 h intervals as indicated to the right of each histogram, stained with PI, and analyzed by flow cytometry.
Mapping origins of replication within FRA3B
To examine the effect of APH on DNA replication further, and to address why CFSs are more susceptible to replication interference than other regions, we asked whether the replication dynamics at CFSs differ from that of NCFS regions. To this end, we mapped several origins of replication within the most frequent CFS, FRA3B. The results of previous studies in our laboratory using fluorescence in situ hybridization (FISH)-based analysis of replication timing suggested that there is at least one origin of replication within the region surrounding exon 5 of the FHIT/FRA3B locus (region including the HP2A probe, Fig. 2A and B) (14). To examine this possibility, we used the nascent strand DNA abundance assay to screen for origins of replication within a 50 kb region containing the sequences encompassed by the HP2A probe (chromosome coordinates 60 430 971–60 481 190, NCBI Build 35) (15). The assay is based on the premise that, in an asynchronous population, there is more newly replicating (nascent) DNA at or near the origins than farther away from origins. Initial analysis of nascent strand DNA abundance by competitive PCR using multiple pairs of primers across the 50 kb region of the FRA3B revealed two peaks of nascent strand DNA at regions amplified, suggesting the presence of at least two potential origins within this region (data not shown).
Figure 2.

Mapping origins of replication within the FRA3B. (A) Location of the FRA3B region within the FHIT gene, and of the 50 kb region of interest within FRA3B containing the sequences encompassed by the HP2A probe. All of the chromosomal coordinates correspond to NCBI Build 35. (B) Location of primers used for the real-time PCR for (a) FRA3B ori 1, (b) ori 2 and (c) ori 3. (C) Microarray analysis of nascent strand DNA in untreated cells. The ‘probe location’ bar shows the location of probes included on the microarray. The nascent strand DNA abundance data (log2 ratio of nascent strand DNA signal over G1 DNA signal) obtained for each of the four sets of probes represented on the microarray (probes representing the forward and reverse strands are present in duplicate: FWD1, FWD2, REV1, REV2), and the location of the mapped origins are shown across a 50 kb region within FRA3B for two independent experiments.
We pursued the mapping of origins within this 50 kb region of FRA3B by using a high-throughput microarray-based approach developed in our laboratory (16). This non-PCR-based approach employs a highly tiled microarray platform, thereby minimizing potential bias that may be introduced by the amplification steps, and maximizing the number of probes that detect a high level of nascent strand DNA across the potential origin. By microarray analysis of nascent strand DNA from two independent experiments using asynchronous cells, we mapped four origins within the 50 kb region of FRA3B: ori 1–4 (Fig. 2C, and Supplementary Material, Table S1). FRA3B ori 4 appears to correspond to an origin region encompassing at least two initiation sites; using our peak finder criteria, the telomeric initiation site was detected in some, but not all experiments (note the narrow ori 4 detected in Experiment 1 in Fig. 2C, and data not shown). This result is a function of our method for analyzing the microarray data (see Materials and Methods), whereby any two origins located less than 2 kb apart were merged into a single origin region. Of note, FRA3B ori 2 also corresponds to an origin region, which is characterized in detail in Fig. 3. A fifth origin, centromeric of ori 4, was detected in only one experiment (Experiment 2 in Fig. 2C), suggesting that this origin may be a false positive.
Figure 3.

Origin confirmation of (A) FRA3B ori 2 and (B) FRA3B ori 3 using real-time PCR analysis of nascent strand DNA abundance, and a ChIP assay. The top panels illustrate an expansion of the nascent strand DNA abundance data obtained by microarray analysis (from Fig. 2). Real-time PCR quantification within a 5–9 kb region spanning the FRA3B ori 2 and ori 3 origins using closely spaced primers (Supplementary Material, Table S2) of nascent strand DNA (middle panels) and DNA immunoprecipitated with ORC6 antibody (lower panels). The ChIP results are presented as the fold-enrichment over the value obtained using the primer 1 for FRA3B ori 2. Both assays were performed independently three times (n = 3), and all real-time PCR reactions were performed in triplicate for each primer pair. The average and standard error of the results obtained for the three independent experiments are represented for both assays.
To validate our origin mapping results, we performed two additional techniques to confirm that ori 1–3 are bona fide origins. For this purpose, we designed closely spaced primers within a 5–12 kb region encompassing FRA3B ori 1–3 (Fig. 2B and 3, and Supplementary Material, Fig. S2) and analyzed the abundance of nascent strand DNA isolated from asynchronous, lymphoblastoid cells in log phase growth from three independent preparations by SYBR Green-based real-time PCR (Fig. 3 and Supplementary Material, Fig. S2). As a control, we analyzed the abundance of nascent strand DNA within a 6–9 kb region encompassing the well-known MYC origin and two origins previously mapped on chromosome 22 using our microarray-based method (TBC1D10A and RNF185 origins) (Supplementary Material, Fig. S2) (16,17). We also used another independent assay, chromatin immunoprecipitation (ChIP) with an antibody for ORC6, a major protein component of the pre-replication complex (Fig. 3 and Supplementary Material, Fig. S2). Of note, this ChIP assay was previously used to validate our microarray-based origin mapping method and the mapping of the RNF185 origin (16). When comparing the results of the nascent strand DNA quantification by microarray (two independent experiments) and by real-time PCR (three independent experiments) with the results of the ChIP experiments (three independent experiments), we observed a direct correlation between the different origin mapping methods for FRA3B ori 3 and RFN185 (Fig. 3B and Supplementary Material, Fig. S2). For FRA3B ori 2, we observed at least two ORC6 binding sites suggesting that FRA3B ori 2 corresponds to an origin region encompassing at least two initiation sites near primer pairs 4 and 7 (Fig. 3A). Due to the nature of the nascent strand abundance assay (size of the DNA fragments) and the lower density of microarray probes around primer 7, the presence of these multiple closely spaced initiation sites was not as noticeable by microarray and real-time PCR analysis (Fig. 3A). In conclusion, we mapped the first active origins of replication within a 50 kb region of FRA3B, an initial step that is essential for further characterization of the replication dynamics at CFS in untreated and APH-treated cells.
FRA3B origins behave differently from origins within NCFS regions in untreated cells
To assess potential differences in the replication dynamics between origins mapped in CFS and NCFS regions in untreated cells, we compared the abundance of nascent strand DNA at the FRA3B ori 1–3, as well as the three control origins, the early-firing MYC origin (18), the early-replicating TBC1D10A origin and the mid-to-late-replicating RNF185 origin (16,19), in three independent experiments using nascent strand DNA from asynchronous cells (Fig. 4). Similar to FRA3B ori 1–4, the latter two control origins were first identified in our laboratory by microarray analysis of nascent strand DNA, and were chosen to minimize any potential bias in replication dynamics, such as variations in origin efficiency and replication timing (16). Nascent strand DNA from three independent experiments was quantified using SYBR Green-based real-time PCR with closely spaced primers designed within a 3–12 kb region encompassing each origin (Supplementary Material, Table S2, and Fig. 4), and analyzed using a theoretical model that we developed. This model demonstrates that both the shape and the height of the nascent strand DNA peaks are determined by the speed of the replication forks and the origin efficiency (see Material and Methods). However, one cannot directly discriminate between an effect on the fork speed movement versus the origin efficiency when comparing different nascent strand abundance profiles for different regions or treatments.
Figure 4.

Analysis of nascent strand DNA abundance at (A) the MYC origin, (B) the TBC1D10A origin, (C) the RNF185 origin and (D) the FRA3B ori 1, (E) ori 2 and (F) ori 3 in untreated cells (black) and APH-treated cells (gray). The X-axis illustrates the distance of each primer from the center of the origin (point zero). The location of the primers for FRA3B ori 1–3, a1–8, b1–8 and c1–8, respectively, MYC, TBC1D10A and RNF185 are shown in Fig. 2B and Supplementary Material, Fig. S2. The Y-axis indicates the nascent strand DNA abundance; note that the y-axis scale differs for control and FRA3B origins. The average and standard error of the nascent strand DNA abundance obtained for three independent experiments each quantified in triplicate are plotted across the five regions analyzed. The data were adjusted in two steps, first for the total number of cells, and then corrected for the number of cells in S phase and the length of S phase (see Material and Methods). The P-values associated with the comparisons between the nascent strand abundance levels observed in untreated and APH-treated cells for each region are indicated in each graph (see summary table of the statistical results in Fig. 5B).
When comparing the real-time PCR results obtained for untreated cells, we detected significantly less nascent strand DNA at FRA3B ori 1–3 in comparison with the MYC, TBC1D10A and RNF185 origins (Fig. 4 and 5). This result suggests that the forks initiating from the FRA3B ori 1–3 are moving faster than those from the MYC, TBC1D10A and RNF185 origins, and/or that FRA3B ori 1–3 are less efficient than the control origins. By using FISH analysis, Kerem and colleagues determined that the completion of DNA replication assessed by the conversion of singlet signals to doublet signals occurs slowly within two CFSs, FRA7G (five probes examined spanning an ∼550 kb-region) and FRA7H (eight probes examined spanning an ∼260 kb-region) (20,21). Thus, we favor the hypothesis that the lower levels of nascent strand DNA observed at FRA3B ori 1–3 results from lower origin efficiency. In summary, our results indicate that CFS origins behave differently than NCFS origins, which could be responsible, in part, for the high sensitivity to replication stress observed within CFSs.
Figure 5.

Representation of the statistical analysis of nascent strand DNA abundance at the FRA3B ori 1–3 and the control origins. (A) Bar graph showing the average and standard error of all of the nascent strand DNA values obtained for three independent experiments, each quantified in triplicate across the FRA3B ori 1–3 regions and the control origins (MYC, TBC1D10A and RNF185) for untreated (black bars) and APH-treated cells (gray bars). (B) Table summarizing the results of the statistical analysis of the nascent strand DNA abundance levels for FRA3B ori 1–3 and control origins (MYC, TBC1D10A and RNF185) in untreated and APH-treated cells.
Replication dynamics at FRA3B origins are differentially affected by APH
To examine the effect of APH on the utilization of the four origins mapped within the FRA3B, we isolated nascent strand DNA from asynchronous cells in log phase growth treated with 0.4 µm APH for 24 h, and performed microarray experiment (Supplementary Material, Fig. S3 and Table S1). FRA3B ori 1–4, as well as the MYC, TBC1D10A and RNF185 origins, were all detected as active origins in APH-treated cells (Supplementary Material, Fig. S3, Table S1, and data not shown). FRA3B ori 4, which corresponds to an origin region encompassing at least two initiation sites in untreated cells, was split into two peaks located 2829 bp apart, corresponding to these two initiation sites. This result is likely due to the fact that, in the APH-treated samples, the log2 ratio (Nascent strand DNA/G1) of some of the probes located on the edges of the two initiation sites, including the interval between these two sites, showed low values in comparison with the log2 ratio of the more central probes and, therefore, did not meet our stringent selection criteria.
These results were validated by real-time PCR analysis of nascent strand DNA from three independent nascent strand DNA preparations from APH-treated cells (Fig. 4). To examine the effect of APH treatment on DNA replication, we normalized the nascent strand DNA abundances obtained by real-time PCR amplification by the total number of cells, and then corrected this normalized data for the number of cells in S phase and the length of S phase (see Material and Methods). We detected significantly more nascent strand DNA in APH-treated cells in comparison with untreated cells at all six origins tested, indicating that APH affects the replication dynamics at origins within both CFS and NCFS regions (Figs 4 and 5). Furthermore, based on our theoretical modeling, the increase of nascent strand DNA abundance levels indicates that the replication forks are moving away from the origins more slowly, and/or that the origins are more efficient following APH treatment. On the basis of our analysis of the cell cycle progression of the APH-treated cells, which suggested that replication forks progress more slowly or stall in APH-treated cells and/or that fewer origins are active (Fig. 1), we favor the hypothesis that the increase of the nascent strand DNA abundance level at these origins in APH-treated cells results from the slower speed of the replication forks.
Interestingly, we noted that the relative increase of the nascent strand DNA abundance level observed at the three CFS origins was significantly lower than that of the MYC, TBC1D10A and RNF185 origins (Fig. 5). This effect could be due to either a block in replication fork progression very close to the origins in APH-treated cells, generating very short nascent strand DNA that would be lost during the DNA preparation, and/or that the origin efficiency is affected by the presence of APH, as a result of the suppression of late-firing origins by the S-phase checkpoint (22).
To examine whether the effect observed at the FRA3B origins could be due to the possibility that these origins fire later than the RNF185 origin, we assessed the replication timing of FRA3B ori 2. To this end, cells were synchronized at the G1/S phase of the cell cycle by a double-thymidine block; following the release from the block, nascent DNA was isolated from untreated cells harvested at 2 h intervals for 8 h. Nascent strand DNA abundance was determined at the FRA3B ori 2 by real-time PCR using primer pairs close to the origin, and normalized to the values obtained at a non-origin region, 2.7 kb away from the sequences amplified by the primer pair close to the origin (Supplementary Material, Tables S3 and S4). The MYC origin was used as an early-replicating control, and two origins, one within the RNF185 gene, and the other within the rare fragile site, FRAXA on the X chromosome, were used as mid-to-late-replicating controls (19,23,24).
The peak of nascent strand abundance for the known early origin at MYC was detected 2 h after release from the double-thymidine block, confirming that this origin fires in the early S phase (Fig. 6A). The relatively low values of nascent strand abundance observed for the MYC ori may be due to the likelihood that the activation of the early MYC ori occurred prior to the 2 h timepoint after release from synchronization and sampling of nascent DNA. As expected, the origins at the rare fragile site (FRAXA) and within RNF185 fired mid-to-late in the S phase, 4–6 h after release from the double-thymidine block (Fig. 6C and D). The FRA3B ori 2 showed a maximum peak of nascent DNA abundance 4 h after release from the double-thymidine block and a lower peak at the 6 h timepoint, suggesting that this origin fires in the mid to mid-late S phase of the cell cycle, earlier than RNF185 origin (Fig. 6B). Thus, our results suggest that the significantly lower increase in the nascent strand DNA abundance levels observed in APH-treated cells at the three FRA3B origins is not merely due to the general inhibition of late-firing origins by the replication checkpoint.
Figure 6.

Timing of origin firing using real-time PCR quantification of nascent DNA. (A) MYC. (B) FRA3B ori 2. (C) FRAXA. (D) RNF185. The X-axis shows the time in hours after release from the double-thymidine block, and the Y-axis represents the ratio of nascent DNA abundance in amplifications using the origin versus the non-origin primers. The timing of origin firing was performed independently twice and showed similar results, with FRA3B ori 2 replicating earlier than RNF185. A representative experiment is shown in the figure.
DISCUSSION
We and others have hypothesized that CFSs correspond to regions of the genome that replicate very slowly, and are unable to recover from a delay in DNA synthesis resulting from replication stress (11,25). Using a FISH-based assay Hellman et al. showed that for two CFSs, FRA7H and FRA7G, the completion of DNA replication occurs slowly (20,21). In this report, we mapped the first origins identified within a CFS, and examined the replication dynamics within the FRA3B. Our analysis revealed that significantly less newly replicated DNA was detected at FRA3B ori 1–3 in untreated cells, as compared with the three control origins located within NCFS regions, suggesting that CFS origins may behave differently, e.g. they are less efficient and/or have a faster fork speed. On the basis of our theoretical modeling of the nascent strand DNA abundance assay, and previously published data (20,21), we hypothesize that origins located within CFS sequences may be less efficient than those within NCFS regions.
In this study, we also show that APH treatment slows the DNA replication rate across the entire genome throughout the S phase, suggesting that replication forks progress more slowly or stall in APH-treated cells, and/or that fewer origins are active. We determined that all four FRA3B origins, ori 1–4, and all three control origins are utilized in cells that are exposed to APH. The observation of significantly more nascent strand DNA at each origin in APH-treated cells indicated that APH treatment slows replication fork movement near the origins, allowing the accumulation of nascent strand DNA, and/or increases origin efficiency. On the basis of our analysis of the cell cycle progression, we hypothesize that APH treatment slows replication fork movement near both control and CFS origins, but that this effect is enhanced at CFS origins. The significantly lower increase of the nascent strand DNA abundance at CFS origins in APH-treated cells could be due to a block in replication fork progression very close to the origin, generating very short nascent strands that would be lost during the DNA preparation. An alternative, but not mutually exclusive, explanation is that the origin efficiency may be affected by the presence of APH, leading to the firing of these origins in a lower proportion of the cells within the population, most likely in response to the S-phase checkpoint. However, we showed that FRA3B ori 2 is activated in the mid-late S phase of the cell cycle, indicating that the effect observed at the FRA3B origins is not merely due to a general inhibition of late-firing origins by the replication checkpoint. In any case, our results demonstrate that some primary CFS origins are more sensitive to APH than those assayed within NCFS regions. Nonetheless, many more origins located in both CFS and NCFS regions need to be tested to fully characterize the replication dynamics of CFS origins as well as the effects of APH on these origins.
Our understanding of the S-phase checkpoint in human cells, especially under conditions of replication stress, is incomplete. In yeast and Xenopus, the S-phase checkpoint inhibits the initiation of late-firing replication origins (22). Paradoxically, it has been shown that low doses of APH result in both inhibition of the firing of primary origins, and in the firing of novel (secondary) origins. Indeed, the results of Fiber-FISH studies in human cells have demonstrated that low-efficiency, secondary origins fire when the high-efficiency primary origins are stalled in the presence of APH, which is essential for the complete replication of the genome in the presence of replication stress, such as that resulting from low doses of APH (26,27). Although, our nascent strand DNA abundance and microarray assays examined only a 50 kb region of FRA3B, we did not detect any new origins in cells exposed to APH. These results raise the possibility that the 50 kb region of the FRA3B (and by extension, other regions of the FRA3B) is deficient in secondary origin activation. Ge et al. proposed that the S-phase checkpoint may repress origin activation in certain regions of the genome and activate secondary origins in other regions during some forms of replication stress, e.g. low doses of APH (27); thus, we cannot exclude the possibility that the 50 kb region of the FRA3B corresponds to a region where both primary origins are repressed and secondary origins are not activated by the S-phase checkpoint.
In summary, our results demonstrate that some primary origins within CFS behave differently than those within NCFS regions in untreated cells, and that CFS origins are differentially affected by APH treatment. Moreover, our data suggest that there is a deficiency of active secondary origins within CFS sequences. We hypothesize that origins within CFSs may be less efficient than those within NCFS regions, and that APH treatment may also affect origin-firing efficiency and/or block some replication forks very close to the origins, an effect that would occur preferentially within CFS sequences. Our results provide new insights toward elucidating the mechanism by which CFSs are more sensitive to replication stress, and they raise several additional questions. For example, are CFS regions affected differently than NCFS sequences by the S-phase checkpoint in the presence of low doses of APH? Are secondary origins more likely to fail to be activated by the S-phase checkpoint? Are replication forks more prone to stall within CFS regions? Furthermore, are these stalled replication forks less likely to be detected and stabilized within CFSs than in other non-fragile regions of the genome? The identification of origins within CFSs provides new resources that can be used to begin to address these and other questions surrounding replication dynamics within CFSs.
MATERIALS AND METHODS
Cell culture, cell cycle synchronization and analysis
Epstein-Barr virus-transformed lymphoblastoid cells (cell line 11365) with a normal diploid karyotype (46,XX) were cultured in RPMI 1640 supplemented with 1% HEPES, 100 units/ml Penicillin, 100 µg/ml streptomycin and 10% fetal bovine serum (FBS) (all from Invitrogen) at 37°C in a humidified 5% CO2/95% air atmosphere. Where necessary, APH (Sigma) was added to the culture medium at a final concentration of 0.4 µm. Of note, to minimize experimental error during each independent experiment, the cells were divided into two culture flasks, and APH was added to one of the two flasks. Cells were synchronized at the G1/S border of the cell cycle by using a 4 mm double-thymidine block. In brief, cells were cultured in the presence of 4 mm thymidine (Sigma) for 12 h, then washed with media without FBS, resuspended in fresh media without additional thymidine and incubated for 9 h. The cells were cultured again in the presence of 4 mm thymidine for 12 h then washed with media without FBS. During the second release, cells were suspended in complete media supplemented with APH where necessary. Cells were harvested at 60–120 min intervals. For cell cycle analysis, cells were harvested and fixed in 70% ethanol. The fixed cells were stained with propidium iodide-containing buffer (40 mm Tris–HCl, 0.8% NaCl, 21 mm MgCl2, 0.05% NP-40, 50 µg/ml propidium iodide (PI, Sigma), 1% RNase A) for 30 min, followed by DNA content analysis using a FACSCalibur flow cytometer (BD Biosciences). Cells (50–100 × 106) in logarithmic phase growth were harvested, fixed at a final concentration of 0.5x10⁶ cells/ml in 30% PBS/70% ethanol and stored at −20°C for at least 30 min. To estimate the percentage of cells in S phase of the cell cycle in an asynchronous population, untreated and APH-treated cells (0.4 µm APH for 24 h) were stained with PI as described previously (16) and analyzed using a FACSCalibur flow cytometer. The percentages of cells in S phase were obtained by applying a Watson Pragmatic model to the DNA content profiles, using FlowJo software (Supplementary Material, Fig. S1). We analyzed five independent experiments and estimated that 29.9 ± 0.5% and 61.6 ± 1.1% of the cells are in S phase in untreated and APH-treated cell populations, respectively.
Isolation of nascent strand DNA and chromatin immunoprecipitation
In all experiments, nascent strand DNA (300 bp–1 kb size range) was isolated from asynchronous cells according to the method described by Giacca et al. (15). Chromatin immunoprecipitation (ChIP) using ORC6 antibody (05-938, Upstate) was performed according to the protocol provided by Upstate, Inc. (http://www.upstate.com) with the modifications described previously (16).
Microarray construction, hybridization and analysis
The construction of the arrays, the labeling of DNAs, the microarray hybridization and scanning were performed by the Roche NimbleGen Service Laboratory as described previously (16,28). The preparation of the nascent strand DNA and the G1 DNA for the microarray experiments, and the analyses of log2 ratios (Nascent strand/G1 DNA signals) were carried out as described previously (16). The microarray platform used in this study is highly tiled, covering both DNA strands (forward, FWD, and reverse, REV), with each probe present in duplicate on the array, creating four data sets, FWD1, FWD2, REV1 and REV2. The microarray analysis and ‘origin peak finding method’ were carried out as described previously (16). Briefly, a 625 nt sliding window was moved across each data set. Within the window, a probe was considered to ‘qualify’ if its log2 ratio was above a set cut-off. A peak was identified when the number of qualifying probes was above a set percentage of the probes within the window (from 20–100% of the probes). The ‘start position’ of the first qualifying probe and the end position of the last qualifying probe were set as the start and ‘end positions’ of the peak. Given the size of the nascent strand DNA fragments used for the experiment (300–1000 nt), we elected to merge any two peaks located less than 2 kb apart into a single origin region.
SYBR Green-based real-time PCR assays
Primers used for the SYBR Green-based real-time PCR assays are shown in Supplementary Material, Tables S2 and S3. The PCR reactions were carried out using a 96-well plate real-time PCR machine (ABI-Step one plus) and the Fast SYBR® mix (ABI), following the manufacturer's protocol (Figs 3–5 and Supplementary Material, Fig. S2). The nascent strand DNA abundance was estimated using a five-point standard curve obtained with a 4-fold serial dilution of sonicated genomic DNA from sorted G1 cells (performed in duplicate), purified as described previously (16). The ChIP sample quantifications were calculated relative to the input sample and are presented as the fold enrichment over a given marker as indicated in the figure legend. For the analysis of the replication timing (Fig. 6), the nascent strand DNA abundance was quantified by real-time PCR reactions using a LightCycler® PCR machine using LightCycler® capillary tubes (Roche) and the R2 real time PCR assay mix (Superarray) as previously described (16). All PCR reactions were performed in triplicate and verified by melting curve analysis and gel electrophoresis. The number of biological replicates is indicated in the figure legend of each figure.
Theoretical modeling of the nascent strand DNA abundance assay
Throughout the course of S phase, the probability of an origin (Orii) firing is described by the probability density function:
where t is the time from the start of S phase, which we define as having a length of L. After initiation, the replication forks will progress outward from Orii along the line xi, with the origin at xi = 0. Replication forks move in either direction; however, for modeling purposes, it is only necessary to consider one side of the replication fork. For simplicity, we will consider the fork moving in the positive direction. Fork velocity is represented by vi(xi). We do not assume that v is constant, presenting it as a function of distance, nor do we assume that it is smooth, only that it is continuous such that:
| 1 |
has a real solution, where Δt is the time it takes a replication fork to travel from the origin to xi. Furthermore, setting it as a function of distance allows us to model the effects of replication barriers and site-specific stalling. Finally, we introduce εi, the probability that Orii will fire within a given cell cycle, which we refer to as the origin ‘efficiency’. For highly efficient origins, ε = 1; for less efficient ones, ε < 1 and for inefficient origins, ε<<1. Indeed, any arbitrary, non-origin position in the genome can be considered as an origin of efficiency ε = 0. When we use εi as a scalar factor of the density function, we arrive at the modified cumulative distribution function:
| 2 |
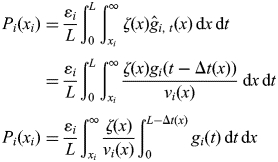
The nascent strand abundance assay, whether analyzed by PCR or microarrays, tests for the presence of newly formed DNA a certain distance from the origin. The probability of finding a nascent strand of length xi is determined by two factors: the probability of the replication fork reaching xi and the probability, ζ(x), of isolating a strand of DNA of length xi. This can be modeled by the probability density function:
| 3 |
where ĝi,t(x) is the transformation of the probability density function, gi(t), from a temporal to a spatial frame of reference:
| 4 |
Since a strand of DNA will be detected if the fork has reached or passed xi, we are interested in evaluating the accumulation of strands of DNA of length xi or longer, leading us to the integral:
| 5 |
Furthermore, as we are not interested in DNA from cells at a specific timepoint, but instead from cells throughout S phase, we employ the first mean value theorem for integration to arrive at:
| 6 |
Eq. (4) introduces the mapping of the gi onto a spatial frame of reference. To do that, we employ the change-of-variable rule for probability density functions:
| 7 |
where in this case, U = t−Δt(xi) and Y=xi. Making these substitutions and substituting in Eq. (1):
| 8 |
| 9 |
Placing this back into Eq. (6), and rearranging the integrals:
 |
10 |
Since we are interested in nascent strand DNA abundance and not a mere probability function, we multiply the entire equation by χ, the percent of cells in S phase, to give us the equation for abundance:
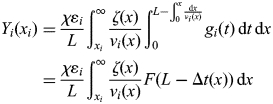 |
11 |
Note that for each cell in S phase, we can only obtain a single strand of nascent DNA for an origin. Therefore, χ is actually expressed in terms of strands of DNA. Finally, we generally assume that replication forks progress rapidly beyond the limits of size selection (>1 kb), such that for all values of xi less than the upper bounds of the size selection, F(L—Δt(xi))≈1. This allows us to simplify the equation to give us the final model:
| 12 |
This model shows a competing role for velocity and efficiency in determining peak shape. Likewise, the length of S phase and the number of cells in S phase are in a balance. In addition, stalling of the fork at a specific point (vi → 0) will cause the inner integral of Eq. (11), the cumulative density function, to collapse to zero, causing the peak itself to show a sudden discontinuity as is expected.
Adjustment method of the nascent strand DNA values for statistical analysis
The nascent strand DNA abundance values generated by SYBR Green-based real-time PCR were adjusted in two steps, allowing us to compare the results obtained from untreated and APH-treated cells (Figs 4 and 5). Briefly, the data were first normalized to reach equal total number of cells between samples within a given experiment (untreated and APH-treated paired samples), then corrected for the number of cells in S phase (χ) and the length of S phase (L), which both differ between untreated and APH-treated cells (see previous section). In detail, the normalization step was done for each experiment independently by multiplying all of the real-time PCR values obtained from the APH-treated samples by the average ratio (untreated/APH-treated) of the values obtained for three non-origin primer sets on chr22 and near FRAXA (1.49 ± 0.12, 1.12 ± 0.12 and 0.83 ± 0.04 for experiments 1–3, respectively) (Supplementary Material, Table S2). These non-origin primer sets were designed within regions of the genome found consistently to have very low nascent strand DNA values in the microarray assay for both untreated and APH-treated samples, in multiple experiments. We assumed that the values obtained by real-time PCR with the non-origin primers correspond to the background level due to DNA breakage occurring during the DNA purification steps. Of note, this normalization step had a minimal impact on the adjustment of the data. The correction step was done by dividing all of the values obtained for the untreated samples by 4.3 (29.9% of cells in S phase of 7 h duration), and the values obtained for APH-treated samples by 3.1 (61.6% of cells in S phase of 20 h duration).
Statistical analysis of the differences in nascent strand DNA abundance levels
The nascent strand DNA data were obtained from a set of three independent experiments. Within each experiment, amplifications were performed in triplicate for each primer, using nascent strand DNA from APH-treated and untreated cells. These data were analyzed using a mixed effects model, with ‘experiment’ as a random effect, and ‘treatment’, ‘distance from the origin’ (primer) and ‘regions’ (FRA3B versus control origins) modeled as fixed effects.
DATA DEPOSITION
The data described in this publication have been deposited in EMBL-EBI's ArrayExpress (http://www.ebi.ac.uk/microarray-as/aer/entry, accession number E-TABM-348).
SUPPLEMENTARY MATERIAL
FUNDING
This work was supported by Public Health Service grant (CA41644 to M.M.L.) and T32 HD07009.
Supplementary Material
ACKNOWLEDGEMENTS
We are grateful to the members of the Le Beau Laboratory, Drs. Lucia Rothman-Denes, Douglas Bishop, Stephen Kron, Paul Mueller and Qingqing Xu for helpful discussions, to Drs. Lucy Godley and Aaron Turkewitz for assistance with the isolation of nascent strand DNA and to Melissa Leone for her technical help with the high-throughput real-time PCR assay.
Conflict of Interest statement. None declared.
REFERENCES
- 1.Glover T.W., Arlt M.F., Casper A.M., Durkin S.G. Mechanisms of common fragile site instability. Hum. Mol. Genet. 2005;14(Spec. No. 2):R197–R205. doi: 10.1093/hmg/ddi265. [DOI] [PubMed] [Google Scholar]
- 2.Glover T.W. Common fragile sites. Cancer Lett. 2006;232:4–12. doi: 10.1016/j.canlet.2005.08.032. [DOI] [PubMed] [Google Scholar]
- 3.Cox C., Bignell G., Greenman C., Stabenau A., Warren W., Stephens P., Davies H., Watt S., Teague J., Edkins S., et al. A survey of homozygous deletions in human cancer genomes. Proc. Natl. Acad. Sci. U S A. 2005;102:4542–4547. doi: 10.1073/pnas.0408593102. [DOI] [PMC free article] [PubMed] [Google Scholar]
- 4.Gorgoulis V.G., Vassiliou L.V., Karakaidos P., Zacharatos P., Kotsinas A., Liloglou T., Venere M., Ditullio R.A., Jr, Kastrinakis N.G., Levy B., et al. Activation of the DNA damage checkpoint and genomic instability in human precancerous lesions. Nature. 2005;434:907–913. doi: 10.1038/nature03485. [DOI] [PubMed] [Google Scholar]
- 5.Smith D.I., McAvoy S., Zhu Y., Perez D.S. Large common fragile site genes and cancer. Semin. Cancer Biol. 2007;17:31–41. doi: 10.1016/j.semcancer.2006.10.003. [DOI] [PubMed] [Google Scholar]
- 6.Glover T.W., Berger C., Coyle J., Echo B. DNA polymerase alpha inhibition by aphidicolin induces gaps and breaks at common fragile sites in human chromosomes. Hum. Genet. 1984;67:136–142. doi: 10.1007/BF00272988. [DOI] [PubMed] [Google Scholar]
- 7.Matsuyama A., Shiraishi T., Trapasso F., Kuroki T., Alder H., Mori M., Huebner K., Croce C.M. Fragile site orthologs FHIT/FRA3B and Fhit/Fra14A2: evolutionarily conserved but highly recombinogenic. Proc. Natl. Acad. Sci. U S A. 2003;100:14988–14993. doi: 10.1073/pnas.2336256100. [DOI] [PMC free article] [PubMed] [Google Scholar]
- 8.Zlotorynski E., Rahat A., Skaug J., Ben-Porat N., Ozeri E., Hershberg R., Levi A., Scherer S.W., Margalit H., Kerem B. Molecular basis for expression of common and rare fragile sites. Mol. Cell. Biol. 2003;23:7143–7151. doi: 10.1128/MCB.23.20.7143-7151.2003. [DOI] [PMC free article] [PubMed] [Google Scholar]
- 9.Toledo F., Coquelle A., Svetlova E., Debatisse M. Enhanced flexibility and aphidicolin-induced DNA breaks near mammalian replication origins: implications for replicon mapping and chromosome fragility. Nucleic Acids Res. 2000;28:4805–4813. doi: 10.1093/nar/28.23.4805. [DOI] [PMC free article] [PubMed] [Google Scholar]
- 10.Laird C., Jaffe E., Karpen G., Lamb M., Nelson R. Fragile sites in human chromosomes as regions of late-replicating DNA. Trends Genet. 1987;3:274–281. [Google Scholar]
- 11.Lucas I., Palakodeti A., Le Beau M.M. The Implications of DNA Replication in Common Fragile Site Expression. In: Arrieta I., Penagarikano O., Télez M., editors. Fragile Sites: New Discoveries and Changing Perspectives. Hauppauge, NY: Nova Science Publishers, Inc.; 2007. pp. 67–98. [Google Scholar]
- 12.Casper A.M., Nghiem P., Arlt M.F., Glover T.W. ATR regulates fragile site stability. Cell. 2002;111:779–789. doi: 10.1016/s0092-8674(02)01113-3. [DOI] [PubMed] [Google Scholar]
- 13.Durkin S.G., Glover T.W. Chromosome fragile sites. Annu. Rev. Genet. 2007;41:169–192. doi: 10.1146/annurev.genet.41.042007.165900. [DOI] [PubMed] [Google Scholar]
- 14.Le Beau M.M., Rassool F.V., Neilly M.E., Espinosa R., III, Glover T.W., Smith D.I., McKeithan T.W. Replication of a common fragile site, FRA3B, occurs late in S phase and is delayed further upon induction: implications for the mechanism of fragile site induction. Hum. Mol. Genet. 1998;7:755–761. doi: 10.1093/hmg/7.4.755. [DOI] [PubMed] [Google Scholar]
- 15.Giacca M., Pelizon C., Falaschi A. Mapping replication origins by quantifying relative abundance of nascent DNA strands using competitive polymerase chain reaction. Methods. 1997;13:301–312. doi: 10.1006/meth.1997.0529. [DOI] [PubMed] [Google Scholar]
- 16.Lucas I., Palakodeti A., Jiang Y., Young D.J., Jiang N., Fernald A.A., Le Beau M.M. High-throughput mapping of origins of replication in human cells. EMBO Rep. 2007;8:770–777. doi: 10.1038/sj.embor.7401026. [DOI] [PMC free article] [PubMed] [Google Scholar]
- 17.Trivedi A., Waltz S.E., Kamath S., Leffak M. Multiple initiations in the c-myc replication origin independent of chromosomal location. DNA Cell Biol. 1998;17:885–896. doi: 10.1089/dna.1998.17.885. [DOI] [PubMed] [Google Scholar]
- 18.Brylawski B.P., Cohen S.M., Longmire J.L., Doggett N.A., Cordeiro-Stone M., Kaufman D.G. Construction of a cosmid library of DNA replicated early in the S phase of normal human fibroblasts. J. Cell. Biochem. 2000;78:509–517. doi: 10.1002/1097-4644(20000901)78:3<509::aid-jcb15>3.0.co;2-d. [DOI] [PubMed] [Google Scholar]
- 19.White E.J., Emanuelsson O., Scalzo D., Royce T., Kosak S., Oakeley E.J., Weissman S., Gerstein M., Groudine M., Snyder M., et al. DNA replication-timing analysis of human chromosome 22 at high resolution and different developmental states. Proc. Natl. Acad. Sci. U S A. 2004;101:17771–17776. doi: 10.1073/pnas.0408170101. [DOI] [PMC free article] [PubMed] [Google Scholar]
- 20.Hellman A., Rahat A., Scherer S.W., Darvasi A., Tsui L.C., Kerem B. Replication delay along FRA7H, a common fragile site on human chromosome 7, leads to chromosomal instability. Mol. Cell Biol. 2000;20:4420–4427. doi: 10.1128/mcb.20.12.4420-4427.2000. [DOI] [PMC free article] [PubMed] [Google Scholar]
- 21.Hellman A., Zlotorynski E., Scherer S.W., Cheung J., Vincent J.B., Smith D.I., Trakhtenbrot L., Kerem B. A role for common fragile site induction in amplification of human oncogenes. Cancer Cell. 2002;1:89–97. doi: 10.1016/s1535-6108(02)00017-x. [DOI] [PubMed] [Google Scholar]
- 22.Gilbert D.M. Replication origin plasticity, Taylor-made: inhibition vs recruitment of origins under conditions of replication stress. Chromosoma. 2007;116:341–347. doi: 10.1007/s00412-007-0105-9. [DOI] [PubMed] [Google Scholar]
- 23.Hansen R.S., Canfield T.K., Lamb M.M., Gartler S.M., Laird C.D. Association of fragile X syndrome with delayed replication of the FMR1 gene. Cell. 1993;73:1403–1409. doi: 10.1016/0092-8674(93)90365-w. [DOI] [PubMed] [Google Scholar]
- 24.Howell R.T., McDermott A. Replication status of the fragile X chromosome, fra(X)(q27), in three heterozygous females. Hum. Genet. 1982;62:282–284. doi: 10.1007/BF00333538. [DOI] [PubMed] [Google Scholar]
- 25.Rahat A., Hellman A., Kerem B. A Common Replication Pattern Underlies the Fragility at Gragile Site Regions. In: Arrieta I., Penagarikano O., Télez M., editors. Fragile Sites: New Discoveries and Changing Perspectives. Hauppauge, NY: Nova Science Publishers, Inc.; 2007. pp. 99–115. [Google Scholar]
- 26.Woodward A.M., Gohler T., Luciani M.G., Oehlmann M., Ge X., Gartner A., Jackson D.A., Blow J.J. Excess Mcm2–7 license dormant origins of replication that can be used under conditions of replicative stress. J. Cell Biol. 2006;173:673–683. doi: 10.1083/jcb.200602108. [DOI] [PMC free article] [PubMed] [Google Scholar]
- 27.Ge X.Q., Jackson D.A., Blow J.J. Dormant origins licensed by excess Mcm2–7 are required for human cells to survive replicative stress. Genes Dev. 2007;21:3331–3341. doi: 10.1101/gad.457807. [DOI] [PMC free article] [PubMed] [Google Scholar]
- 28.Selzer R.R., Richmond T.A., Pofahl N.J., Green R.D., Eis P.S., Nair P., Brothman A.R., Stallings R.L. Analysis of chromosome breakpoints in neuroblastoma at sub-kilobase resolution using fine-tiling oligonucleotide array CGH. Genes Chromosomes Cancer. 2005;44:305–319. doi: 10.1002/gcc.20243. [DOI] [PubMed] [Google Scholar]
Associated Data
This section collects any data citations, data availability statements, or supplementary materials included in this article.