

Abstract
National character stereotypes are widely shared, but do not reflect assessed levels of personality traits. In this article we present data illustrating the divergence of stereotypes and assessed personality traits in north and south Italy, test hypotheses about the associations of temperature and national wealth with national character stereotypes in 49 cultures, and explore possible links to national values and beliefs. Results suggest that warmth and wealth are common determinants of national stereotypes, but that there are also idiosyncratic influences on the perceptions of individual nations.
Keywords: Personality, national character, stereotypes, cross-cultural, Five-Factor Model
Climatic Warmth and National Wealth: Some Culture-Level Determinants of National Character Stereotypes
Anthropologists of the culture-and-personality school argued in the first half of the 20th Century that members of the small, often preliterate cultures they studied shared distinctive features of character—a modal personality—that reflected cultural institutions (Du Bois, 1944). Sociologists extended this idea to modern nations. Inkeles (1997) argued that the idea of national character could be made scientifically respectable through the use of “psychological tests and attitude and value surveys drawn from representative national samples scored by objective and reproducible procedures” (p. vii). However, many other social scientists have regarded ideas of national character as groundless stereotypes, and some have denied even the possibility of group differences in personality (see Pinker, 2002).
Recent research, however, suggests that none of these views is fully justified. There do appear to be real, albeit generally small, differences in the mean levels of personality traits in different cultures (McCrae, 2002; McCrae et al., 2005b), but these real differences are unrelated to shared stereotypes of national character. For example, it is widely believed that the British are reserved (Peabody, 1985), but the psychological tests that Inkeles (1997) recommended show that they are in fact extraverts (McCrae et al., 2005b; Terracciano et al., 2005).
Confusion between national character stereotypes1 and aggregate personality profiles is deeply entrenched. People readily use the language of personality traits to describe the “typical” member of a culture: Italians are said to be passionate, Americans aggressive, Finns silent. Further, these attributes show the same structure in stereotypes as in persons. In the case of assessed personality traits, several models have been proposed (e.g., Ashton et al., 2004; Cloninger, Svrakic, & Przybeck, 1993), but the structure is often described by the Five-Factor Model (FFM; Digman, 1990), with dimensions commonly labeled Neuroticism (N), Extraversion (E), Openness to Experience (O), Agreeableness (A), and Conscientiousness (C). When attributions about the characteristics of a perceived typical culture member are factored across a range of cultures, very similar dimensions emerge (Terracciano et al., 2005). This can most easily be explained by invoking the notion of implicit personality theory (Borkenau, 1992; Bruner & Taguiri, 1954), which holds that people share beliefs about how traits covary. For example, people known to be sociable are generally presumed to be cheerful. The structure of implicit personality theory mirrors the five-factor structure of personality itself, probably because it was acquired, individually and collectively, by observing the real life covariation of traits (McCrae, Jang, Livesley, Riemann, & Angleitner, 2001). When attributions are made about a typical culture member, implicit personality theory shapes these judgments along the lines of the FFM. It must be recalled, however, that the factors found in judgments of national character structure resemble personality factors only in form, not in substance. The perceived Neuroticism of the typical Spaniard has nothing to do with the average level of Neuroticism in the population of Spain. To emphasize that distinction, we will designate factors in national character stereotypes with subscripts: NNCS, ENCS, etc.
Psychologists are thus left with two completely independent culture-level phenomena to explain. Personality psychologists may seek the origins of national differences in mean personality trait levels through studies of culture or of ethnic ancestry (Hofstede & McCrae, 2004). Social psychologists and other social scientists are likely to be more concerned with the determinants of national character stereotypes, and some progress has already been made in identifying these, at least in the elimination of some plausible candidates. The common sense idea that beliefs about national character arise from knowledge of real traits gained by personal and second-hand experience is unsupported; there does not even appear to be a kernel of truth in most national stereotypes (Terracciano et al., 2005). In addition, there is ample evidence that stereotypes are not merely expressions of ethnocentric and xenophobic biases. Both in-group and out-group members typically attribute an evaluatively-mixed set of traits to the typical member of a culture (cf. Fiske, Cuddy, Glick, & Xu, 2002). Again, analyses of the effects of the American-led invasion of Iraq suggest that government policies and actions have little effect on perceptions of a nation's people themselves, at least in the short term (Terracciano & McCrae, in press). Beliefs about national character appear to be impervious to experience at both the individual and the collective level.
An Overview: Geographical Patterns in National Character Stereotypes
The goal of this article is to understand some determinants of national character stereotypes, and a consideration of cultures with similar stereotypes might provide some clues to what these determinants might be. That approach has proven to be fruitful in analyses of aggregate personality traits (Allik & McCrae, 2004; McCrae et al., 2005b). Figure 1 shows the results of a new application of Multidimensional Scaling (MDS) to the national character stereotypes reported by Terracciano et al. (2005). We describe the measures and methods in more detail in Studies 1 and 2; our purpose here is simply to give an overview of the distribution of national character stereotypes. To maximize comparability we used MDS methods modeled on those in Allik and McCrae (2004); as in that article, the top of the figure is associated with NNCS, the right with ENCS. Cultures adjacent in the Figure have similar national character profiles, whereas cultures distant from each other in the MDS space have dissimilar profiles.
Figure 1.

Multidimensional scaling (MDS) plot of 49 cultures, based on a distance matrix of (1 – Pearson r) for the 30 National Character Survey facet scores in the Appendix. Adjacent groups have similar national character profiles. The vertical axis (“North”) is maximally aligned with NNCS, and associated with low ANCS and low CNCS. The horizontal axis (“East”) is maximally aligned with ENCS, and associated with ONCS and low CNCS.
Allik and McCrae (2004) showed striking geographical regularity for personality data, with American and European cultures on the right side of the figure and Asian and African on the left. Such clear patterns do not appear with stereotype data. Why should Argentines and Ugandans, or Ethiopians and Malays, have similar national characters? The only geographic pattern that can readily be discerned in Figure 1 is a tendency for Northern European nations to define the left pole of the horizontal axis, and Latin nations to define the right pole.
Boster and Maltseva (2006) presented a similar analysis of national character cultures stereotypes and identified a dimension of Modernity that appears to be inversely related to the horizontal axis in Figure 1. At least three variables might explain this dimension of national character stereotypes: Northern European nations are climatically colder than Latin nations; they are, in general, wealthier; and, as the association with Modernity suggests, they are more progressive in attitudes and values (Inglehart & Baker, 2000). In this article we present new data illustrating the divergence of assessed personality traits from regional character stereotypes as judged from ingroup and outgroup perspectives; test hypotheses about the influences of temperature (cf. Pennebaker, Rime, & Blankenship, 1996) and national wealth (cf. Fiske et al., 2002) on national character stereotypes; and explore possible links to national values and beliefs.
Study 1: North-South Stereotypes and Aggregate Personality Traits in Italy
Although the perceived character of entire nations can readily be assessed, distinctions within nations are sometimes more salient, especially to its own citizens. In many nations the most relevant distinction is by latitude, with Northerners distinguished from Southerners (Pennebaker et al., 1996). The former are generally held to be colder and more conscientious, the latter to be more hot-blooded and impulsive. These stereotypes seem particularly apt in characterizing perceptions of Northern and Southern Italians (Barzini, 1964). There are historical and geographic reasons for subcultural differences between these regions. The North of Italy is prosperous and heavily industrialized; the South has lower economic development and high unemployment (Central Intelligence Agency, 2006). With respect to poverty, unemployment, primary school dropout rates, and health care statistics a large gap exists between Northern and Southern Italian regions (e.g., see Bonati & Campi, 2005). Even the cuisines are different, with butter and rice prominent in the North, olive oil and pasta in the South. In a study of regional stereotypes, Peabody (1985) found large differences between the two Italian regions on the dimension of impulse-control, with Northerners judged to be tight (e.g., hard-working, cautious, persistent, practical) whereas Southerners were thought to be loose (e.g., impulsive, generous, lazy). Raters from both regions expressed similar views, but Southern Italians were more extreme in their ratings.
In Study 1 we compare perceptions of Northern and Southern Italians by Northern and Southern Italians with assessed personality profiles of Northern and Southern Italians. This design allows us to examine agreement between in-group and out-group raters and to illustrate the independence of perceived regional differences from assessed regional differences in FFM personality traits. It also provides regional evidence on the importance of climatic warmth and wealth as determinants of character stereotypes.
Method
Participants
Four convenience samples of Italians provided data. Perceptions of the typical Northern and Southern Italian were gathered from 31 women and 20 men aged 18-86 (M = 33.9, SD = 12.4) from Naples in Southern Italy and 27 women and 19 men aged 22-57 (M = 31.7, SD = 8.9) from several cities in Northern Italy. Previously collected self-reports of personality traits (Terracciano, 2003) were provided by 209 women and 158 men aged 18-87 (M = 28.1, SD = 10.4), most from Naples, and from 152 women and 56 men aged 18-59 (M = 27.4, SD = 8.8), most from Trieste in Northeastern Italy. All materials were completed anonymously.
Measures
Personality was assessed using the Italian version of the Revised NEO-Personality Inventory (NEO-PI-R; Costa & McCrae, 1992; Terracciano, 2003), a 240-item measure of the FFM. The instrument includes 30 specific facet scales that define the five factors; for example, E is assessed as the sum of scales measuring Warmth, Gregariousness, Assertiveness, Activity, Excitement Seeking, and Positive Emotions. Psychometric properties of the Italian version are comparable to those of the original English version (Terracciano, 2003), and evidence on the reliability and validity of NEO-PI-R scales is provided in the manual (Costa & McCrae, 1992). As in other cross-cultural studies (e.g., McCrae, 2002), scales were standardized as T-scores (M = 50, SD = 10) using American age- and gender-specific norms. Because there were small differences between the two samples in age, gender, and education, residual scores controlling for these variables were analyzed.
Stereotype researchers (e.g., Judd & Park, 1993) often begin by identifying attributes thought to be characteristic of a group or contrasting groups; the focus is thus on traits that are particularly salient, such as the reserve of the English. The present design utilizes a different approach: The attributes of the National Character Survey (NCS; Terracciano et al., 2005) parallel the facet scales of the NEO-PI-R, and the typical member of each culture is rated on all traits, even when they are not salient. The English, for example, are judged to be average on Angry Hostility (see Appendix). Because all these judgments are shared beliefs about characteristics of a group, they can legitimately be considered stereotypes. The use of a standard set of traits facilitates comparisons across many different groups, and previous research indicates that different methods to assess stereotypes produce very similar results (Eagly & Steffen, 1988; Stangor & Lange, 1994).
An Italian version of the NCS was modified to assess perceived regional character. The NCS consists of 30 bipolar items intended to parallel the facets of the NEO-PI-R. For example, the ENCS facet Warmth was assessed by asking how likely, on a five-point scale, the typical Northern or Southern Italian was to be friendly, warm, affectionate versus cold, aloof, reserved. In an international sample (Terracciano et al., 2005), interjudge reliability of the composite NCS scores ranged from .89 to .97. NCS scores for the five factors were calculated as the sum of the six relevant facets. NCS factor and facet scales were standardized as T-scores using international norms (Terracciano et al., 2005).
Profile agreement was quantified as the intraclass correlation (ICC) between two sets of 30 standardized facet scales, calculated by the double entry method. This metric is sensitive to both the shapes of the profiles and their elevation, and is thus an appropriate index of profile agreement (Terracciano & McCrae, 2006). Participants provided ratings of both the typical Northern and the typical Southern Italian in counterbalanced order, but preliminary analyses suggested no order effects (ICCs of first vs. second rating for Northern and Southern Italian targets were .91 and .95, respectively), so data were collapsed across order of administration.
Results and Discussion
Mean NCS profiles for Northern and Southern Italians are shown in Figure 2. Consistent with prevalent views, Southern Italians were thought to be high in ENCS and ONCS, and low in CNCS; Northern Italians were low in ENCS and ANCS, but high in CNCS. In general, facet differences paralleled those of the factor they defined, although there were some exceptions. For example, Southerners were perceived as significantly lower than Northerners on Depression, but higher on Impulsiveness (ps < .001). An examination of facet scales showed that the largest contrasts (partial η2s > .50) were for Warmth, Gregariousness, Positive Emotions, and Openness to Fantasy, on which Southerners were perceived to score higher, and Order, Dutifulness, and Deliberation, on which Northerners were perceived to score higher.
Figure 2.

Perceptions of Northern Italians and Southern Italians on the National Character Survey. The five domains are given at the left; towards the right, the facets are grouped by domain. These are T-scores (M = 50, SD = 10) based on international NCS norms.
Analyses of variance with Target as a repeated factor showed some Target × Rater interactions: Southerners perceived greater regional differences than Northerners on ENCS, ONCS, ANCS, and 12 of the 30 facets. In general, however, judges from both regions agreed on regional stereotypes. ICCs between Northern and Southern raters were .75 for Southern targets and .62 for Northern targets (ps < .001). These findings are consistent with the national character literature, where agreement between in-group and out-group ratings is the rule (Peabody, 1985; Terracciano & McCrae, 2006a).
Figure 3 shows mean personality profiles for Northern and Southern Italian samples. Because scores are based on American norms, these data suggest that Italians describe themselves as high in N (especially Anxiety and Vulnerability) and low in A and C (especially Trust, Compliance, and Competence) compared to Americans. Italians score higher than Americans on Openness to Fantasy and Aesthetics, but lower on Openness to Values. Of more relevance to the interpretation of national stereotypes is the fact that regional differences in assessed personality are trivial. The two profiles in Figure 3 are remarkably similar (ICC = .94, p < .001). The only significant difference was found for Altruism (p < .01), on which Southerners scored about .5 standard deviations higher. Because Southern Italians are also perceived to be more altruistic (Figure 2), this might be viewed as support for the kernel-of-truth hypothesis. Otherwise, however, the assessed personality profiles in Figure 3 show no resemblance to the NCS profiles in Figure 2 (ICCs = .01 for Southern, .03 for Northern Italians).2
Figure 3.

Residualized NEO-PI-R mean scores of northern and southern Italian samples after controlling for differences in age, sex, and education. On the left, the scores for the five factors are plotted; toward the right are the 30 facets, grouped by the factor they define. These are T-scores (M = 50, SD = 10) based on U.S. adult combined sex norms. N = Neuroticism. E = Extraversion. O = Openness to Experience. A = Agreeableness. C = Conscientiousness.
These findings are consistent with the larger study of national character stereotypes, which showed no systematic relation to assessed personality trait levels (Terracciano et al., 2005). But observers familiar with Northern and Southern Italians are likely to find this conclusion counterintuitive, and before dismissing their beliefs, we should reconsider the interpretation of the data. Self-reports of personality traits are not perfect or absolute measures of personality, and the apparent similarly of personality traits from North and South Italy may be due to artifacts.
The most plausible artifactual explanation is that real differences are obscured by frame-of-reference effects (Heine, Lehman, Markus, & Kitayama, 1999). In this scenario, people in South Italy compare themselves to other Southern Italians, whereas people in North Italy compare themselves to other Northern Italians, and this regional norming eliminates differences in mean levels. However, one might wonder why both groups would not compare themselves to Italians in general, a frame of reference that would preserve regional differences. The frame of reference hypothesis also is difficult to reconcile with the fact that there are substantial mean level differences between nations. The data in Figure 3 are plotted against American norms, and show that Italians report themselves to be higher in N and lower in A than Americans. If both Americans and Italians compare themselves to their compatriots, such differences would not appear—unless, of course, other artifacts account for apparent differences between cultures. Such explanations are not parsimonious, but they are possible.
Intuitions about regional differences may be based on something other than personality traits. Traits do not show a one-to-one correspondence with behaviors, because behaviors are powerfully shaped by situations. Perhaps Northern Italians are perceived to be higher in C because they spend more hours working, but perhaps they spend more time working simply because there are more opportunities for employment in the North. If this interpretation is correct, Southern Italians relocated to the North would behave like Northern Italians, and vice-versa.
If stereotypes do not match assessed traits, then at least one of these must be incorrect. The convergence of aggregate scores from self-reports and observer ratings, the meaningful pattern of associations with other culture-level variables, and the historically and geographically coherent distribution of traits (McCrae et al., 2005b) provide some reason to trust assessed traits. However, there are also sound reasons to distrust stereotypes. If the Northern and Southern Italian NCS profiles were both accurate, the profile of the typical Italian in general ought to be intermediate, and average of the two profiles. Instead, the profile for the typical Italian (Terracciano et al., 2005) resembles a typical Southern (ICC = .87), not Northern (ICC = −.72) Italian. Strikingly similar findings were reported by Peabody (1985). It is mathematically impossible that all three stereotypes are correct.
Adopting, then, the provisional view that stereotypes of character are not based on real differences in mean trait levels, what can account for them? It seems likely to be an association in the minds of raters of interpersonal warmth with the climatic warmth of the south; Naples is on average 3°C warmer than Milan (World Climate, 2005). That hypothesis has been supported before within other countries (Pennebaker et al., 1996); we test it across countries in Study 2.
But Southern Italy also differs from Northern Italy economically, with median family income after tax of €18,406 in the South and €24,887 in the North (ISTAT, 2006). Fiske et al. (2002) have argued that the content of stereotypes is determined by perceived status and competition. High status groups are perceived to be more competent, by a kind of group-level application of the fundamental attribution error (Ross, 1977). Here, the greater affluence of Northern Italians may create the impression that they personally are more industrious, organized, and ambitious—higher in C—than are Southern Italians. Fiske et al. (2002) also argued that competition between groups leads to attributions of low warmth; that might explain why Southern Italians describe Northern Italians as cold, though it could not explain why Northerners attribute coldness to themselves.
Study 2: Associations of Temperature and Wealth With National Character Stereotypes in 49 Cultures
Although the literature on national and regional stereotypes often points to the distinction between north and south, it seems likely that the more relevant difference is actually between cold and warm climates. Pennebaker and colleagues (1996) tested Montesquieu's (1989/1748) hypothesis that warm temperatures relax the skin and stimulate the nervous system, such that “warm or hot weather was said to make individuals relatively lazy, pleasure seeking, and impulsive” (p. 372). Pennebaker and colleagues found modest support for these hypotheses,3 but no support for that view was found in a large cross-cultural study of self-reported personality traits; in fact, the only replicable finding relating personality to temperature was that members of nations with warmer climates were higher, rather than lower, on C (Allik & McCrae, 2004). Although hot weather is associated with aggressive behavior (Anderson, 1989; D. C. Schwartz, 1968; Van de Vliert, S. H. Schwartz, Huismans, Hofstede, & Daan, 1989) climate apparently has little to do with individual personality traits, but much to do with perceptions of people. The metaphorical thinking that describes friendly people as warm, passionate people as hot-blooded, and distant people as cold in English and many other languages4 may also shape national stereotypes.
Consistent with this hypothesis, Linssen and Hagendoorn (1994) found that stereotypes about emotionality of seven Western European countries were associated with latitude. In the same study, perceived efficiency was related to social factors, including the economic development of the stereotyped nation. Similarly, power and economic status explained perceptions of competence across six Eastern European countries (Phalet & Poppe, 1997; Poppe & Linssen, 1999; Poppe, 2001). In Study 2 we extend previous research by testing the association of temperature and Gross Domestic Product per capita (GDP) with a wide spectrum of attributed personality traits across 49 cultures from around the world.
It is a fact of economic and political history that nations from temperate zones tend to be wealthier than nations from the tropics; in our sample, the correlation between average temperature and GDP was −.52, N = 49, p < .001. (Other studies using larger samples of countries have shown negative correlations of the same order of magnitude, e.g., Parker, 1995). In our analyses, therefore, we consider the effects of temperature and wealth on national character stereotypes directly and net of each other.
Method
Participants
As detailed in Terracciano et al. (2005), NCS ratings of the typical member of 49 cultures were obtained from 3,989 in-group members. Most raters were college students. Cultures generally corresponded to nations, but we identified as separate cultures groups that were historically and linguistically separate (e.g., Northern Irish and English, French- and German-speaking Swiss). In multiethnic nations (e.g., Russian Federation, Malaysia) raters described the typical member of the dominant ethnic group (Russians, Malays).
Measures
Temperature was operationalized as the average annual 24-hour mean temperature of the capital city (or its airport; World Climate, 2005).5 Temperatures in Zürich and Geneva were used for German- and French-speaking Swiss, respectively; temperatures in Belfast and London were used for Northern Irish and English; and temperatures in Beijing and Hong Kong were used for Chinese from the People's Republic and Hong Kong. Latitude was coded for each city used. GDP per capita (purchasing power parity, $US) estimates in 2002 were taken from an Internet source (World Factbook, 2003).
National stereotypes were assessed using the NCS (see Study 1). The original English version was translated into 27 languages, an independent back-translation into English was reviewed by the first two authors, and revisions were made as needed. Respondents rated the typical member of their culture or subculture. Validity checks based on missing data or repetitive responses suggested that 181 cases (4.3%) were invalid and they were discarded (see Terracciano et al., 2005, Supporting Online Material); occasional missing items were replaced with the neutral response. Items were converted to T-scores using means and standard deviations from the 3,989 valid cases, and scores were averaged across respondents to provide culture-level scores. Domain scores for the NCS are given in Terracciano et al. (2005; Supporting Online Material); facet scores are given in the Appendix.
Results and Discussion
In preliminary analyses, we examined latitude, absolute latitude (i.e., distance from the equator) and temperature as predictors of NCS scales. Because most of the cultures in this sample are from the Northern Hemisphere, latitude and absolute latitude were positively correlated (r = .68, N = 49, p < .001); absolute latitude was strongly related to temperature (r = −.89, p < .001). The three variables had similar patterns of correlations with NCS scales, but correlations with temperature were consistently somewhat larger. Thus, temperature does appear to be the relevant variable, and it was used in subsequent analyses.
Table 1 reports correlations of temperature and GDP with NCS domain and facet scales. The first data column shows that warm temperatures were associated with attributions of high ENCS (especially Warmth, Gregariousness, Excitement Seeking, and Positive Emotions) and high ONCS (particularly Openness to Fantasy, Feeling, and Actions) to the typical culture member. In addition, people in warmer climates were characterized as being high in Trust, Altruism, and Tender-Mindedness, but lower in Order. The largest correlation—a substantial r = .54—was found between annual temperature and attributed interpersonal warmth. The second data column shows correlations controlling for GDP; the correlations are reduced, some to non-significance, but the general pattern is the same. These data provide support for the view that warm climates are associated with stereotypes of metaphorically warm interpersonal traits, but they offer little support to Montesquieu's hypothesis that climatic warmth should be associated with impulsiveness or laziness—or even stereotypic attributions of these traits.
Table 1. Associations of Perceived National Character Traits with Mean Annual Temperature and Gross Domestic Product per capita.
| Temperature | GDP | |||
|---|---|---|---|---|
| NCS Scale | r | r.GDP | r | r.temp |
| NNCS: Neuroticism | −.03 | −.09 | −.11 | −.14 |
| ENCS: Extraversion | .39** | .35* | −.17 | .04 |
| ONCS: Openness | .34* | .28 | −.20 | −.03 |
| ANCS: Agreeableness | .28 | .21 | −.19 | −.06 |
| CNCS: Conscientiousness | −.19 | .04 | .44** | .40** |
| N1NCS: Anxiety | .05 | −.01 | −.12 | −.11 |
| N2NCS: Angry Hostility | −.01 | −.08 | −.12 | −.15 |
| N3NCS: Depression | −.26 | −.31* | .00 | −.16 |
| N4NCS: Self-Consciousness | −.10 | −.12 | .00 | −.06 |
| N5NCS: Impulsiveness | .17 | .11 | −.14 | −.06 |
| N6NCS: Vulnerability | −.02 | −.02 | −.01 | −.02 |
| E1NCS: Warmth | .54*** | .33* | −.60*** | −.44** |
| E2NCS: Gregariousness | .36* | .27 | −.27 | −.10 |
| E3NCS: Assertiveness | −.07 | .15 | .37** | .39** |
| E4NCS: Activity | .04 | .24 | .30 | .38** |
| E5NCS: Excitement Seeking | .28* | .27 | −.10 | .06 |
| E6NCS: Positive Emotions | .45*** | .39** | −.24 | −.01 |
| O1NCS: Fantasy | .48*** | .27 | −.55*** | −.40** |
| O2NCS: Aesthetics | .26 | .22 | −.15 | −.02 |
| O3NCS: Feelings | .41** | .24 | −.45*** | −.30* |
| O4NCS: Actions | .31* | .28 | −.15 | .02 |
| O5NCS: Ideas | −.06 | .04 | .19 | .18 |
| O6NCS: Values | −.07 | .14 | .36* | .38** |
| A1NCS: Trust | .29* | .23 | −.20 | −.06 |
| A2NCS: Straightforwardness | −.15 | −.01 | .26 | .22 |
| A3NCS: Altruism | .38** | .26 | −.33* | −.17 |
| A4NCS: Compliance | .13 | .10 | −.09 | −.02 |
| A5NCS: Modesty | .14 | .03 | −.22 | −.17 |
| A6NCS: Tender-Mindedness | .46*** | .38** | −.29* | −.07 |
| C1NCS: Competence | −.10 | .05 | .29* | .28 |
| C2NCS: Order | −.30* | −.01 | .57*** | .51*** |
| C3NCS: Dutifulness | −.21 | .08 | .52*** | .49*** |
| C4NCS: Achievement Striving | −.12 | .10 | .38** | .38** |
| C5NCS: Self-Discipline | −.08 | .05 | .23 | .23 |
| C6NCS: Deliberation | −.15 | −.05 | .22 | .16 |
Note. GDP = Gross Domestic Product per capita.
p < .05.
p < .01.
p < .001.
The third data column reports correlates of NCS scales with GDP. These in-group perceptions of members of wealthy nations are consistent with out-group ratings of the rich reported by Fiske et al. (2002): Both are seen as low in warmth and high in competence. At the domain level, only CNCS is significantly related to GDP; four of its facets (Competence, Order, Dutifulness, and Achievement Striving) were also related. Within the ENCS domain a differentiated pattern of facet correlates was found: Citizens of wealthier nations were perceived as being high in Assertiveness but low in Warmth. They were also seen as being open to Values, but closed to Fantasy and Feelings, and low in Altruism and Tender-Mindedness. Overall, the portrait is a businesslike one, task-oriented, serious, and interpersonally cold. Because such traits might well lead to the accumulation of wealth, they appear to be attributed to the members of wealthy nations. Controlling for average annual temperature reduces these correlations, especially those suggesting interpersonal coldness, without changing the overall interpretation.6
These results across cultures can be compared to results within Italy. The rank-order correlation of North-South T-score differences from Figure 2 with the zero-order correlations in Table 1 show similar patterns in the two data sets. North-South differences in Italy are strongly related to correlations of personality traits with temperature (r = −.92, N = 35, p < .001) and GDP (r = .86, p < .001) across 49 cultures. Thus, poorer but climatically warmer Southern Italians are described in much the same way as typical members of poorer and warmer countries around the world.
The failure of NCS scores to correlate even minimally with assessed personality profiles has been seen by some as evidence that these in-group characterizations are not valid measures of national character stereotypes (Krueger & Wright, 2006; McGrath & Goldberg, 2006). However, the data in Table 1 are consistent with previous research and theory about stereotypes in general (e.g., Fiske et al., 2002), and provide strong support for the validity of NCS scores at the culture level.
Study 3: National Values and Beliefs
Although temperature and national wealth account for some of the variation in national stereotypes,7 much remains unexplained. NNCS in particular is essentially unrelated to either of those variables. Another source of national stereotypes might be found in the beliefs and values espoused by each culture's members. At the individual level, traits (especially O and A) are related to values (Roccas, Sagiv, S. H. Schwartz, & Knafo, 2002), but values are also presumably learned from one's culture, and it is reasonable to hypothesize that shared beliefs and values might lead to shared perceptions about characteristics of culture members. For example, societies whose members were high in cynicism might attribute undesirable traits to their fellow citizens, whereas those with conservative values might patriotically attribute desirable traits to theirs. Cultures whose members valued intellectual autonomy might see high Openness to Ideas as part of their collective identity.
Aggregate levels of individual beliefs and values have been extensively studied by cross-cultural psychologists, most following the lead of Hofstede (1980, 2001), whose dimensions of culture, particularly Individualism/Collectivism, have been highly influential. Hofstede also identified the cultural dimensions of Power Distance (an acceptance of hierarchy and status differences), Uncertainty Avoidance (a defensive reliance on rules and routines to cope with stress), Masculinity (preference for task goals over interpersonal goals at work), and Long-Term Orientation (valuing persistence, thrift, and modesty).
S. H. Schwartz (1994) continued the tradition of Rokeach (1973) in studying values around the world and characterized cultures in terms of seven basic value types: Conservatism (e.g., honoring elders), Affective Autonomy (enjoying life), Intellectual Autonomy (valuing creativity), Hierarchy (valuing power and authority), Mastery (valuing success and independence), Egalitarian Commitment (valuing freedom and equality), and Harmony (valuing nature and the environment). More recent value type data from 40 countries overlapping our sample were obtained from the Social Sciences Data Center (ISDC) at the Hebrew University.
Inglehart (1997) derived two dimensions, Traditional vs. Secular-Rational values and Survival vs. Self-Expression values, from World Value Surveys data. The former is concerned with religion and patriotism, the latter with physical and economic security. We obtained from Inglehart and Norris (2003) more recent data from 43 countries overlapping our sample.
Bond and colleagues (2004) focused on social beliefs and identified two broad themes at the culture level. Dynamic Externality combines a belief in the power of fate and higher powers (the externality) with a belief in one's ability to succeed through effort (the dynamism). This dimension is correlated with Inglehart and Norris's (2003) Traditional values. Societal Cynicism refers to a mistrust of human nature and social institutions, and is correlated with Inglehart and Norris's Survival values.
Smith, Dugan, and Trompenaars (1996) proposed two dimensions of organizational attitudes. Countries whose members score high on Egalitarian Commitment believe in justice and in impartial organizational policies, whereas those whose members score low favor more nepotistic practices. Countries whose members score high on Utilitarian Involvement are committed to their job only insofar as it serves them; they lack lifetime loyalty to the organization. Data were provided by P. Smith (personal communication, May 26, 2004).
For all these variables, the data collected refer to the attitudes, beliefs, and values of the individual respondents themselves, and are then aggregated to represent the level of the culture. They thus differ fundamentally from the NCS, where characteristics of a perceived typical member of the culture are elicited. In addition, the dimensions used in the present analyses were all defined by ecological analysis (Hofstede, 2001), that is, by factoring or scaling aggregate data at the culture level. For example, Bond et al.'s (2004) social axiom dimensions were identified by factoring the mean values in 41 cultures for 60 items. (Such culture-level analyses generally yield factors that are similar to individual-level analyses of the same variables; see McCrae & Terracciano, in press.)
Subjective well-being (SWB) is neither a value nor a belief, but it is a condition that might affect the way culture members view their compatriots, and national levels of SWB have been tabulated by Diener, Diener, and Diener (1995). These variables have previously been related in meaningful ways to assessed personality traits at the culture level (McCrae et al., 2005b). Here we explore their unique contribution to national character stereotypes.
Method
Culture-level NCS scores described in Study 2 were correlated with culture-level variables available from the literature. In most cases, there was a direct correspondence between cultures in the present study and those characterized in the literature. However, because we considered some subcultures, and because national boundaries have changed in recent years, some decision rules were required. When data specific to Northern Ireland were not available, Northern Ireland was matched to Great Britain or United Kingdom. Germany was matched with West Germany. NCS data from the Czech Republic and Slovakia were paired with earlier data from Czechoslovakia. NCS data from Croatia, Slovenia, and Serbia were paired with data from Yugoslavia. Earlier data from the Soviet Union were paired with NCS data from Russia, but not with NCS data from Estonia. For Hofstede's (2001) dimensions, NCS data from Nigeria and Burkina Faso were paired with West Africa; data from Ethiopia, Uganda, and Botswana with East Africa; and data from Kuwait and Lebanon with Arab countries.
As cross-cultural researchers are well aware, culture-level variables are often highly correlated with GPD. In the present study, the largest correlation was with Conservatism (r = −.79). Mean temperature was also strongly related to these variables, the largest correlation being with Dynamic Externality (r = .70). Because temperature is more likely to be the cause than the effect of attitudes, beliefs, and values, we choose to control for temperature effects as well as GDP in examining the possible incremental roles of beliefs and values in determining national character stereotypes.
Results and Discussion
Partial correlations of the five NCS domains with beliefs and values controlling for both GDP and mean annual temperature are reported in Table 2. We also examined facet-level correlations; of the 19 × 30 = 570 partial correlations, 45 (7.9%) were significant at p < .05, modestly more than chance. Most of the significant facet-level findings paralleled the domain-level results reported in Table 2.
Table 2. Culture-Level Correlates of NCS Domains.
| Domain.GDP, temp | |||||
|---|---|---|---|---|---|
| Criterion | NNCS | ENCS | ONCS | ANCS | CNCS |
| Hofstede (2001) Dimensions (N = 47) | |||||
| Power Distance | .13 | −.03 | .03 | .15 | −.08 |
| Uncertainty Avoidance | .37* | .15 | −.05 | −.11 | −.38** |
| Individualism | −.20 | .30* | .32* | −.06 | .02 |
| Masculinity | .18 | −.06 | −.10 | −.03 | −.05 |
| Long–Term Orientation (N = 30) | .10 | −.43* | −.40* | −.03 | .11 |
| Schwartz (1994) Value Types (N = 40)a | |||||
| Conservatism | .23 | −.13 | .13 | −.05 | .01 |
| Affective Autonomy | −.26 | .11 | .04 | .18 | .07 |
| Intellectual Autonomy | .12 | −.28 | −.36* | .03 | −.02 |
| Hierarchy | −.09 | −.02 | −.07 | .02 | .09 |
| Mastery | −.20 | .22 | .02 | .10 | −.05 |
| Egalitarian Commitment | −.13 | .26 | .16 | −.01 | −.10 |
| Harmony | .03 | −.13 | −.09 | .07 | .05 |
| Inglehart & Norris (2003) Value Dimensions (N = 43) | |||||
| Traditional vs. Secular/Rational | .04 | −.41** | −.22 | .05 | .38* |
| Survival vs. Self–Expression | −.26 | .31* | .23 | .12 | −.05 |
| Social Axioms (N = 28; Bond et al., 2004) | |||||
| Dynamic Externality | .05 | −.15 | .03 | .25 | .01 |
| Societal Cynicism | .20 | −.29 | −.20 | −.18 | .50* |
| Organizational Attitudes (N = 33; Smith et al., 1996) | |||||
| Conservatism vs. Egalitarian Commitment | −.28 | .27 | .30 | .12 | .20 |
| Loyal Involvement vs. Utilitarian Involvement | −.10 | .10 | −.04 | .23 | −.07 |
| Subjective Well–Being (N = 35; Diener et al., 1995) | −.36* | .22 | .18 | .16 | .06 |
Note. Entries are second-order partial correlations controlling for GDP per capita and mean annual temperature.
Data from the Social Sciences Data Center (ISDC) at the Hebrew University.
p < .05.
p < .01.
Cultures high in Uncertainly Avoidance and low in Subjective Well-Being see their typical member as high in NNCS, particularly Anxiety. Because Uncertainly Avoidance is usually interpreted as a defensive reliance on strict rules and routines found in anxious cultures (Hofstede, 2001), these data seem to suggest some accuracy for the stereotype: People living in defensive cultures among unhappy people believe their typical compatriot is emotionally unstable. However, although Uncertainty Avoidance and low Subjective Well-Being are related to both assessed N (McCrae, 2001) and to NNCS (Table 2), NNCS itself is unrelated to N (r = −.07, n.s.; Terracciano et al., 2005).
ENCS and its Assertiveness and Excitement Seeking facets were positively related to Individualism and Survival vs. Self-Expression values and negatively related to Long-term Orientation and Traditional vs. Secular-Rational values. Thus, cultures (such as the United States) whose members are highly individualistic, emphasize such values as tolerance, trust, and political activism, do not place high value on persistence, thrift, and modesty, but do respect traditional religion, assume their national character is characterized by liveliness and social dominance.
Like ENCS, ONCS is related to Individualism and low Long-Term Orientation; curiously, it is negatively related to Intellectual Autonomy values. That is, citizens of cultures like Germany, who value curiosity and creativity (and score high on O), describe their typical member as being conventional and narrow-minded.
ANCS is unrelated to any of the variables in Table 2, but CNCS and its Order and Deliberation facets were inversely related to Hofstede's Uncertainty Avoidance and directly related to Traditional vs. Secular-Rational values and Societal Cynicism. Cultures like those of Scandinavia, whose members are emotionally stable and politically progressive (though personally cynical), attribute high Conscientiousness to their fellow citizens, even after controlling for national wealth.
In contrast to the clear-cut effects of temperature and GDP, the effects of collective beliefs and values on perceptions of national character seem muddled. Results are scattered and lack compelling interpretations. National character stereotypes do not reflect societal beliefs and values in any straightforward way.
General Discussion
In this article we sought to identify determinants of national character stereotypes. We found strong support for the hypotheses that climatic warmth and national prosperity lead to attributions of interpersonal warmth and passion, and businesslike competence, respectively. Findings held for regional stereotypes within Italy and for national stereotypes in a sample of 49 cultures. Culture-level variables, such as aggregate beliefs and values, that are meaningfully associated with aggregate personality traits showed modest and sometimes puzzling associations with national character stereotypes. In future research, it might be more profitable to examine social structural variables (i.e., political, legal, and economic systems) as possible determinants of national character stereotypes.
These findings reinforce the conclusion that national stereotypes do not reflect actual differences in the mean level of personality traits (Terracciano et al., 2005). The kernel-of-truth hypothesis implies that stereotypes are accurate, although grossly exaggerated. The present results suggest that the chief determinants of shared stereotypes are metaphorical reasoning with regard to warmth and something akin to the fundamental attribution error—assuming that the causes of national wealth are to be found in the character of the people—with respect to competence. Perceptions can be changed dramatically merely by reframing the comparison: Italians are thought to be passionate and inefficient—unless they are identified as Northern Italians.
One striking finding was the strong correlation between climatic warmth and stereotypes of interpersonal warmth. Judging from our informal survey, people around the world use the same words to describe degrees of heat and characteristics of temperament. Panksepp (1995) argued that this association can be traced to the pairing of physical warmth with emotional closeness in the mother and infant. Whatever its origin, the metaphor appears to be interpreted literally: Other things being equal, people from physically warm environments are presumed to be friendly. Similar (and equally unfounded) metaphors of color (e.g., “white” is “clean”) probably contribute to racial stereotypes.
In addition to systematic influences such as temperature and wealth, the jumbled map in Figure 1, which shows proximity between the stereotypes of Hong Kong Chinese and Hungarians, Canadians and Burkinabé, and Peruvians and Moroccans, suggests that national stereotypes must often have highly idiosyncratic sources. It seems likely that Germans' view of themselves as low in Openness to Experience (see Appendix) is based in part on their history of Nazism. Perhaps Canadians' self-assessment as the agreeable mirror image of Americans (Terracciano et al., 2005) is motivated by a need to assert an independent identity from their politically and economically dominant neighbor—a need that trumps the usual assumptions about personality and climate.
The symbolic interactionist view that people's understanding of themselves is a reflection of others' appraisals (Mead, 1934) has not fared well as an account of the origins of self-perceptions of personality traits (Shrauger & Schoeneman, 1979), but national stereotypes may be more susceptible to such feedback. Southern Italians may believe they are low in C in part because they have internalized the judgment of Northern Italians. Similarly, Americans may perceive themselves as arrogant because they have so often been described that way by others. Because national stereotypes are not grounded in the reality of actual personality traits which might serve as a corrective, they are subject to a host of influences; at some point the view of a nation stabilizes, and thereafter it is perpetuated by cognitive mechanisms in individuals (Macrae, Stangor, & Hewstone, 1996) and by the institutionalization of ideas at the culture level.
One of the remaining mysteries about national character stereotypes is exactly why they are unfounded. There is evidence (e.g., Madon et al., 1998) that many stereotypes are based in some degree on fact: Older people do have memory problems (Salthouse, 1989), and women are more tender-minded than men (Costa, Terracciano, & McCrae, 2001). The inaccuracy of national character stereotypes may be explained in part by the fact that most people do not have extensive first-hand experience with members of other cultures. Most people interact with men and women on a daily basis, and so can learn about gender differences in personality, but they may never encounter a citizen of Russia or India, and cannot learn directly about their typical personality traits. To the extent that understanding one's own national character depends on contrasts with other groups, that lack of information could also impair the accuracy of in-group stereotypes.
A study by Church and Katigbak (2002), however, suggests limits to this straightforward account. They obtained ratings of Americans and Filipinos from American and Filipino judges who had lived at least three years in each country. The two sets of expert and experienced judges agreed well with each other—but their judgments were unrelated to assessed personality traits in the two nations. If aggregate personality assessments are reasonably accurate, one must conclude that the firsthand experience of such individuals is disregarded in favor of the collective wisdom of the majority who lack any experience at all. Social psychologists need to take up the challenge of determining what categories of stereotypes are inaccurate, and why. Personality psychologists may be able to contribute by identifying characteristics associated with accurate judgments of national character. Perhaps judges high in O can benefit from experience and make more accurate judgments.
Acknowledgments
This research was supported in part by the Intramural Research Program, NIH, National Institute on Aging. We thank the members of the Personality Profiles of Cultures Project for collecting the data reported here. NEO-PI-R profile form reproduced by special permission of the Publisher, Psychological Assessment Resources, Inc., 16204 North Florida Avenue, Lutz, Florida 33549, from the Revised NEO Personality Inventory by Paul T. Costa, Jr., and Robert R. McCrae.
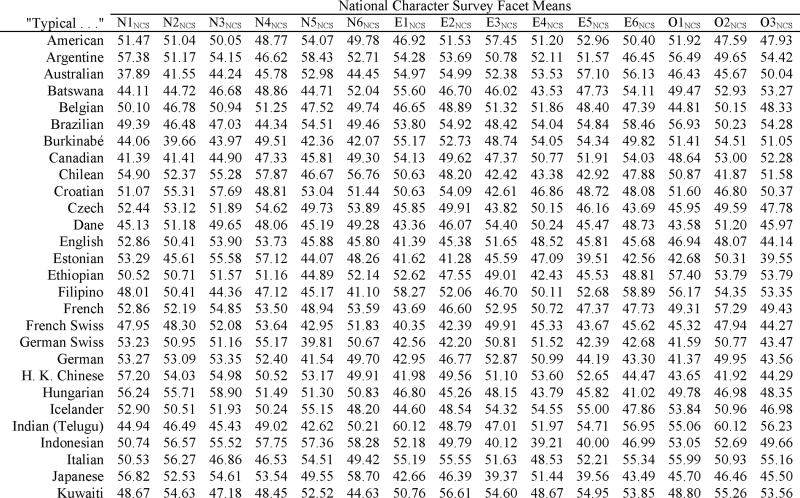
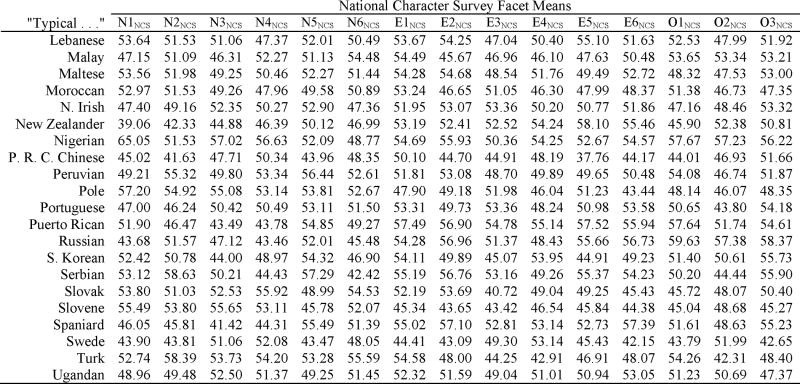
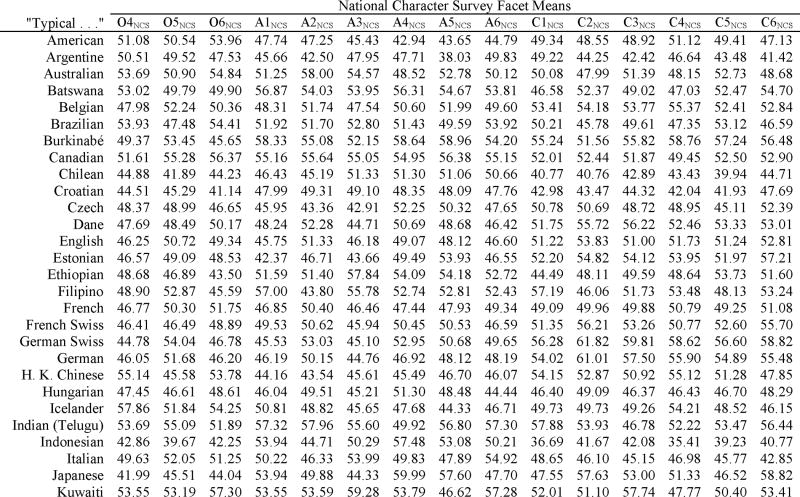
Appendix: Standardized Facet Means for 49 Cultures
 |
 |
|
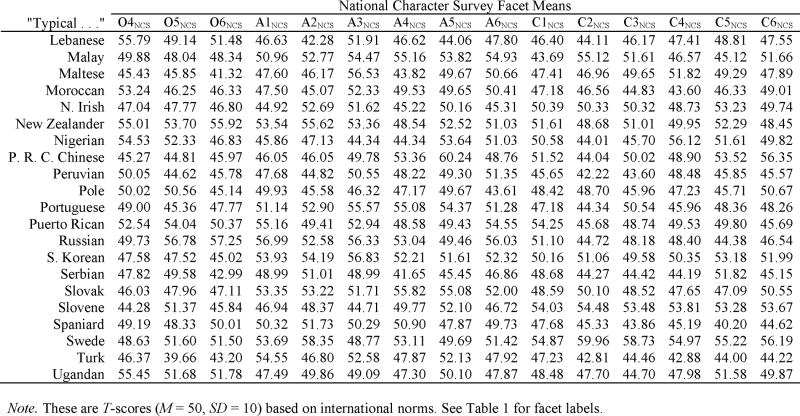 |
Note. These are T-scores (M = 50, SD = 10) based on international norms. See Table 1 for facet labels.
Footnotes
Robert R. McCrae receives royalties from the Revised NEO Personality Inventory (NEO-PI-R). Portions of these data were presented at the 113th Annual Convention of the American Psychological Association, August, 2005, Washington, DC, and at the 115th Annual Convention of the American Psychological Association, August, 2007, San Francisco.
Note that in this article we are concerned only with those aspects of stereotypes that refer to character or personality. Our data do not speak to the accuracy or determinants of stereotypes about physical characteristics, educational attainment, abilities, and other features that may be the subject of national or regional stereotypes.
Because the data in Figure 3 were standardized using American norms, a reviewer asked what effect using American norms for the NCS data in Figure 2 would have. Different norms did not alter the fundamental differences between the two regions in stereotypes, and ICCs between assessed traits and stereotypes were −.14 for both Northern and Southern Italians.
Pennebaker et al. (1996) reported a significant (r = .05, p < .01) correlation between place of birth and self-reported emotional expressiveness, supporting the kernel-of-truth hypothesis. However, the measure they used was entitled “The North-South Questionnaire,” and that label may have primed self-stereotyping in enough respondents to account for so small a correlation. Nothing in the materials used for the present study prompted North-South comparisons.
In response to an informal survey, members of the Personality Profiles of Cultures project generally confirmed that the associations of temperature with personality traits familiar to English speakers are also common in other languages (e.g., German, Hungarian, Turkish, Russian, Farsi, Ugandan, Filipino, Chinese). In Amharic, an Ethiopian language, mokat can refer to hot temperature or excitability; in Estonian, külm means cold literally and figuratively; in Bahasa Indonesian hangat means moderately hot or friendly. Of languages surveyed, only Indian Telugu does not seem to use temperature metaphors for temperament traits.
We conducted supplementary analyses operationalizing temperature as the average daily temperature of the hottest month and of the coldest month (World Climate, 2005). These values are highly related to mean annual temperature (rs = .81 and .90, respectively) and yield very similar correlations with national character stereotypes.
The large correlations in Table 1 are attributable chiefly to the fact that national character stereotypes are aggregate scores. When analyses were repeated using individual scores (N = 3,989), all the significant correlations in Table 1 were replicated, and the relative magnitude of correlations was very similar. However, individual-level correlations were consistently smaller than the culture-level correlations in Table 1, the largest being −.28 for GPD with interpersonal Warmth. Considerations of wealth and warmth have relatively subtle influences on individual perceptions of national character, but they are shared by many people and thus have a powerful effect on aggregate judgments.
Our data are correlational, but it is implausible to argue that stereotypes determine either national wealth or temperature, so the causal direction is reasonably clear.
Contributor Information
Robert R. McCrae, Gerontology Research Center, National Institute on Aging, NIH, DHHS
Antonio Terracciano, Gerontology Research Center, National Institute on Aging, NIH, DHHS.
Anu Realo, Department of Psychology, University of Tartu, and Estonian Centre of Behavioural and Health Sciences.
Jüri Allik, Department of Psychology, University of Tartu, and Estonian Centre of Behavioural and Health Sciences.
References
- Allik J, McCrae RR. Toward a geography of personality traits: Patterns of profiles across 36 cultures. Journal of Cross-Cultural Psychology. 2004;35:13–28. [Google Scholar]
- Anderson CA. Temperature and aggression: Ubiquitous effects of heat on occurrence of human violence. Psychological Bulletin. 1989;106:74–96. doi: 10.1037/0033-2909.106.1.74. [DOI] [PubMed] [Google Scholar]
- Ashton MC, Lee K, Perugini M, Szarota P, De Vries RE, Di Blass L, et al. A six-factor structure of personality descriptive adjectives: Solutions from psycholexical studies in seven languages. Journal of Personality and Social Psychology. 2004;86:356–366. doi: 10.1037/0022-3514.86.2.356. [DOI] [PubMed] [Google Scholar]
- Barzini L. The Italians. New York: Touchstone; 1964. [Google Scholar]
- Bonati M, Campi R. What can we do to improve child health in Southern Italy? PLoS Medicine. 2005;2:e250. doi: 10.1371/journal.pmed.0020250. [DOI] [PMC free article] [PubMed] [Google Scholar]
- Bond MH, Leung K, Au A, de Carrasquel SR, Murakami F, Yamaguchi S, et al. Culture-level dimensions of social axioms and their correlates across 41 cultures. Journal of Cross-Cultural Psychology. 2004;35:548–570. [Google Scholar]
- Borkenau P. Implicit personality theory and the Five-Factor Model. Journal of Personality. 1992;60:295–327. doi: 10.1111/j.1467-6494.1992.tb00975.x. [DOI] [PubMed] [Google Scholar]
- Boster JS, Maltseva K. A crystal seen from each of its vertices: European views of European national characters. Cross-Cultural Research. 2006;40:47–64. [Google Scholar]
- Bruner JS, Taguiri R. Person perception. In: Lindzey G, editor. Handbook of social psychology. Vol. 2. Reading, MA: Addison-Wesley; 1954. pp. 634–654. [Google Scholar]
- Central Intelligence Agency. The World Factbook. 2006 January 10; Retrieved February 22, 2006, from http://www.cia.gov/cia/publications/factbook/geos/it.html#Econ.
- Church AT, Katigbak MS. The Five-Factor Model in the Philippines: Investigating trait structure and levels across cultures. In: McCrae RR, Allik J, editors. The Five-Factor Model of personality across cultures. New York: Kluwer Academic/Plenum Publishers; 2002. pp. 129–154. [Google Scholar]
- Cloninger CR, Svrakic DM, Przybeck TR. A psychobiological model of temperament and character. Archives of General Psychiatry. 1993;50:975–990. doi: 10.1001/archpsyc.1993.01820240059008. [DOI] [PubMed] [Google Scholar]
- Costa PT, Jr, McCrae RR. Revised NEO Personality Inventory (NEO-PI-R) and NEO Five-Factor Inventory (NEO-FFI) professional manual. Odessa, FL: Psychological Assessment Resources; 1992. [Google Scholar]
- Costa PT, Jr, Terracciano A, McCrae RR. Gender differences in personality traits across cultures: Robust and surprising findings. Journal of Personality and Social Psychology. 2001;81:322–331. doi: 10.1037/0022-3514.81.2.322. [DOI] [PubMed] [Google Scholar]
- Diener E, Diener M, Diener C. Factors predicting the subjective well-being of nations. Journal of Personality and Social Psychology. 1995;69:851–864. doi: 10.1037//0022-3514.69.5.851. [DOI] [PubMed] [Google Scholar]
- Digman JM. Personality structure: Emergence of the Five-Factor Model. Annual Review of Psychology. 1990;41:417–440. [Google Scholar]
- Du Bois C. The people of Alor. Minneapolis: University of Minnesota Press; 1944. [Google Scholar]
- Eagly A, Steffen VJ. A note on assessing stereotypes. Personality and Social Psychology Bulletin. 1988;14:676–680. [Google Scholar]
- Fiske ST, Cuddy AJC, Glick P, Xu J. A model of (often mixed) stereotype content: Competence and warmth respectively follow from perceived status and competition. Journal of Personality and Social Psychology. 2002;82:878–902. [PubMed] [Google Scholar]
- Heine SJ, Lehman DR, Markus HR, Kitayama S. Is there a universal need for positive self-regard? Psychological Bulletin. 1999;106:766–794. doi: 10.1037/0033-295X.106.4.766. [DOI] [PubMed] [Google Scholar]
- Hofstede G. Culture's consequences: International differences in work-related values. Beverly Hill, CA: Sage; 1980. [Google Scholar]
- Hofstede G. Culture's consequences: Comparing values, behaviors, institutions, and organizations across nations. 2nd. Thousand Oaks, CA: Sage; 2001. [Google Scholar]
- Hofstede G, McCrae RR. Personality and culture revisited: Linking traits and dimensions of culture. Cross-Cultural Research. 2004;38:52–88. [Google Scholar]
- Inglehart R. Modernization and postmodernization: Cultural, economic, and political change in 43 societies. Princeton, NJ: Princeton University Press; 1997. [Google Scholar]
- Inglehart R, Baker WE. Modernization, cultural change, and the persistence of traditional values. American Sociological Review. 2000;65:19–51. [Google Scholar]
- Inglehart R, Norris P. Rising tide: Gender equality and cultural change around the world. New York: Cambridge University Press; 2003. [Google Scholar]
- Inkeles A. National character: A psycho-social perspective. New Brunswick, NJ: Transaction Publishers; 1997. [Google Scholar]
- ISTAT. Reddito e condizioni economiche in Italia. 2006 Retrieved March 20, 2007 from http://www.istat.it/salastampa/comunicati/non_calendario/20061228_02/testointegrale.pdf.
- Judd CM, Park B. Definition and assessment of accuracy in social stereotypes. Psychological Review. 1993;100:109–128. doi: 10.1037/0033-295x.100.1.109. [DOI] [PubMed] [Google Scholar]
- Krueger JI, Wright JC. How to measure national stereotypes? Science. 2006 February;311:776–777. Letter to the Editor. [PubMed] [Google Scholar]
- Linssen H, Hagendoorn L. Social and geographical factors in the explanation of the content of European nationality stereotypes. British Journal of Social Psychology. 1994;33:165–182. [Google Scholar]
- Macrae CN, Stangor C, Hewstone M. Stereotypes and stereotyping. New York: Guilford Press; 1996. [Google Scholar]
- Madon S, Jussim L, Keiper S, Eccles J, Smith A, Palumbo P. The accuracy and power of sex, social class, and ethnic stereotypes: A naturalistic study in person perception. Personality and Social Psychology Bulletin. 1998;24:1304–1318. [Google Scholar]
- McCrae RR. Trait psychology and culture: Exploring intercultural comparisons. Journal of Personality. 2001;69:819–846. doi: 10.1111/1467-6494.696166. [DOI] [PubMed] [Google Scholar]
- McCrae RR. NEO-PI-R data from 36 cultures: Further intercultural comparisons. In: McCrae RR, Allik J, editors. The Five-Factor Model of personality across cultures. New York: Kluwer Academic/Plenum Publishers; 2002. pp. 105–125. [Google Scholar]
- McCrae RR, Jang KL, Livesley WJ, Riemann R, Angleitner A. Sources of structure: Genetic, environmental, and artifactual influences on the covariation of personality traits. Journal of Personality. 2001;69:511–535. doi: 10.1111/1467-6494.694154. [DOI] [PubMed] [Google Scholar]
- McCrae RR, Terracciano A. The Five-Factor Model and its correlates in individuals and cultures. In: Van de Vijver FJR, van Hemert DA, Poortinga YH, editors. Individuals and cultures in multi-level analysis. Mahwah, NJ: Erlbaum; in press. [Google Scholar]
- McCrae RR, Terracciano A, 78 Members of the Personality Profiles of Cultures Project Universal features of personality traits from the observer's perspective: Data from 50 cultures. Journal of Personality and Social Psychology. 2005a;88:547–561. doi: 10.1037/0022-3514.88.3.547. [DOI] [PubMed] [Google Scholar]
- McCrae RR, Terracciano A, 79 Members of the PersonalityProfiles of Cultures Project Personality profiles of cultures: Aggregate personality traits. Journal of Personality and Social Psychology. 2005b;89:407–425. doi: 10.1037/0022-3514.89.3.407. [DOI] [PubMed] [Google Scholar]
- McGrath RE, Goldberg LR. How to measure national stereotypes? Science. 2006 February;311:776–777. doi: 10.1126/science.311.5762.776. Letter to the Editor. [DOI] [PubMed] [Google Scholar]
- Mead GH. Mind, self and society. Chicago: University of Chicago Press; 1934. [Google Scholar]
- Montesquieu CdS. The spirit of the laws. Cambridge: Cambridge University Press; 1989. Original work published 1748. [Google Scholar]
- Panksepp J. The emotional sources of “chills” induced by music. Music Perception. 1995;13:171–207. [Google Scholar]
- Parker PM. Climatic effects on individual, social, and economic behavior: A physioeconomic review of research across disciplines. Westport, CT: Greenwood Press; 1995. [Google Scholar]
- Peabody D. National characteristics. New York: Cambridge University Press; 1985. [Google Scholar]
- Pennebaker JW, Rime B, Blankenship VE. Stereotypes of emotional expressiveness of Northerners and Southerners: A cross-cultural test of Montesquieu's hypotheses. Journal of Personality and Social Psychology. 1996;70:372–380. doi: 10.1037//0022-3514.70.2.372. [DOI] [PubMed] [Google Scholar]
- Phalet K, Poppe E. Competence and morality dimensions of national and ethnic stereotypes: A study in six eastern-European countries. European Journal of Social Psychology. 1997;27:703–723. [Google Scholar]
- Pinker S. The blank slate: The modern denial of human nature. New York: Penguin Books; 2002. [Google Scholar]
- Poppe E. Effects of change in GNP and perceived group characteristics on national and ethnic stereotypes in central and Eastern Europe. Journal of Applied Social Psychology. 2001;31:1689–1708. [Google Scholar]
- Poppe E, Linssen H. In-group favoritism and the reflection of realistic dimensions of difference between national states in Central and Eastern European nationality stereotypes. British Journal of Social Psychology. 1999;38:85–102. [Google Scholar]
- Roccas S, Sagiv L, Schwartz SH, Knafo A. The Big Five personality factors and personal values. Personality and Social Psychology Bulletin. 2002;28:789–801. [Google Scholar]
- Rokeach M. The nature of human values. New York: Free Press; 1973. [Google Scholar]
- Ross L. The intuitive psychologist and his shortcomings: Distortions in the attribution process. In: Berkowitz L, editor. Advances in experimental social psychology. Vol. 10. New York: Academic Press; 1977. pp. 173–220. [Google Scholar]
- Salthouse TA. Age-related changes in basic cognitive processes. In: Storandt M, VandenBos GR, editors. The adult years: Continuity and change. Washington, DC: American Psychological Association; 1989. pp. 9–40. [Google Scholar]
- Schwartz DC. On the ecology of political violence: “The long hot summer” as a hypothesis. American Behavioral Scientist. 1968;11(6):24–28. [Google Scholar]
- Schwartz SH. Beyond individualism/collectivism: New cultural dimensions of values. In: Kim U, Triandis HC, Kagitcibasi C, Choi SC, Yoon G, editors. Individualism and collectivism: Theory, method, and applications. Thousand Oaks, CA: Sage; 1994. pp. 85–119. [Google Scholar]
- Shrauger JS, Schoeneman TJ. Symbolic interactionist view of self-concept: Through the looking glass darkly. Psychological Bulletin. 1979;86:549–573. [Google Scholar]
- Smith PB, Dugan S, Trompenaars F. National culture and values of organizational employees. Journal of Cross-Cultural Psychology. 1996;27:231–264. [Google Scholar]
- Stangor C, Lange JE. Mental representations of social groups: Advances in conceptualizing stereotypes and stereotyping. Advances in Experimental Social Psychology. 1994;26:357–416. [Google Scholar]
- Terracciano A. The Italian version of the NEO-PI-R: Conceptual and empirical support for the use of targeted rotation. Personality and Individual Differences. 2003;35:1859–1872. doi: 10.1016/S0191-8869(03)00035-7. [DOI] [PMC free article] [PubMed] [Google Scholar]
- Terracciano A, Abdel-Khalak AM, Ádám N, Adamovová L, Ahn Ck, Ahn Hn, et al. National character does not reflect mean personality trait levels in 49 cultures. Science. 2005;310:96–100. doi: 10.1126/science.1117199. [DOI] [PMC free article] [PubMed] [Google Scholar]
- Terracciano A, McCrae RR. How to measure national stereotypes? Response. Science. 2006;311:777–779. [Google Scholar]
- Terracciano A, McCrae RR. Perceptions of Americans and the Iraq invasion: Implications for understanding national character stereotypes. Journal of Cross-Cultural Psychology. doi: 10.1177/0022022107308586. in press. [DOI] [PMC free article] [PubMed] [Google Scholar]
- Van De Vliert E, Schwartz SH, Huismans SE, Hofstede G, Daan S. Temperature, cultural masculinity, and domestic political violence: A cross-national study. Journal of Cross-Cultural Psychology. 1999;30:291–314. [Google Scholar]
- World Climate. World climate. 2005 January 5; Retrieved February 22, 2006 from http://www.worldclimate.com.
- World Factbook. GPD—per capita. 2003 Retrieved May 8, 2006 from http://www.bartleby.com/151/fields/64.html.