

Abstract
For sensors detecting immobilized biomarkers, the interface between the surface and the fluid medium plays an important role in determining the levels of signal and noise in the electrochemical detection process. When protein is directly immobilized on the metal electrode, denaturation of the protein by surface-protein interaction results in low activity and low signal level. The conducting polymer based interface can prevent the protein conformation change and alleviate this problem. We introduce the DNA-dendrimer into the interfacial film on the sensor surface to further improve the sensor performance. DNA-dendrimer is a nano-scale dendrite constructed of short DNA sequences, which can be easily incorporated into the abiotic conducting polymer matrix and is biocompatible to most bio-species.
In this work, DNA-dendrimer and polypyrrole (DDPpy) form the bio-abiotic interface on electrochemical sensors. Detections of two salivary protein markers (IL-8 and IL-1β) and one mRNA salivary marker (IL-8) were used to demonstrate the efficiency of the DDPpy sensor. The limit of detection (LOD) of protein has achieved 100-200 fg/ml, which are three orders of magnitude better than that without the DNA-dendrimer interface. An LOD of 10 aM was established for IL-8 mRNA. The typical sample volume used in the detection is 4 μl, thus the LOD reaches only 25 target molecules (40 yocto mole).
Keywords: Conducting polymer, nanoscale dendrimer, bio-abiotic interface, bio-molecular sensor, salivary biomarker
1. Introduction
The signal transduction from the biological world to physical domain, or vice versa, is a common and challenging task. For example, if in vivo neural signals can be successfully read out through array of probes, we can obtain much better understanding of neural networks’ function.[1,2] Additionally, if proper multiple control signals can be fed into neural networks, muscle motion control of disabled patient will be only one of many exciting applications.[1,3] The signal transduction efficiency between the biological world and engineering devices critically depends on the bio-abiotic interface. In this work, we introduce nano-scale DNA-dendrimer embedded conducting polymer interface, which can significantly improve sensitivity of biomarker sensors by orders of magnitude.
Various methods have been reported to construct the interface for facilitating signal transductions. Functional biomolecules can be immobilized onto self-assembled monolayers (SAMs) on silicon, gold or polymer through direct chemical bonding[4-7] or indirect binding of biopolymers such as streptavidin [8,9] and protein G [10,11]. Thin film of biopolymer is commonly used to increase the affinity and stability of immobilized biomolecules[12,13].
Among these materials, conducting polymer (CP) is extensively applied as an easy-fabricating and biocompatible supporting material for a diverse array of analytes.[14-19] Currently, most of the existing CP based biosensors incorporate bio-molecular probes, such as a oligonucleotide, antibody and enzyme, directly into polymer film by mixing them with monomer solution immediately before the electro-polymerization.[20-22] In some cases, adding anionic surfactant would help to increase the immobilization efficiency. In this way, biomolecules will not suffer from denaturation of chemical bonding and can be immobilized through a single step fabrication procedure.
We will demonstrate that the combination of abiotic polymer substrate and bio-dopant will generate a biocompatible and widely applicable interface for detectors with multiple applications. Since conducting polymer and bio-nano dopant particles intrinsically share similar porous structures and surface charge properties, they are compatible and beneficial for signal transduction between bio and abiotic materials. Polypyrrole (Ppy) was chosen as the abiotic conductive polymer material because it is a commonly used polymer and can be very easily fabricated through electro-polymerization. DNA-dendrimer, which is commercially available, has the advantage of excellent stability and is negative charged, and was therefore chosen as the bio-nano dopant. DNA-dendrimer is a dendrite constructed by short DNA sequences. [23,24] The basic unit of DNA-dendrimer is DNA monomer with two DNA stands sharing part of the sequence which forms stable double strand, and the remaining portion being free for further hybridization or modification. Integration of identical or different forms of DNA monomers forms a dendrite structure. Due to the unique property of being heavily negatively charged, the incorporation of a DNA-dendrimer into conducting polymer is effective. Furthermore, these DNA-dendrimers can be customized to accommodate binding sites for small molecules, such as biotin and fluorescein. Multiple binding sites, 5-1000 on each dendrimer particle, are expected to significantly increase the density of immobilized biomolecules. The properties of such interface were tested by DNA-dendrimer-linked DNA and antibody through the bio-sensing applications.
Results
Surface patterning of DDPpy by electro-polymerization
When electrochemical bio-sensor [25-27] is used, the target molecules need to be immobilized specifically on the working electrode (WE) but not on the counter electrode (CE) or the reference electrode (RE). Most commonly, lithographic process needs to be applied to pattern the capture probes onto WE. For the DDPpy based sensor platform, target molecules can be patterned on the WE by a simple electrical polymerization process without multiple steps of blocking and lithographic processes. The formation of DNA-dendrimer Ppy (DDPpy) is illustrated in Figure 1(a). The DNA-dendrimer was pre-labeled with streptavidin and then mixed with non-labeled pyrrole monomer. By applying voltage across the WE and CE, the DNA-dendrimer guided polypyrrole can be polymerized only on WE and not elsewhere within 5 minutes. The process was carried out in a typical laboratory environment without the requirement of a clean-room and laborious lithographic processes. The thickness of the DDPpy film is measured to be ca. 51.5 ± 3.0 nm by profilemeter. Details of characterization are available in the supporting information.
Figure 1.

Schematic process of (a) DDPpy formation and (b) the application in DDPpy directed multiplexing immobilization of biomolecules.
DDPpy is electro-polymerized on WE of a 16-array chip with a designed spiral structure (Fig. 2(a-b)). This simple patterning process of DDPpy on WE can be visualized by using fluorescence imaging. The DDPpy sensor chip is incubated with atto-488 labeled biotin. The bright-field image of the DDPpy electrode is shown in Figure 2(c) and the fluorescence image is shown in Figure 2(d). The WE shows 10 times higher fluorescent signal on average than those of the CE and glass substrate. Based on the high contrast and the sharp edge of the fluorescent images, direct polymerization patterns DDPpy on WE and the activity of the streptavidin is well maintained.
Figure 2.

Patterning of DDPpy via electrical field. (a) 16-array electrochemical chip and (b) the 3-electrodes configuration. The size of total 16-array chip is 2.5 cm × 7.5 cm. Bright field image (c) and fluorescence image (d) of the DDPpy working electrode (WE) and bare gold counter electrode (CE) after being incubated with biotinylated atto-488 are also illustrated.
By placing droplets with either biotinylated anti-body or nucleic acid probes on the islands, array of sensors can be fabricated for detecting a variety of different targeted molecules (Fig. 1(b)).
Controlling the dendrimer surface density in DDPpy
Surface morphology and coverage of the binding sites are critical factors for determine the performance of surface immobilized molecular sensor. Sparsely distributed molecules result in a low number of binding targets. While very crowded surfaces would restrict the recognition process because of the limited free space [28] and generate low surface binding efficiency [29-32]. Surface density of binding sites is directly proportional to the concentration of DNA-dendrimer in the polypyrrole matrix. We can effectively control of the numbers and the distribution by appropriately applying the time duration for electrical polymerization of DNA-dendrimer. A series of experiments on different polymerization time have been performed and the data are summarized in Table 1. SEM (Hitachi S4700 SEM, Japan) was used to characterize surface morphology and coverage of DDPpy. For short polymerization time of DDPpy (Fig 3-a, b), dendrimer particles have low surface occupancy and in random orientations. As the polymerization time increases (Fig.3-c, d), surface coverage increase monotonically. The surface density of the exposed dendrimer can be controlled by varying the duration of electro-polymerization. At high magnification (Fig 3-e), the picture shows that dendrimer particles tend to adopt an upright orientation. Since the electro potential is perpendicular at the surface, the negative charged DNA-dendrimer aligns its orientation. [28,33-36] The average particle size is calculated to be 60~80 nm, which is very close to the value provided by the dendrimer manufacturer. Assuming that a monolayer of DNA-dendrimer is exposed on Ppy surface (Fig. 3-f), the surface density of dendrimer is ca. 1.2 pmol/cm2 after 500s of square-wave electrical polymerization.
Table 1.
Parameters measured by surface characterization of DDPpy electrode.
| Polymerization time (s) |
Particle diameter (nm) | Surface coverage (%) |
Surface concentration (pmol/cm2)[a] |
|---|---|---|---|
| 50 | 40 | 0.5 | 0.02 |
| 150 | 62 | 5.5 | 0.24 |
| 300 | 78 | 8.5 | 0.35 |
| 500 | 70 | 35.2 | 1.21 |
The surface concentration is calculated by the surface coverage percentage and the average particle size under the assumption of monolayer for DDPpy film. This assumption is supported by the 50 nm film thickness (see supporting material for detail).
Figure 3.
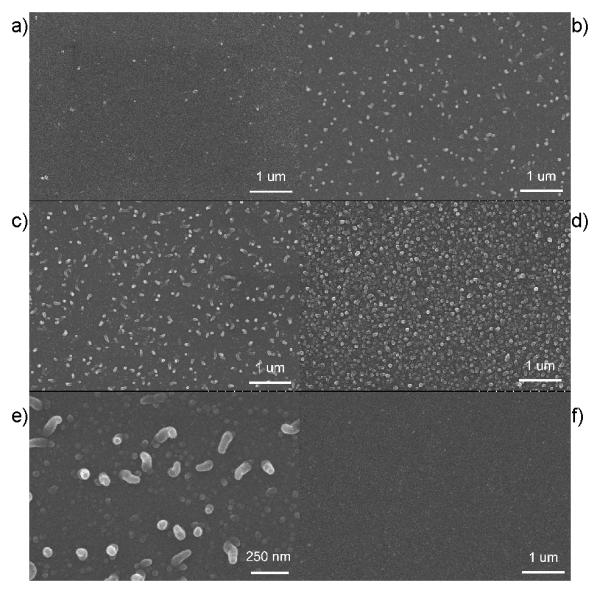
SEM images of DDPpy surface and Ppy-only surface. (a-d): DDPpy after being polymerized for 50s, 150s, 300s, 500s with 20 k magnification. (e): DDPpy after being polymerized for 300s with 70k magnification. (f): Ppy after being polymerized for 500s with 20k magnification. Scale bars are illustrated for each image.
Applications for bio-molecular sensing
Amperometric detection combined with sandwich immunoassay is a robust method to detect low concentration of analytes (20). Here we use dendrimer that is embedded in conducting polymer to establish an interface for facilitating the transduction from bio-chemical reactions to electronic output signal.
In order to demonstrate the efficiency of the bio-abiotic interface, a combination of salivary biomarkers, IL-8 RNA, IL-8 protein and IL-1β protein were used in the buffer. These three markers have been proven to be able to specifically detect oral cancer. [37] The levels of these 3 biomarkers in oral cancer patients are significantly higher than those in healthy people and can therefore be used as reference to screen the oral cancer patient. As reported, the average concentrations of IL-8 and IL-1β proteins in patients are about several thousand pg/ml while less than several hundred pg/ml in healthy subjects. [38] However, for each individual, the level of protein marker may vary from pg/ml to ng/ml for both cancer patients and control group. Thus, the salivary protein sensors will be needed to provide quantitative response in the wide range of pg/ml to ng/ml, and high sensitivity with LOD of sub pg/ml. For IL-8 mRNA, the average level in cancer patients is about 16 fM and 2 fM for healthy people. Again, for each individual, the level in clinical sample ranges from aM to several pM. Requirement for dynamic range is from aM to pM and the LOD would therefore be in sub fM range.
The first experiment illustrates the necessity of conducting polymer. On gold electrode, proteins will experience denaturing problems. The interfacial polymer film can prevent this conformational change in the proteins. Due to low efficiency to encapsulate the neutral protein into conducting polymer, the sensor without the interfacial polymer has a higher signal level than that of Ppy-only sensor (Fig. 4). However, the background noise of the bare sensor is high and indicates denatured protein on the gold surface. The LOD of Ppy sensor is in the low ng/ml range, while the bare sensor is only in the low μg/ml range. These results indicate that the conducting polymer is an effective interface material for maintaining the activity of the proteins on sensor surface.
Figure 4.

Signal comparison of (a) electrochemical current data and (b) signal-to-background-ratio from amperometric IL-8 protein assays by applying (1) DDPpy sensor, (2) Ppy-only sensor and (3) direct covalent bind without polymer.
To demonstrate the improved interfacial property by adding dendrimer to Ppy, comparative immunoassays between Ppy-only and DDPpy were carried out in parallel. In the controlling experiments, Ppy-only film, biotinylated Mab was directly doped into polymer film by using the same parameters as the DDPpy formation. As the results show in Figure 4, DDPpy immunosensors exhibit much higher output signals than the Ppy sensor under the same target concentration. At 2.5 μg/ml of IL-8 target protein, DDPpy sensors generate about 15 times higher current (−2660 nA) than that of the no-dendrimer controlled case (−176 nA). In addition, the signal of blank control on DDPpy is −17 nA, which is much lower than −55 nA of Ppy sensor, indicating that DDPpy also resists non-specific protein adsorption. In terms of signal-to-background ratio (SBR), DDPpy sensors achieved a SBR as high as 38 with the IL-8 concentration of 25 ng/ml, while Ppy sensor only produced a SBR of 1.4 (Fig. 4(b)).
Moreover, repeatability of these two surfaces is also different. Regarding the signal error level, on average, DDPpy immunosensors result in the signal variation of 1~2 nA in the same batch and 3~4 nA between batches. Variations for Ppy sensors are noticeably larger, 3~4 nA, within the batch and >20nA between batches. These results suggest that the dendrimer, the bio-abiotic interface, in DDPpy immunosensor has played significant role in enhancing the sensitivity and repeatability.
Figure 5(a)-(b) illustrates the linear concentration profile for detection of IL-8 and IL-1β protein in low concentration range. LOD is about 200 fg/ml for IL-8 protein and 100 fg/ml for IL-1β protein, which are about three orders of magnitude better than that of Ppy-alone sensor. For concentration range covers from 0 to 25 ng/ml, Langmuir isotherm profiles were observed (inserts of Fig. 5(a)-(b)). The amperometric response (I) has the following relationship with concentration: . K is the binding constant which relates to the surface binding equilibrium. Regarding the multiple layer based surface recognition process, there may exist complex Langmuir curve at high concentration range, especially for protein surface. In our experiment, multiple layers follow the Langmuir equation or more complex surface model has been observed. Here we only look the single Langmuir isotherm before the first monolayer saturation (less than 25 ng/ml for IL-8 and IL-1β protein). According to the single Langmuir isotherm, the fitting results are listed as the following:
For IL-8 protein, K =1.0±0.2×10⁻⁵ (fg/ml)−1 (9.5±1.1×10¹⁰ M−1,MW=8kD) ;
for IL-1β protein, K = 4.2 ± 0.9 ×10⁻⁶ (fg/ml)−1 ( 7.5 ±1.5×10¹⁰ M−1 ,MW = 17.4 kD)
The binding constant K from the curve fitting is close to the 1/kd between monoclonal antibody and antigen in solution, which indicates that the DDPpy film maintains the bioactivity of the protein on surface by constructing the bio-abiotic interface.
Figure 5.

Concentration profile by plotting amperometric current intensities with correspondent (a) IL-8 protein (R2=0.99 for low concentration), (b) IL-1β protein (R2=0.99 for low concentration) and (c) IL-8 RNA (R2=0.98) concentration with the linear fitting results. The sensor response from 0 to 25 ng of IL-8 and IL-1β protein are listed in the inlets fitted with Langmuir isotherm.
In addition to proteins, other molecular probes, e.g. oligonucleotide, can be immobilized efficiently via specific conjugation with DDPpy. Using hairpin DNA probe to provide the hybridization selectivity, IL-8 mRNA (NM_000584), another salivary biomarker for oral cancer, was detected by the DDPpy sensor. The signal amplification was achieved by applying HRP and TMB/H2O2. By immobilizing the hairpin probe on the DDPpy surface, the steric hindrance effect inhibits the HRP conjugate binding to target-free probe[39], resulting in very low background signal. Therefore, the distance between the surface and reporter label of the probe will be a major factor to the detection process. [40,41] Upon target binding, the reporter is removed from the surface into the solution. Therefore the restriction by the surface is diminished. Conjugated HRP binds to the fluorescein and the current signal output will then increase above background. By applying the concept of hairpin probes to DDPpy platform and determining the optimal separation distance between the probe and the surface, we developed a DDPpy based electrochemical detection of RNA with large dynamic range from 10 aM to 10 pM, shown in Figure 5(c). Most significantly, the limit of detection (LOD) of the RNA is about 10 aM with 4 μl of sample (about 40 ymol or 25 copies) in buffer system. The current LOD of conducting polymer sensor is about 5 fM for short DNA/RNA fragment[42,43] even by abiotic nanoparticles without this bio-abiotic interface.
The above results demonstrate the ability of DDPpy sensor for high sensitivity and wide dynamic range. Furthermore, the dynamic range of the DDPpy sensor could be adjusted by changing the recognition surface. In the application for ultra sensitive detection, small amount of primary/secondary antibody and long time passive incubation are applied. In order to move the dynamic range to high concentration, increased amount of primary/secondary antibody and short time active incubation under electrical field were applied. With the modified protocol, the linear range covers from pg/ml to several hundred ng/ml (data not shown).
Discussion
From the comparison between sensors with pyrrole only or with DNA-dendrimer bridged pyrrole interface, DDPpy film exhibits much better bio-affinity and higher specificity of detecting immobilized proteins. The LOD of current bio-abiotic interfaced DDPpy sensor is better than LOD of the sensors with interfaces of abiotic nanoparticles and abiotic polymer.[19,43] These results indicate that the bio-abiotic interface greatly improved the signal transduction process.
In addition, the bio-abiotic interface provides wide possibilities for a flexibly designed sensor. The interfacial film embedded with DNA-dendrimer has multiple binding sites that can be labeled with multiple types of probes. In this work, biotinylated protein and RNA were served as the targeting molecules, thus streptavidin labeled DNA-dendrimer was selected. Since the basic unit of DNA-dendrimer is oligonucleotides, tags other than streptavidin can be conjugated with the DNA-dendrimer. The labeling for bio-molecule target is therefore not limited to biotin. Additionally, one DNA-dendrimer could be constructed by many varieties of oligos with different tags. And the DNA-dendrimer composition could be synthesized according to the needs of multiple types of target detections.
For conducting polymer (CP) based sensor, the electrical field assisted polymerization simplifies the surface patterning process not only for abiotic polymer, but also for the bio-nano dopant particles, DNA-dendrimer. If only one type of DNA-dendrimer will be used, the nanoparticles can be mixed with CP and patterned at the same time. If different types of DNA-dendrimer are needed for multiplexing detections, the negatively charged nanoparticles can be patterned at desired sensor sequentially. The time scale for each step is from several seconds to several minutes.
Except for Ppy in this work, CP layer could be made of various kind of conducting polymer, such as poly(3,4-ethylenedioxythiophene) (PEDOT)[44]. The supporting substrate is not limited to be gold, which can be substituted by other conducting or semi-conducting material, such as platinum, ITO and silicon.
Many other detection methods other than electrochemical sensing are applicable for the DDPpy platform. In particular, due to the electrical conductivity of CP, surface binding of specific target will block electron transfer between mediator and CP surface. As the result, the electrochemical impedance will be increased. This change can be used as a label-free detection method.
Conclusion
An ultra-sensitive electrochemical sensor is enabled by the interfacial thin film formed by conducting polymer with embedded nanoscale DNA. This bio-abiotic interface increases the signal level and reduces the denaturation of bio-species. DDPpy also shows excellent controllability of the non-specific binding.
Three salivary bio-markers for oral cancer, IL-8 protein, IL-1β protein and IL-8 mRNA, are used to demonstrate the DDPpy interfaced amperometric sensor. The LOD of salivary protein can reach 100-200 fg/ml, which is 3 orders of magnitude higher than that of Ppy-only surface treatment. For IL-8 mRNA, the LOD is about 10 aM (about 40 ymol) in 4 μl sample volume.
Experimental Section
Surface fabrication of DNA-dendrimer-directed Polypyrrole electrodes
The DNA-dendrimer (Genisphere, USA) with diameter of 70-90 nm has 2-4 streptavidin. For electropolymerization, the dendrimer was diluted with 1×PBS (pH 7.5, Invitrogen, USA) in the volume ratio of 1:200 and with pyrrole (Sigma, USA). The final pyrrole concentration is about 10 mM. The electrodes were immersed in the mixture before electropolymerization. The pattern of chip composed of 16 sets of 3-electrode system were designed and fabricated via photolithography (Figure 2a-b). After the glass substrate was thoroughly cleaned, 5 nm thick of Ti layer and 20 nm of Au were evaporated onto glass sequentially.
Cyclic square-wave form electrical field was used for electro-polymerization. [45] Each cycle of square-wave consists of 9s at the potential of +350 mV and 1s at +950 mV, and totally 20 cycles of square-waves were applied. The whole process lasts for 200s. After the polymerization, the electrode was rinsed with ultra pure water (18.3 MΩ·cm) then dried by pure N2. The effects of DDPpy thicknesses to signal to background level were carefully studied. With the optimized condition, the thickness of polymer film was measured triplet mode by profilemeter (Dektak 6 Surface Profile Measuring System, Veeco) with the value of is 51.5 ± 3.0 nm. Detailed description of thickness and XPS spectra are provided in the supplementary materials.
Immunoassay
For protein detection, biotinylated human IL-8/IL-1β monoclonal antibody (0.01 mg/ml, 4 μl) (Mab) (Pierce, USA) in 1×PBS was loaded onto electrodes to be conjugated with the streptavidin dendrimer. The incubation time was 30 min followed by washing and drying. Human IL-8/IL-1β (4 μl) (Pierce) in different concentrations was loaded onto DDPpy-Mab surface, which was diluted by the standard diluent from the Pierce IL-8/IL-1β ELISA kit. The incubation time was 30 min, followed by washing and drying. Then the secondary HRP conjugated human IL-8/IL-1β Mab (1:100, 4 μl) was added for 30 min in the HRP dilution buffer from the Pierce IL-8 ELISA kit. After washing and drying, 3, 3′, 5, 5′ tetramethylbenzidine substrate (TMB/H2O2, low activity) (Neogen, USA) was loaded and amperometric detection was carried out by applying −200 mV potential to each electrode unit, followed by parallel signal read-out after 60 s equilibration. All the potentials are referred to Au reference electrode. The gold reference electrode has been determined to be +218 mV vs. SCE by measuring cyclic voltammetric curves of 0.1 mM [Fe(CN)6]3-/4-.[26] In all the steps, the solutions were loaded onto the whole area of micro-patterned electrode region including working electrode and counter electrode.
mRNA detection
For RNA detection, after the polymerization of the electrode, 10 nM biotin and FITC dual-labeled hairpin probe (4 μl) (Operon, USA) in 1×Tris-HCl was load onto the electrode to be conjugated with the streptavidin dendrimer. The hairpin sequence is GAG GGT TGC TCA GCC CTC TTC AAA AAC TTC TCC ACA ACC CTC, which is calculated based on MFold.[46,47] The chip was washed and dried after 30 min of incubation. Then in vitro transcript IL-8 RNA (4 μl) in different concentrations was loaded onto the hairpin probe-coated surface. The hybridization buffer is 1×Tris-HCl containing 10 mM MgCl2. Another 30 min of incubation is required, followed by washing and drying. To generate specific signal amplification for hybridized oligo, secondary HRP conjugated with anti-FITC antibody (4 μl) was incubated with electrodes for 30 min. The chip was washed and dried. Lastly, measurements were carried out with the same parameters as in amperometric protein detection.
Supplementary Material
Acknowledgement
This work is supported by the UCLA Collaborative Oral Fluid Diagnostic Research Center NIH / NIDCR (UO1 DE017790), and NSF DMR-0507294 and the Pacific-Southwest Center for Biodefense and Emerging Infectious Diseases Research UC Irvine/NIH NIAID Award (1 U54 AI 065359) 2005-1609.
Footnotes
Supporting Information is available on the WWW under http://www.small-journal.com or from the author.
References
- [1].Velliste M, Perel S, Spalding MC, Whitford AS, B. SA. Nature. 2008 doi: 10.1038/nature06996. doi:10.1038/nature06996. [DOI] [PubMed] [Google Scholar]
- [2].Cui XY, Lee VA, Raphael Y, Wiler JA, Hetke JF, Anderson DJ, Martin DC. Journal of Biomedical Materials Research. 2001;56:261–272. doi: 10.1002/1097-4636(200108)56:2<261::aid-jbm1094>3.0.co;2-i. [DOI] [PubMed] [Google Scholar]
- [3].Nakagawa H, Yamanashi WS, Pitha JV, Arruda M, Wang XZ, Ohtomo K, Beckman KJ, McClelland JH, Lazzara R, Jackman WM. Circulation. 1995;91:2264–2273. doi: 10.1161/01.cir.91.8.2264. [DOI] [PubMed] [Google Scholar]
- [4].Gu F, Zhang L, Teply BA, Mann N, Wang A, Radovic-Moreno AF, Langer R, Farokhzad OC. Proceedings of the National Academy of Sciences of the United States of America. 2008;105:2586–2591. doi: 10.1073/pnas.0711714105. [DOI] [PMC free article] [PubMed] [Google Scholar]
- [5].Sieval AB, Demirel AL, Nissink JWM, Linford MR, van der Maas JH, de Jeu WH, Zuilhof H, Sudholter EJR. Langmuir. 1998;14:1759–1768. [Google Scholar]
- [6].Linford MR, Fenter P, Eisenberger PM, Chidsey CED. Journal of the American Chemical Society. 1995;117:3145–3155. [Google Scholar]
- [7].Bertilsson L, Liedberg B. Langmuir. 1993;9:141–149. [Google Scholar]
- [8].Lahiri J, Ostuni E, Whitesides GM. Langmuir. 1999;15:2055–2060. [Google Scholar]
- [9].Peluso P, Wilson DS, Do D, Tran H, Venkatasubbaiah M, Quincy D, Heidecker B, Poindexter K, Tolani N, Phelan M, Witte K, Jung LS, Wagner P, Nock S. Analytical Biochemistry. 2003;312:113–124. doi: 10.1016/s0003-2697(02)00442-6. [DOI] [PubMed] [Google Scholar]
- [10].Caruso F, Niikura K, Furlong DN, Okahata Y. Langmuir. 1997;13:3427–3433. doi: 10.1021/ac961220r. [DOI] [PubMed] [Google Scholar]
- [11].Bieri C, Ernst OP, Heyse S, Hofmann KP, Vogel H. Nature Biotechnology. 1999;17:1105–1108. doi: 10.1038/15090. [DOI] [PubMed] [Google Scholar]
- [12].Tharanathan RN, Kittur FS. Critical Reviews in Food Science and Nutrition. 2003;43:61–87. doi: 10.1080/10408690390826455. [DOI] [PubMed] [Google Scholar]
- [13].Tan W, Desai TA. Biomedical Microdevices. 2003;5:235–244. [Google Scholar]
- [14].Cosnier S. Analytical Letters. 2007;40:1260–1279. [Google Scholar]
- [15].Cosnier S. Biosensors & Bioelectronics. 1999;14:443–456. doi: 10.1016/s0956-5663(99)00024-x. [DOI] [PubMed] [Google Scholar]
- [16].Gerard M, Chaubey A, Malhotra BD. Biosensors & Bioelectronics. 2002;17:345–359. doi: 10.1016/s0956-5663(01)00312-8. [DOI] [PubMed] [Google Scholar]
- [17].Ramanavicius A, Ramanaviciene A, Malinauskas A. Electrochimica Acta. 2006;51:6025–6037. [Google Scholar]
- [18].Sargent A, Loi T, Gal S, Sadik OA. Journal of Electroanalytical Chemistry. 1999;470:144–156. [Google Scholar]
- [19].Fan CH, Wang S, Hong JW, Bazan GC, Plaxco KW, Heeger AJ. Proceedings of the National Academy of Sciences of the United States of America. 2003;100:6297–6301. doi: 10.1073/pnas.1132025100. [DOI] [PMC free article] [PubMed] [Google Scholar]
- [20].Wang J, Jiang M. Langmuir. 2000;16:2269–2274. [Google Scholar]
- [21].Ateh DD, Navsaria HA, Vadgama P. Journal of the Royal Society Interface. 2006;3:741–752. doi: 10.1098/rsif.2006.0141. [DOI] [PMC free article] [PubMed] [Google Scholar]
- [22].Liao W, Cui XT. Biosensors & Bioelectronics. 2007;23:218–224. doi: 10.1016/j.bios.2007.04.004. [DOI] [PubMed] [Google Scholar]
- [23].Caminade AM, Turrin CO, Majoral JP. Chemistry-a European Journal. 2008;14:7422–7432. doi: 10.1002/chem.200800584. [DOI] [PubMed] [Google Scholar]
- [24].Li YG, Tseng YD, Kwon SY, D’Espaux L, Bunch JS, McEuen PL, Luo D. Nature Materials. 2004;3:38–42. doi: 10.1038/nmat1045. [DOI] [PubMed] [Google Scholar]
- [25].Gau JJ, Lan EH, Dunn B, Ho CM, Woo JCS. Biosensors & Bioelectronics. 2001;16:745–755. doi: 10.1016/s0956-5663(01)00216-0. [DOI] [PubMed] [Google Scholar]
- [26].Gau V, Ma SC, Wang H, Tsukuda J, Kibler J, Haake DA. Methods. 2005;37:73–83. doi: 10.1016/j.ymeth.2005.05.008. [DOI] [PMC free article] [PubMed] [Google Scholar]
- [27].Gau VJJ, Ho CM, McCabe ERB. Pediatric Research. 2003;53:324A–324A. [Google Scholar]
- [28].Lee CY, Nguyen PCT, Grainger DW, Gamble LJ, Castner DG. Analytical Chemistry. 2007;79:4390–4400. doi: 10.1021/ac0703395. [DOI] [PMC free article] [PubMed] [Google Scholar]
- [29].Ricci F, Lai RY, Heeger AJ, Plaxco KW, Sumner JJ. Langmuir. 2007;23:6827–6834. doi: 10.1021/la700328r. [DOI] [PMC free article] [PubMed] [Google Scholar]
- [30].Peterson AW, Wolf LK, Georgiadis RM. Journal of the American Chemical Society. 2002;124:14601–14607. doi: 10.1021/ja0279996. [DOI] [PubMed] [Google Scholar]
- [31].Popp D, Yamamoto A, Maeda Y. Journal of Molecular Biology. 2007;368:365–374. doi: 10.1016/j.jmb.2007.01.087. [DOI] [PubMed] [Google Scholar]
- [32].Bonanno LM, DeLouise LA. Langmuir. 2007;23:5817–5823. doi: 10.1021/la063659c. [DOI] [PMC free article] [PubMed] [Google Scholar]
- [33].Calonder C, Matthew HWT, Van Tassel PR. Journal of Biomedical Materials Research Part A. 2005;75A:316–323. doi: 10.1002/jbm.a.30417. [DOI] [PubMed] [Google Scholar]
- [34].Vikholm I, Albers WM. Langmuir. 1998;14:3865–3872. [Google Scholar]
- [35].Chung JW, Park JM, Bernhardt R, Pyun JC. Journal of Biotechnology. 2006;126:325–333. doi: 10.1016/j.jbiotec.2006.05.010. [DOI] [PubMed] [Google Scholar]
- [36].Boozer C, Chen SF, Jiang SY. Langmuir. 2006;22:4694–4698. doi: 10.1021/la052908e. [DOI] [PubMed] [Google Scholar]
- [37].Wong DT. Journal of the American Dental Association. 2006;137:313–321. doi: 10.14219/jada.archive.2006.0180. [DOI] [PubMed] [Google Scholar]
- [38].Li Y, St John MAR, Zhou XF, Kim Y, Sinha U, Jordan RCK, Eisele D, Abemayor E, Elashoff D, Park NH, Wong DT. Clinical Cancer Research. 2004;10:8442–8450. doi: 10.1158/1078-0432.CCR-04-1167. [DOI] [PubMed] [Google Scholar]
- [39].Wei F, Wang JH, Liao W, Zimmermann BG, Wong DT, Ho CM. Nucleic Acids Research. 2008 doi: 10.1093/nar/gkn299. doi:10.1093/nar/gkn299. [DOI] [PMC free article] [PubMed] [Google Scholar]
- [40].Wei F, Qu P, Zhai L, Chen CL, Wang HF, Zhao XS. Langmuir. 2006;22:6280–6285. doi: 10.1021/la060602h. [DOI] [PubMed] [Google Scholar]
- [41].Wei F, Chen CL, Zhai L, Zhang N, Zhao XS. Journal of the American Chemical Society. 2005;127:5306–5307. doi: 10.1021/ja043661v. [DOI] [PubMed] [Google Scholar]
- [42].Fan Y, Chen XT, Trigg AD, Tung CH, Kong JM, Gao ZQ. Journal of the American Chemical Society. 2007;129:5437–5443. doi: 10.1021/ja067477g. [DOI] [PubMed] [Google Scholar]
- [43].Jiang C, Yang T, Jiao K, Gao HW. Electrochimica Acta. 2008;53:2917–2924. [Google Scholar]
- [44].Kros A, Sommerdijk N, Nolte RJM. Sensors and Actuators B-Chemical. 2005;106:289–295. [Google Scholar]
- [45].Schuhmann W, Kranz C, Wohlschlager H, Strohmeier J. Biosensors & Bioelectronics. 1997;12:1157–1167. doi: 10.1016/s0956-5663(97)00086-9. [DOI] [PubMed] [Google Scholar]
- [46].SantaLucia J. Proceedings of the National Academy of Sciences of the United States of America. 1998;95:1460–1465. doi: 10.1073/pnas.95.4.1460. [DOI] [PMC free article] [PubMed] [Google Scholar]
- [47].Zuker M. Nucleic Acids Research. 2003;31:3406–3415. doi: 10.1093/nar/gkg595. [DOI] [PMC free article] [PubMed] [Google Scholar]
Associated Data
This section collects any data citations, data availability statements, or supplementary materials included in this article.