

Abstract
Due to the inherent complexity of, and interactions between, biochemical pathways commonly altered in disease states, it has become accepted that multiplexed analyses can provide a more informative biomolecular understanding of disease onset and progression. Importantly, compared to conventional single-parameter assays, the detailed biomolecular insight gleaned from multiparameter measurements has the potential to greatly improve disease diagnostics, prognostics, and theragnostics. We have previously reported the utility of silicon photonic microring resonators for the sensitive quantitation of a single disease biomarker and herein demonstrate the first example of optical microcavity resonator arrays performing quantitative, and label-free, multiplexed analyses of clinically relevant protein biomarkers. In this report, the concentrations of prostate specific antigen (PSA), α-fetoprotein (AFP), carcinoembryonic antigen (CEA), tumor necrosis factor alpha (TNF-α), and interleukin-8 (IL-8) are simultaneously determined in three unknown protein cocktail solutions. This paper demonstrates that multiple immunoassays can be performed concurrently on a microresonator platform without any accompanying loss of sensitivity or measurement precision, and, therefore, this report lays the groundwork for future applications involving multiplexed analysis of clinically-relevant samples.
Label-free bioanalytical technologies have recently garnered increased interest for their ability to generate highly sensitive and quantitative measurements without the cost, complexity, or labeling heterogeneity introduced by techniques requiring fluorescent or enzymatic tags.1, 2 In particular, optical biosensors based on refractive index (RI) changes associated with analyte binding hold particular promise for conducting multiparameter biological analyses without labels.3-5 Within the realm of label-free RI-based optical biosensors, microcavity resonators have demonstrated the ability to sensitively detect a diverse array of biological analytes including proteins,6-9 nucleic acids,10, 11 cells,12 and viruses.13, 14 The theory behind microcavity sensor operation has been previously described elsewhere.15, 16 Briefly, precisely fabricated microring structures effectively support optical modes of extremely narrow spectral bandwidth according to a well-defined resonance condition. The wavelength of light that satisfies this condition is highly sensitive to changes in refractive index near the surface (e.g. antigen binding to immobilized antibody); therefore, the monitoring of resonance wavelength in the presence of an antigen-containing solution provides the detection modality. Arrays of silicon photonic microring resonators, which can be routinely fabricated using well-established semiconductor processing techniques, have been previously demonstrated for biomolecular detection.8, 17-20 However, despite their promise for highly multiplexed detection, previous reports have yet to demonstrate the ability to simultaneously detect and rigorously quantitate multiple clinically relevant analytes from a single sample volume using a single sensor array.
Previously, we demonstrated the use of silicon photonic microring resonators for quantitation of the cancer biomarker carcinoembryonic antigen (CEA) with a clinically relevant limit of detection comparable to a CEA enzyme-linked immunosorbent assay (ELISA).6 Extending beyond single parameter quantitation, this work demonstrates multiplexed detection using arrays of silicon-on-insulator microring resonators. Multiparameter bioanalytical technologies that provide multiple clinically relevant measurements from a single sample are of great value to applications ranging from individualized diagnosis to fundamental studies in systems biology.21, 22 Though a previous report has indicated the ability to perform multiplex measurements on nucleic acids using a microsphere-based sensing strategy,11 we significantly extend the multiplexing capabilities of microcavity resonators by demonstrating the ability to simultaneously perform 20 unique label-free immunoassays in parallel. Using these twenty independent sensors, we report an assay, run in quadruplicate, for five clinically relevant protein biomarkers [CEA, prostate specific antigen (PSA), alpha-fetoprotein (AFP), interleukin-8 (IL-8), and tumor necrosis factor-alpha (TNF-α)] on a single silicon photonic microring resonator array. Cross-reactivity profiles and individual calibration curves are generated for each antigen, and the platform is validated by accurate quantitation of three separate unknown protein cocktails in a blind analysis.
The experimental setup has been previously described,6, 23 and a detailed description of materials and procedures utilized in these experiments can be found in the Supporting Information. Briefly, a microchip with thirty-two sensors (eight of which are used for thermal control) is functionalized with 6-hydrazinonicotinamide (S-HyNic) to enable covalent attachment of antibodies containing 4-formylbenzamide (4FB) moieties. Using a six-channel PDMS microfluidic device (see Figure S-1 in Supporting Information), each antigen-specific monoclonal mouse IgG antibody is localized to a single channel (4 microring sensors per channel) for the specific recognition of one of five human biomarkers (PSA, IL-8, CEA, AFP, or TNF-α). The sixth channel contains a mouse IgG isotype control antibody that serves as an on-chip control for non-specific adsorption and bulk refractive index changes.
Following antibody immobilization, the specificity of the sensors for each antigen was tested to ensure that antibody cross-reactivity was minimal. The six-channel PDMS microfluidic was replaced by a single channel Mylar gasket (see Figure S-1 in Supporting Information) to probe all of the sensors simultaneously. Five different solutions, each containing 1 μg/mL of a different purified protein cancer biomarker diluted in 0.1 mg/mL bovine serum albumin in PBS (BSA-PBS), were sequentially flowed for 10 minutes. As expected, the rings functionalized with the mouse IgG isotype control did not interact with any of the biomarkers; thus, these rings were utilized as controls to correct off baseline drift due to thermal fluctuations or bulk refractive index changes. Figure 1 displays the control-subtracted response of the microrings (four microrings per antibody) plotted with the relative shift in the resonance wavelength (given as the change of wavelength in picometers, or Δ pm) as a function of time. Each set of microrings functionalized with a particular biomarker-specific antibody responded only to the appropriate antigen solution. The lack of response in the off-diagonal plots demonstrates that there was minimal sensor cross-reactivity for these antibody-antigen combinations and that the control rings effectively removed any sensor drift. The only minor exception occurs with the anti-CEA- and anti-AFP-functionalized sensors in response to IL-8. This response, which is hardly observable even at the highest antigen concentration, results from a bulk refractive index shift from an unknown constituent in the IL-8 stock solution. Upon dilution of IL-8 for experiments at more physiologically relevant concentrations, this bulk refractive shift becomes negligible and therefore does not compromise the ability to perform multiplexed protein quantitation.
Figure 1.

Cross-reactivity diagram. Each row represents the response of four rings functionalized with a particular antibody, as designated on the left hand axes (shift given as change in resonance peak wavelength in picometers); each column shows the sensor response upon addition of a 1 μg/mL solution of a single antigen designated at the top of the respective column. The x- and y-scales are identical for all real-time association plots.
Differences in the antigen responses in Figure 1 (both within a set of sensors functionalized with the same antibody and between sets of sensors functionalized with different antibodies) are the result of several factors. First, variations in protein size result in different responses.24 Binding of a large protein such as CEA (185 kDa) gives a proportionally larger change in refractive index near the surface than a smaller protein such as IL-8 (8 kDa). Second, any variation in antibody surface coverage will lead to differences in the number of available active binding sites on a given sensor. Finally, the fractional occupation of available binding sites on the sensor is strongly influenced by antibody-antigen binding affinity, which differs for each antibody used in this study. As seen in Figure 1, each set of rings functionalized within a particular flow channel demonstrates a consistent response upon antigen addition. The only notable exception is for IL-8, where two of the rings have a noticeably smaller response than the other two rings.
To demonstrate quantitative multiplexed sensing, standard solutions were created that contain a mixture of each of the five antigens at different concentrations. We utilized the responses from these standards to independently calibrate each microring sensor using a previously described initial slope analysis method (briefly described in the Supporting Information).6 Real-time response curves for CEA and TNF-α were fit to linear functions since these sensors were far from saturation at the particular concentrations and time intervals we used. Responses from PSA, IL-8, and AFP more closely approach binding equilibrium and therefore were more accurately fit to exponential functions (see Supporting Information), and initial slopes were determined by solving for the first derivative of the fitted exponential function at t = 0. From the initial slope data, calibration curves for each sensor ring were constructed. The top portion of Figure 2 displays overlays of the real-time response curves for five representative rings, each functionalized with a different antibody. Each color on the graph represents a different concentration of antigen between 0 and 150 ng/mL. The lower portion of Figure 2 shows the calibration curves generated from the real-time data using the initial slopes of the response curves. The response and calibration curves for all twenty sensors can be found in Figures S-2,3 of Supporting Information.
Figure 2.

Real time response curves for five representative sensors (out of 20 total) and corresponding calibration curves based on the initial slope of the response curve. For the response curves, the colored lines represent the following concentrations of the antibody-specific antigen: red, 150 ng/mL; green, 100 ng/mL; blue, 50 ng/mL; purple, 20 ng/mL; orange, 10 ng/mL; black, 0 ng/mL; gray, unknown solutions. For the calibration curves, black circles are calibration points and red squares represent unknowns.
Figure 3.
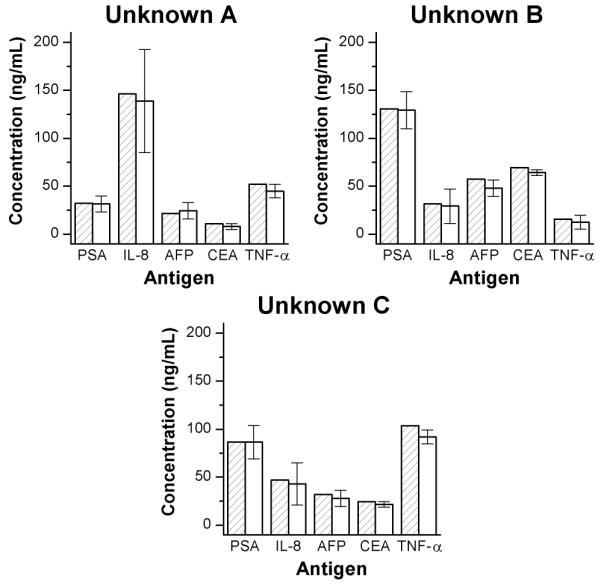
Evaluation of unknown protein cocktails A, B, and C comparing the measured values (unfilled bars) with the actual, as-prepared values (bars hatched with diagonal lines) for each of the five antigens. Error bars represent the 95% confidence interval, n = 4 trials.
Since all antigens are mixed together and introduced simultaneously, it is possible to calibrate all of the sensors at once rather than individually with each antigen. The concentration of each of the antigens was varied within every calibration mixture so that any interferences between antigens could be minimized (the exact concentration mixtures are given in Table S-1 of Supporting Information). In addition, simultaneous calibration with variable concentrations of each antigen helps avoid systematic errors that might be caused by long-term instrument drift or operator error while performing serial dilutions. To ensure reproducibility of the calibrations, each standard solution was analyzed in triplicate. Following analysis of a single solution, the sensor surface was regenerated with glycine buffer (pH 2.2) in preparation for subsequent standard and unknown solution analyses that were all performed sequentially on the same chip. Single-blind analyses of unknown samples containing variable concentrations of all five antigens were interspersed among the calibration standard analyses.
Using the calibration curves for each ring, antigen concentrations for the three unknown mixture were determined. Figure 3 displays the concentrations of the unknowns as determined using the microring resonator sensors (values are given in Table S-2 in Supporting Information). Each reported value (unfilled bars) is the average concentration as determined by four microring sensors. Comparing these concentrations with the as-prepared values (diagonally-hatched bars), it is apparent that all of the as-prepared concentrations fall within the error bounds of the measurement techniques (95% confidence interval, 4 independent measurements). The average measurement error was approximately 8 ng/mL. Measurements for IL-8 display relatively higher uncertainty compared to the other sensors. However, as shown in Figure 3, averaging the results from each of the four microring sensors still enables a reasonably accurate measurement of the concentrations (within 10% of exact concentration), even though the IL-8 precision could be improved. Overall, Figure 3 demonstrates that the system can simultaneously quantitate multiple protein biomarkers in solution via a method that would only require a 5-minute analysis, given a pre-calibrated sensor array.
This report describes a critically important development for resonant optical microcavity-based biosensors in that it details the first platform capable of high-level multiplexing and demonstrates that there is no significant sacrifice of absolute sensitivity and measurement precision, compared to an analogous single-parameter analysis. The system described herein—consisting of five antigens in albumin-containing buffer—is admittedly less complex than that encountered in a clinical setting, and future work will focus on analyses in samples such as human serum or whole-cell lysate. We previously reported on complications that can arise due to non-specific adsorption from complex solutions,6 and therefore efforts to improve the biofouling resistance of the sensor surfaces are being pursued in parallel. While this microfluidic approach allowed introduction of six different capture agents to the sensor chip surface, higher level multiplexing will require interfacing the microring resonator array with conventional microarray spotting instrumentation, which is facilitated by the current 200 μm ring-to-ring spacing.
Supplementary Material
Acknowledgments
This work was funded by the NIH Director’s New Innovator Award Program, part of the NIH Roadmap for Medical Research, through grant number 1-DP2-OD002190-01 and the Camille and Henry Dreyfus Foundation. ALW is supported via a National Science Foundation Graduate Research Fellowship. MSL is supported by a National Science Foundation Graduate Research Fellowship and a Robert C. and Carolyn J. Springborn Fellowship from the Department of Chemistry at the University of Illinois at Urbana-Champaign. We acknowledge Abraham Qavi for his assistance in creating the unknown solutions.
Footnotes
Supporting Information Available: This material is available free of charge via the Internet at http://pubs.acs.org.”
References
- (1).Kodadek T. Chem. Biol. 2001;8:105–115. doi: 10.1016/s1074-5521(00)90067-x. [DOI] [PubMed] [Google Scholar]
- (2).Sun YS, Landry JP, Fei YY, Zhu XD, Luo JT, Wang XB, Lam KS. Langmuir. 2008;24:13399–13405. doi: 10.1021/la802097z. [DOI] [PMC free article] [PubMed] [Google Scholar]
- (3).Qavi AJ, Washburn AL, Byeon JY, Bailey RC. Anal. Bioanal. Chem. 2009;394:121–135. doi: 10.1007/s00216-009-2637-8. [DOI] [PMC free article] [PubMed] [Google Scholar]
- (4).Fan X, White IM, Shopoua SI, Zhu H, Suter JD, Sun Y. Anal. Chim. Acta. 2008;620:8–26. doi: 10.1016/j.aca.2008.05.022. [DOI] [PMC free article] [PubMed] [Google Scholar]
- (5).Cunningham BT. Encycl. Sens. Vol. 5. 2006. pp. 197–213. [Google Scholar]
- (6).Washburn AL, Gunn LC, Bailey RC. Anal. Chem. 2009;81:9499–9506. doi: 10.1021/ac902006p. [DOI] [PMC free article] [PubMed] [Google Scholar]
- (7).Armani AM, Kulkarni RP, Fraser SE, Flagan RC, Vahala KJ. Science. 2007;317:783–787. doi: 10.1126/science.1145002. [DOI] [PubMed] [Google Scholar]
- (8).Ramachandran A, Wang S, Clarke J, Ja SJ, Goad D, Wald L, Flood EM, Knobbe E, Hryniewicz JV, Chu ST, Gill D, Chen W, King O, Little BE. Biosens. Bioelectron. 2008;23:939–944. doi: 10.1016/j.bios.2007.09.007. [DOI] [PubMed] [Google Scholar]
- (9).Zhu H, White IM, Suter JD, Dale PS, Fan X. Opt. Express. 2007;15:9139–9146. doi: 10.1364/oe.15.009139. [DOI] [PubMed] [Google Scholar]
- (10).Suter JD, White IM, Zhu H, Shi H, Caldwell CW, Fan X. Biosens. Bioelectron. 2008;23:1003–1009. doi: 10.1016/j.bios.2007.10.005. [DOI] [PubMed] [Google Scholar]
- (11).Vollmer F, Arnold S, Braun D, Teraoka I, Libchaber A. Biophys. J. 2003;85:1974–1979. doi: 10.1016/S0006-3495(03)74625-6. [DOI] [PMC free article] [PubMed] [Google Scholar]
- (12).Ren HC, Vollmer F, Arnold S, Libchaber A. Opt. Express. 2007;15:17410–17423. doi: 10.1364/oe.15.017410. [DOI] [PubMed] [Google Scholar]
- (13).Zhu H, White IM, Suter JD, Zourob M, Fan X. Analyst. 2008;133:356–360. doi: 10.1039/b716834a. [DOI] [PubMed] [Google Scholar]
- (14).Vollmer F, Arnold S, Keng D. Proc. Natl. Acad. Sci. 2008;105:20701–20704. doi: 10.1073/pnas.0808988106. [DOI] [PMC free article] [PubMed] [Google Scholar]
- (15).Vollmer F, Arnold S. Nat. Methods. 2008;5:591–596. doi: 10.1038/nmeth.1221. [DOI] [PubMed] [Google Scholar]
- (16).Jokerst N, Royal M, Palit S, Luan L, Dhar S, Tyler T. J. Biophotonics. 2009;2:212–226. doi: 10.1002/jbio.200910010. [DOI] [PubMed] [Google Scholar]
- (17).De Vos KM, Bartolozzi I, Bienstman P, Baets R, Schacht E. Proc. SPIE. 2007;6447:64470K. doi: 10.1364/oe.15.007610. [DOI] [PubMed] [Google Scholar]
- (18).Wang S, Ramachandran A, Ja S-J. Biosens. Bioelectron. 2009;24:3061–3066. doi: 10.1016/j.bios.2009.03.027. [DOI] [PubMed] [Google Scholar]
- (19).Xu DX, Densmore A, Delâge A, Waldron P, McKinnon R, Janz S, Lapointe J, Lopinski G, Mischki T, Post E, Cheben P, Schmid JH. Opt. Express. 2008;16:15137–15148. doi: 10.1364/oe.16.015137. [DOI] [PubMed] [Google Scholar]
- (20).Yalcin A, Popat KC, Aldridge JC, Desai TA, Hryniewicz J, Chbouki N, Little BE, King O, Van V, Chu S, Gill D, Anthes-Washburn M, Unlu MS. IEEE J. Sel. Top. Quantum Electron. 2006;12:148–155. [Google Scholar]
- (21).Ligler FS. Anal. Chem. 2009;81:519–526. doi: 10.1021/ac8016289. [DOI] [PMC free article] [PubMed] [Google Scholar]
- (22).Bailey RC. Bioanalysis. 2009;1:1043–1047. doi: 10.4155/bio.09.101. [DOI] [PMC free article] [PubMed] [Google Scholar]
- (23).Iqbal M, Gleeson M, Tybor F, Spaugh B, Gunn W, Hochberg M, Baehr-Jones T, Bailey RC, Gunn LC. IEEE J. Sel. Top. Quantum Electron. 2009 in press. [Google Scholar]
- (24).Noto M, Khoshsima M, Keng D, Teraoka I, Kolchenko V, Arnold S. Appl. Phys. Lett. 2005;87:223901–223901. [Google Scholar]
Associated Data
This section collects any data citations, data availability statements, or supplementary materials included in this article.