Abstract
Aims
Whole body and myocardial insulin resistance are features of non-insulin-dependent diabetes mellitus (NIDDM) and left-ventricular dysfunction (LVD). We determined whether abnormalities of insulin receptor substrate-1 (IRS1), IRS1-associated PI3K (IRS1-PI3K), and glucose transporter 4 (GLUT4) contribute to tissue-specific insulin resistance.
Methods and results
We collected skeletal muscle (n = 27) and myocardial biopsies (n = 24) from control patients (n = 7), patients with NIDDM (n = 9) and patients with LVD (n = 8), who were characterized by euglycaemic–hyperinsulinaemic clamp and positron emission tomography. Comparative studies were carried out in three mouse models. We demonstrate an unrecognized reduction of IRS1 in skeletal muscle of LVD patients and an unexpected increase in cardiac IRS1-PI3K activity in NIDDM and LVD patients. In NIDDM, there was a concomitant reduction in sarcolemmal GLUT4, whereas in patients with LVD sarcolemmal GLUT4 was increased. We confirm activation of IRS1-PI3K and reduction in sarcolemmal GLUT4 in the insulin resistant ob/ob mouse heart where we also demonstrate perturbation of GLUT4 docking and fusion. A direct relationship between PI3K and GLUT4 was demonstrated in mice expressing activated PI3K in the heart and increased GLUT4 at the sarcolemma was confirmed in a mouse model of LVD.
Conclusion
Our data show that the mechanisms of myocardial insulin resistance are different between NIDDM and LVD.
Keywords: Insulin, Congestive heart failure, Diabetes, Imaging
Introduction
Whole body insulin resistance is a predominant feature of non-insulin-dependent diabetes mellitus (NIDDM). Although less well recognized, whole body insulin resistance is also a feature of left ventricular (LV) dysfunction (LVD) and congestive heart failure (CHF)1,2 and the severity of insulin resistance independently predicts mortality.3,4
The pathophysiology of tissue- and disease-specific insulin resistance remains poorly characterized, but is of increasing clinical importance given the global burden of insulin resistant syndromes that contribute significantly to cardiovascular morbidity and mortality in these patients. In insulin-resistant patients, diminished whole body glucose disposal largely reflects abnormalities of the skeletal muscle.2 A key component of insulin signalling involves recruitment of insulin receptor substrate-1 (IRS1) to the activated insulin receptor and activation of IRS1-associated phosphatidylinositol-3 kinase (PI3K). In skeletal muscle, abnormalities of IRS1 tyrosine phopshorylation have been described in patients with insulin resistance and in animal models of this condition.5,6 Thus, disruption of IRS1 function might contribute significantly to whole body insulin resistance in diabetes.7 The weight of evidence suggests that levels of glucose transporter 4 (GLUT4, the main insulin-sensitive transporter) are unchanged in the skeletal muscle of insulin resistant patients.7 The molecular mechanism of whole body insulin resistance in patients with LVD remains unclear but, as in NIDDM, it may relate to disruption of IRS1 function.
Studies using positron emission tomography (PET) have shown that, in addition to the whole body phenotype, the myocardium of both NIDDM and LVD patients is insulin resistant.8 In the heart, as in skeletal muscle, IRS1-associated PI3K (IRS1-PI3K) activity is important for insulin-stimulated glucose disposal and is also a key factor in the regulation of cardiac growth.9,10 Perhaps surprisingly, the insulin receptor in the heart was found to be paradoxically activated in a mouse model of diabetes.11 Furthermore, it has been observed that, in contrast to skeletal muscle, there is an unexpected activation of Akt, a downstream target of IRS1-PI3K, in end-stage CHF that is characterized by myocardial insulin resistance.8,12,13 Overall, studies of insulin signalling in the heart are at odds with the findings in skeletal muscle and these intriguing dissimilarities remain unexplained.
The aim of the present study was to investigate further the mechanisms of insulin resistance at the whole body and myocardial level in patients with NIDDM or LVD using a combination of non-invasive imaging and ex vivo assays on biopsy samples. Comparative studies were conducted in animal models of insulin resistance and LVD.
Methods
Study population and clinical phenotyping
Consecutive patients awaiting routine cardiac surgery who were suitable for inclusion were invited to take part in the study over a 3 year period. Inclusion criteria were age 35–75 years, creatinine <200 µmol/L, an echocardiogram, and coronary angiogram within 3 months. Exclusion criteria were myocardial infarction within 3 months, LV ejection fraction <15%, claustrophobia, viability in <35% of the LV as determined by cardiac magnetic resonance imaging (MRI) or PET, coincident LVD and NIDDM, inability to lie flat for 45 min, pacemaker implant or a quoted operative mortality of >15%. Patients were assigned to one of three groups: control, LVD, or NIDDM. All patients with NIDDM had preserved LV function. Patients with normal LV function, without NIDDM and no history of myocardial infarction undergoing cardiac surgery were used as the control group (i.e. coronary artery disease or mitral valve stenosis). Patients were considered to have LVD, with or without symptoms of heart failure, if their ejection fraction was <40%. All patients with NIDDM had previously been diagnosed with the condition and all had normal systolic LV function.
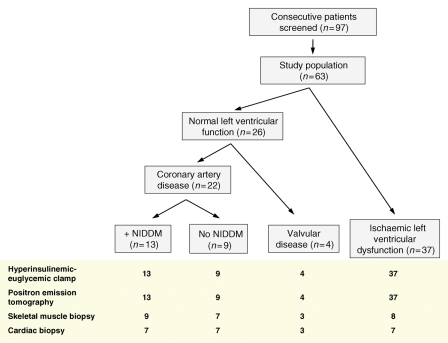
Of the patients invited to take part (n = 97), 63 were enrolled into the study. Following recruitment, non-progression to intra-operative biopsy collection most commonly occurred in the LVD group based on non-invasive imaging assessments, due to inter-current illness or after assessment of predicted operative mortality or due to patient refusal. All patients were managed with optimal medical therapy, all anti-diabetic treatment was stopped the evening prior to cardiac surgery (Table 1). The study protocol was approved by the local Ethics Committee and the Administration of Radioactive Substances Advisory Committee in compliance with guidelines. Written consent was obtained from all patients.
Table 1.
Main characteristics of the study population
| Controls | LVD | NIDDM | |
|---|---|---|---|
| Number | 13 | 37 | 13 |
| Gender (M/F) | 12/1 | 35/2 | 13/0 |
| Age (years) | 64 ± 13 | 64 ± 9 | 64 ± 9 |
| BMI (kg m−2) | 28 ± 7 | 25 ± 3 | 28 ± 5 |
| Medications (%) | BB (40) | BB (90) | BB (67) |
| ACE (47) | ACE (70) | ACE (77) | |
| CCB (24) | CCB (40) | CCB (55) | |
| D (6) | D (70) | D (33) | |
| ASA (53) | ASA (100) | Met (33) | |
| Sta (65) | Sta (100) | Sul (89 | |
| Tzd (33) | |||
| Ins (11) | |||
| ASA (100) | |||
| Sta (100) | |||
| Haemodynamic parameters | |||
| SBP (mmHg) | 135 ± 22 | 124 ± 13 | 142 ± 21 |
| DBP (mmHg) | 75 ± 7 | 75 ± 9 | 80 ± 9 |
| HR (b.p.m.) | 59 ± 10 | 65 ± 15 | 66 ± 8 |
| EF (%) | 60 ± 12 | 27 ± 11* | 58 ± 18 |
| Other parameters | |||
| Haemoglobin (g dL−1) | 14.1 ± 2.1 | 13.4 ± 1.3 | 13.7 ± 1.5 |
| Urea (mmol L−1) | 6.4 ± 2.3 | 5.8 ± 2.3 | 7.0 ± 4.1 |
| Creatinine (μmol L−1) | 104.1 ± 27 | 106.9 ± 23 | 102.8 ± 25 |
| Serum insulin (mU/L) | 7.1 ± 2.5 | 6.2 ± 3.1 | 12.4 ± 7.4*,** |
| Plasma glucose (mmol L−1) | 4.8 ± 0.5 | 5.4 ± 0.8 | 6.3 ± 1.9* |
| HbA1c (%) | 5.6 ± 0.2 | 5.7 ± 0.2 | 6.6 ± 1.1* |
| Triglycerides (mmol L−1) | 1.3 ± 0.3 | 1.3 ± 0.3 | 1.6 ± 0.8 |
| Total cholesterol (mmol L−1) | 4.3 ± 0.6 | 4.0 ± 1.2 | 3.5 ± 1.0 |
| FFA (mEq L−1) | 0.54 ± 0.2 | 0.93 ± 0.4 | 0.59 ± 0.4 |
Data are given as means ± SD.
BB, beta blocker; ACE, angiotensin converting enzyme inhibitor; CCB, calcium channel blocker; D, diuretic; Met, metformin; Sul, sulphonylurea; Tzd, thiazolidinedione; Ins, insulin; ASA, aspirin; Sta, statin; LVD, left-ventricular dysfunction; NIDDM, non-insulin-dependent diabetes mellitus; BMI, body-mass-index; SBP, systolic blood pressure; DBP, diastolic blood pressure; HR, heart rate; EF, ejection fraction; FFA, fasting levels of free fatty acids.
*P < 0.05 vs. control
**P < 0.01 vs. LVD.
Magnetic resonance imaging, positron emission tomography, and euglycaemic–hyperinsulinaemic clamp studies
PET with 18F-fluorodeoxyglucose (supplied by Hammersmith Imanet) was used to non- invasively quantify myocardial glucose utilization and myocardial viability under euglycaemic–hyperinsulinaemic clamp conditions.14 Whole body glucose disposal rates were derived from the steady-state phase of the euglycaemic–hyperinsulinaemic clamp.2 To guide the surgical collection of biopsies from viable, contractile myocardium of known metabolic function, patients were characterized using PET (definition of viability: myocardial glucose uptake ≥0.25 µmol/g/min).15 In addition to the routine echocardiogram, a new assessment of global and regional LV function was performed within 2 weeks of the PET scan using either cardiac MRI or echocardiography.
Biopsy collection
After establishing cardiopulmonary bypass, myocardial arrest was achieved and full thickness myocardial biopsies (∼50 mg) were harvested from the LV using a 5 mm corer. Biopsies were taken from viable segments as directed by PET analysis. Biopsy sites were over-sewn and haemostasis was achieved. On completion of the operation, haemostasis was re-checked before and after release of the cross-clamp. Two skeletal muscle biopsies (∼100 mg) were taken from the exposed superior epigastric muscles. All biopsy samples were rinsed in ice-cold saline solution and extraneous tissues were removed prior to freezing in liquid nitrogen.
Animals
Ob/+ and ob/ob diabetic mice were supplied by Charles River laboratories. Mice with cardiac specific expression of caPI3K have been described in detail elsewhere.9 For studies of LVD, transverse aortic constriction (TAC) was introduced to C57Bl6 mice using a 25G needle or sham-operation, as previously described.16,17 Mice were followed post-operatively with serial echocardiograms at 2 week intervals. Hypertrophy, as measured by increased wall thickness, was noted 3–4 weeks after TAC, and an increase in LV dilatation and diminished fractional shortening was noted 6–7 weeks after TAC (see Supplementary material online, Table S1). Mice were sacrificed 7 weeks after TAC, the hearts were harvested, washed in cold PBS, and flash frozen. For all studies male mice (6–12 weeks old) were used, which had been maintained on a normal chow diet using standard husbandry conditions.
For molecular studies the right ventricle and atria were removed and LV samples frozen in liquid nitrogen. All animals were fasted for 6 h before sacrifice. For insulin stimulation intra-peritoneal injection of 0.5 U/kg human insulin or an equal volume of saline for controls was given and animals were sacrificed 30 min post-injection. Animals were culled and hearts removed at the same time of day. To measure serum insulin levels of fasted animals the Rat/Mouse Insulin ELISA kit (Linco Research) was used according to manufacturer's instructions. Animal studies were performed in accordance with local guidelines with the approval of local Ethics Committees and conform to the Guide for the Care and Use of Laboratory Animals.
Cardiac muscle fractionation
Sucrose gradient purification was used to isolate cytosolic, intracellular vesicular pools, and sarcolemmal fractions from cardiac tissue as previously described.12,17 Hearts from 8- to 12-week-old male mice were removed, washed in ice-cold PBS, and homogenized in cold lysis buffer (20 mM HEPES, 250 mM sucrose, 1 mM EDTA, 5 mM benzamidine, 1 mM aprotinin, 1 mM pepstatin, 1 mM leupeptin, and 1 mM phenylmethylsulfonyl fluoride, pH 7.4). The homogenate was centrifuged (2000g, 10 min) and supernatants removed and centrifuged (9000g, 20 min). Pellets were resuspended in 500 µL PBS supplemented with protease inhibitors (as discussed earlier) and kept as the sarcolemmal fraction. Supernatants were then centrifuged (180 000g, 90 min) and the supernatants from this centrifugation step were kept as the cytosolic fraction. In each experiment, the same amount of protein was loaded for sarcolemmal and cytosolic fractions. The remaining pellets were resuspended in 500 µL of PBS with protease inhibitors and combined with the sarcolemmal fraction. Protein concentration was determined by Bradford assay, and equal amounts of protein were loaded on a 10–30% (wt/wt) continuous sucrose gradient and centrifuged at 48 000 r.p.m. for 55 min (SW-50 rotor). Gradients were separated into 9–10 fractions, the same volume from each fraction was loaded and separated by SDS–PAGE and immunoblotted as previously described.12,17
Immunoblotting, immunoprecipitation, and Akt kinase assay
Immunoblotting was performed as previously described18 with rabbit anti-IRS1, mouse monoclonal (clone 4G10) anti-phosphotyrosine, and rabbit anti-insulin receptor subunit β. Immunoprecipitation was performed as previously described12,19 and antibodies were pre-bound to protein sepharose A or G according to the manufacturers’ instructions. Receptor tyrosine kinase profiling was performed with pooled samples (n = 3–4) from the patient groups using receptor tyrosine kinase arrays (R&D systems) according to the manufacturers’ instructions. The assay uses antibodies spotted in duplicate onto the array against 42 human receptor tyrosine kinases which bind to the receptors in protein extracts to the array that are then interrogated using an anti-phosphotyrosine antibody. The Akt kinase assay (Cell Signaling) was performed as per the manufacturer's instructions. Primary antibodies: GLUT4 (Abcam), total Akt (Cell Signaling), phospho-(Ser473)-Akt (Cell Signaling), AS160 (Millipore), GSK3β (Cell Signaling), IRS-1 (Upstate Biotechnologies), insulin receptor beta subunit (Upstate), Caveolin-3 (Abcam), Scamp3 (Abcam), SNAP23 (Abcam), and Syntaxin 4 (Abcam). Secondary antibodies were conjugated to horseradish peroxidase (Dako). Where indicated, autoradiograph band intensity was determined by semi-quantitative densitometry (Quantity One, BioRad).
Insulin receptor substrate-1-associated phosphatidylinositol-3 kinase assay
The PI3K assay was performed as previously described.12,19 In brief, 1 mg of protein lysates was immunoprecipitated with anti-IRS-1 antibody (Upstate Biotechnologies), and kinase activity was detected by the incorporation of 32P to phosphatidylinositol 3-phosphate after thin layer chromatography (TLC) as previously described.12,19 Dried TLC plates were exposed to autoradiograph film and resultant signals were measured using semi-quantitative densitometry (Quantity One, BioRad). The IRS1-PI3K assay was not possible for four of the human myocardial biopsies due to sample size limitations and one biopsy did not yield sufficient protein for the assay.
Statistical analysis
All data are presented as mean ± SD. For regression analysis, association of myocardial IRS1-PI3K with body mass index (BMI), systolic blood pressure, ejection fraction, creatinine, insulin, and triglycerides was tested using the Enter method. For bivariate correlation analysis, Pearson correlations were used. For normal distribution analysis QQ plot was used. All reported P-values for comparison of means were performed using ANOVA and Tukey post hoc analysis. Statistical calculations were performed using SPSS version 12.0.
Results
Baseline characterization of the study population
The study population is described and illustrated in Figure 1 and Table 1. The three study groups were matched for age and gender. The BMI of patients with NIDDM was no different from that of the control group while patients with NIDDM had higher plasma glucose, insulin, and HbA1c levels.
Figure 1.
Consort diagram of human study design. NIDDM, non-insulin-dependent diabetes mellitus.
Euglycaemic–hyperinsulinaemic clamp studies and skeletal muscle insulin signalling
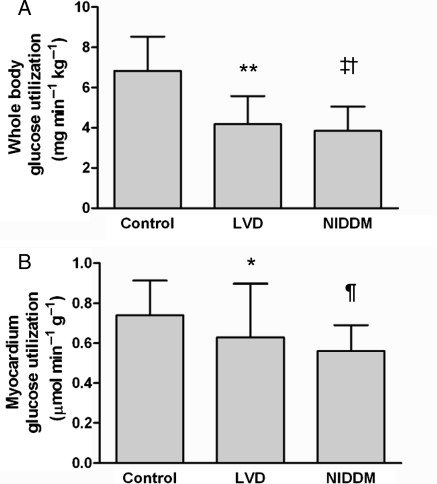
The average rate of whole body glucose disposal during the clamp studies was lower in patients with LVD or NIDDM when compared with control patients (Figure 2A). Likewise, myocardial glucose utilization was lower in patients with LVD or NIDDM when compared with the control group (Figure 2B). Further analysis of the data showed that the biopsy subgroup did not differ from the larger cohort with regard to whole body and myocardial glucose utilization.
Figure 2.
Whole body glucose disposal and myocardial glucose utilization. (A) Whole body glucose utilization under euglycaemic–hyperinsulinemic clamp conditions in patients with normal ventricular function without diabetes (control), patients with normal ventricular function and non-insulin-dependent diabetes mellitus (NIDDM) and patients with left-ventricular dysfunction (LVD); (**P = 0.002 vs. control, ‡P = 0.001 vs. control, †P = 0.05 vs. LVD). (B) Myocardial glucose utilization under euglycaemic–hyperinsulinemic clamp conditions as determined by positron emission tomography (PET) with 18F-fluorodeoxyglucose; (*P = 0.02 vs. control, ¶P = 0.006 vs. control).
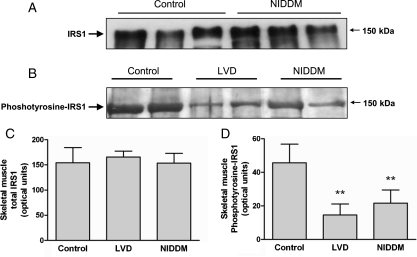
In molecular studies, the reduction in total body glucose utilization in NIDDM and LVD when compared with controls was not associated with any change in total cellular IRS1 expression or basal IRS1-PI3K activity in the skeletal muscle (Figure 3A and C). In agreement with a previous report,20 patients with NIDDM had a reduced IRS1 phosphotyrosine content in skeletal muscle biopsies when compared with controls. In addition, we observed a previously unrecognized reduction in IRS1 phosphotyrosine expression in skeletal muscle biopsies from patients with LVD (Figure 3B and D). We examined GLUT4 protein levels in the skeletal muscle and found no difference in total or sarcolemmal fractions of GLUT4. Levels were variable, but unchanged overall between the patient groups (see Supplementary material online, Figure S1).
Figure 3.
Insulin receptor substrate-1 (IRS1) protein levels and activity in skeletal muscle. (A) Immunoblot of IRS1 protein levels in total cell lysates from skeletal muscle biopsies. Levels of IRS1 were unchanged in patients with non-insulin-dependent diabetes mellitus when compared with controls. (B) Representative immunoblot of phosphotyrosine- IRS1 levels in skeletal muscle extracts as determined by phosphotyrosine immunoprecipitation and insulin receptor substrate-1 immunoblotting. (C) Quantification of total IRS1 levels in skeletal muscle biopsies in patient groups in optical units. (D) Quantification of phosphotyrosine- IRS1 levels in skeletal muscle biopsies in patient groups in optical units. **P = 0.001 vs. control.
Myocardial insulin signalling in patients with non-insulin-dependent diabetes mellitus or left-ventricular dysfunction
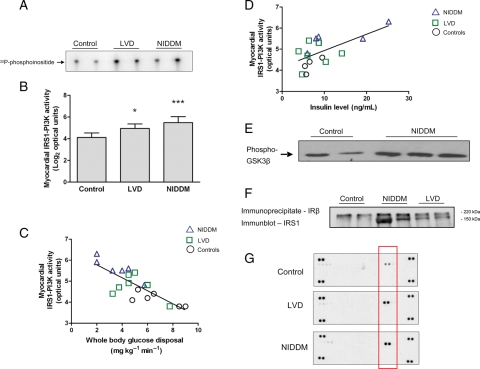
Patients with NIDDM or LVD, although insulin resistant at the myocardial level (Figure 2B), had a surprising increase in IRS1-PI3K activity in the heart, in the absence of a change in total IRS1 levels (Figure 4A and B and data not shown). In a multivariate regression analysis, there was a significant inverse association (r = −0.68, P = 0.01) between IRS1-PI3K activity and whole body glucose disposal. In separate analyses, we observed a positive correlation between fasting insulin levels and myocardial IRS1-PI3K activity (r = 0.64, P = 0.007) (Figure 4C and D). Akt, the downstream target of PI3K, exhibited increased activity in patients with NIDDM (Figure 4E), but not in patients with LVD (data not shown). To determine the mechanism of IRS1-PI3K activation in the insulin resistant heart, we examined the physical interaction of the insulin receptor with IRS1 and found an increased association of these molecules (Figure 4F). There was also increased activity of the insulin receptor in these patients (Figure 4G).
Figure 4.
Activation of insulin receptor substrate-1-phosphatidylinositol-3 kinase (IRS1-PI3K) and the insulin receptor in the diabetic heart. (A) Autoradiograph of myocardial IRS1-PI3K activity in cardiac biopsies as determined by in vitro kinase assay. (B) Quantification of IRS1-PI3K activity in arbitrary optical units. Data were transformed to a logarithmic scale (base 2) for linear regression analysis; *P = 0.02 vs. control, ***P < 0.0001 vs. control. (C) Inverse log-linear association of myocardial IRS1-PI3K activity and whole body glucose utilization across the study population by multivariate regression analysis (r = −0.68, P = 0.01). (D) Positive correlation between fasting insulin levels and myocardial IRS1-PI3K activity (r = 0.64, P = 0.007). (E) Representative immunoblot of Akt kinase activity towards GSK3β in patients with non-insulin-dependent diabetes mellitus and controls. (F) Representative immunoblot of IRS1 following immunoprecipitation of the insulin receptor; IRS1 is located at 150 kDa and a non-specific protein band is seen at ∼220 kDa. (G) Autoradiograph of receptor tyrosine kinase arrays using pooled samples (n = 3–4) from the patient groups and controls. The two spots at the four corners of the arrays are internal positive controls. Highlighted in the red rectangle is the signal (two technical replicates) generated by the phosphorylated insulin receptor. The experiment was repeated with similar results.
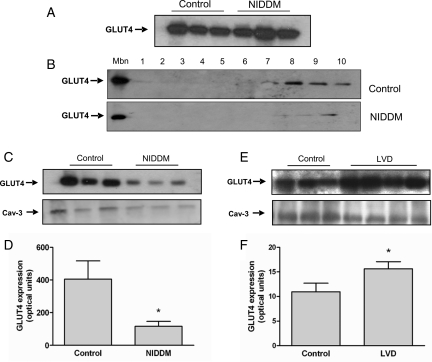
It was unclear how activation of PI3K alone could explain myocardial insulin resistance in our study population and we therefore examined GLUT4. We observed no differences in total cellular GLUT4 levels between patients with NIDDM or controls (Figure 5A). However, sub-cellular fractionation studies revealed a marked downregulation of GLUT4 expression at the sarcolemma and within intra-cellular vesicles in patients with NIDDM when compared with controls (Figure 5B–D). In contrast, in patients with LVD there was increased expression of GLUT4 at the sarcolemma (Figure 5E–F) and a trend towards higher total cellular GLUT4 levels and no difference in GLUT1 levels (data not shown).
Figure 5.
Myocardial glucose transporter 4 (GLUT4) levels in patients with non-insulin-dependent diabetes mellitus or left-ventricular dysfunction. (A) Immunoblot of GLUT4 levels in total cell lysates from patients with non-insulin-dependent diabetes mellitus and controls. (B–D) Sucrose gradient fractionation of cardiac muscle proteins. (B) Upper panel, representative immunoblot of GLUT4 expression at the plasma membrane fraction (Mbn) and across sucrose gradient fractions (1–10) in a control patient. Lower panel, immunoblot of GLUT4 expression at the Mbn and across sucrose gradient fractions (1–10) in a patient with non-insulin-dependent diabetes mellitus. (C) Immunoblot of GLUT4 levels at the plasma membrane fraction (upper panel) and Caveolin-3 (Cav-3) as loading control (lower panel) in controls or patients with non-insulin-dependent diabetes mellitus. (D) Quantification of GLUT4 expression at the sarcolemma in control patients (n = 3) and patients with non-insulin-dependent diabetes mellitus (n = 3) in arbitrary optical units; (*P = 0.01). (E and F) Myocardial GLUT4 levels in patients with left-ventricular dysfunction. (E) Immunoblot of GLUT4 levels at the sarcolemma (upper panel) and Caveolin-3 as loading control (lower panel) in control patients or patients with left-ventricular dysfunction. (F) Quantification of GLUT4 expression at the sarcolemma in control patients (n = 3) and patients with left-ventricular dysfunction (n = 4) in arbitrary optical units; *P = 0.01.
Myocardial insulin signalling in the mouse heart
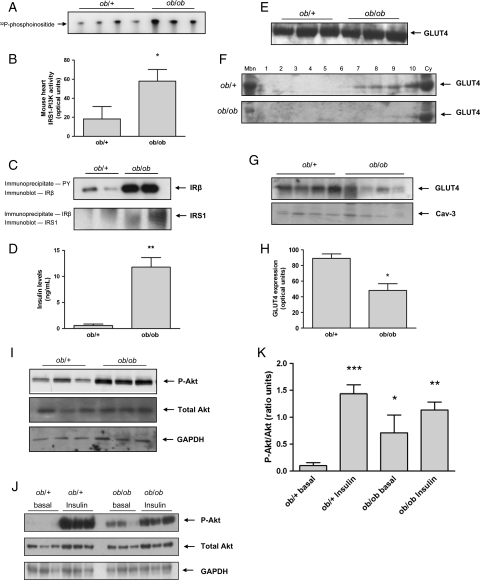
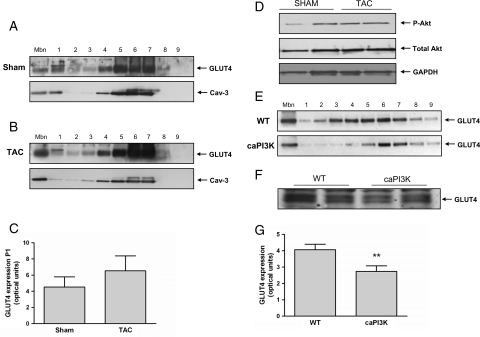
To investigate the increase in myocardial PI3K activity in patients with NIDDM, we examined myocardial IRS1-PI3K activity in the ob/ob mouse, a well-established model of insulin resistance and diabetes.7,11,21,22 In keeping with our human data, myocardial IRS1-PI3K activity was elevated (2.2-fold, P < 0.01) in ob/ob mice when compared with ob/+ controls (Figure 6A and B). Previous studies have suggested an increase in insulin receptor phosphorylation in the ob/ob mouse heart.11 We confirmed this observation (Figure 6C, upper panel) and extended our analyses to demonstrate a physical association of IRS1 with the insulin receptor (Figure 6C, lower panel). Insulin concentrations were measured after 6 h fasting and, as expected, insulin levels were significantly higher in ob/ob mice compared with controls (P = 0.001) (Figure 6D). Downstream of PI3K signalling we found that Akt was phosphorylated to a greater extent in the hearts of ob/ob mice when compared with ob/+ controls at basal levels and that the increase in phospho-Akt in response to insulin stimulation in the ob/ob mouse was attenuated when compared with control mice levels, whereas total Akt levels were unchanged (Figure 6I–K). As seen in humans, total cellular GLUT4 expression levels were similar between ob/ob hearts and ob/+ control hearts but GLUT4 was markedly diminished at the sarcolemma and across sub-cellular fractions in ob/ob hearts (Figure 6E–H). Finally, we examined GLUT4 expression at the sarcolemma in a mouse model of pressure overload-induced LVD. In this model, IRS1-PI3K was not activated (see Supplementary material online, Figure S3), and no changes in Akt phosphorylation were observed (Figure 7D) while GLUT4 levels at the sarcolemma showed a trend towards increase consistent with our human findings (Figure 7A–C).
Figure 6.
Myocardial IRS1-PI3K, Akt, and sarcolemmal GLUT4 in ob/ob mice. (A) Autoradiograph of in vitro kinase assay of IRS1-PI3K activity in the mouse heart. (B) Quantification of IRS1-PI3K activity in arbitrary optical units; (*P < 0.01). (C) Immunoblot of the insulin receptor beta (IR-β) subunit following phosphotyrosine immunoprecipitation (upper panel) and immunoblot of insulin receptor substrate-1 following IR-β immunoprecipitation (lower panel). (D) Fasting serum insulin levels of ob/+ and ob/ob mice (**P = 0.001). (E) Immunoblot of GLUT4 levels in total heart lysates from ob/+ and ob/ob mice. (F) Immunoblots of GLUT4 in the sarcolemmal fraction (Mbn), across subcellular fractions (1–10) and in the cytosol (cy) in ob/+ controls (upper panel) and ob/ob (lower panel) mice. (G) Immunoblot of GLUT4 levels at the sarcolemma and Caveolin-3 (Cav-3) loading control. (H) Quantification of GLUT4 levels at the sarcolemma in arbitrary optical units; ob/+ (n = 4), ob/ob (n = 4), *P < 0.01. (I) Representative immunoblots of myocardial phospho-Akt (top panel), total Akt (middle panel), and GAPDH (lower panel) expression in ob/+ and ob/ob mice. (J) Representative immunoblots of myocardial phospho-Akt (top panel), total Akt (middle panel), and GAPDH (lower panel) expression in ob/+ and ob/ob mice at basal state and after 30 min of insulin stimulation. (K) Quantification of phospho-Akt to total Akt ratio in ob/+ and ob/ob with and without insulin stimulation in ratio units. *P < 0.01 vs. ob/+ basal, **P < 0.001 vs. ob/+ basal, and ***P < 0.0001 vs. ob/+ basal.
Figure 7.
Glucose transporter 4 in mice with left-ventricular dysfunction or constitutively active phosphatidylinositol-3 kinase (caPI3K). (A) Representative immunoblots of GLUT4 in the sarcolemmal fraction (Mbn), across subcellular fractions (1–9) (upper panel) and of Cav-3 loading control (lower panel) in sham-operated mice. (B) Representative immunoblots of GLUT4 in the sarcolemmal fraction (Mbn), across subcellular fractions (1–9) (upper panel) and of Cav-3 loading control (lower panel) in transverse aortic constriction-induced left-ventricular dysfunction mice. The experiment was repeated three times with similar results. (C) Quantification of GLUT4 levels at the sarcolemma in arbitrary optical units; sham (n = 4) and transverse aortic constriction (n = 4). (D) Representative immunoblots of phospho-Akt, total Akt, and GAPDH (loading control) in transverse aortic constriction vs. controls (n = 3). (E) Representative immunoblots of GLUT4 in the sarcolemmal fraction (Mbn) and across subcellular fractions (1–9) in wild-type (WT, upper panel) and caPI3K (lower panel) mice. (F) Immunublot of GLUT4 levels in total cell lysates from control (WT) and caPI3K mice. (G) Quantification of GLUT4 levels at the sarcolemma in arbitrary optical units; wild-type (n = 3), caPI3K (n = 3), (*P < 0.01).
Effects of genetic perturbation of phosphatidylinositol-3 kinase on glucose transporter 4 expression in the mouse heart
To dissect experimentally the functional effects of elevated PI3K activity on GLUT4 expression in the heart, in the absence of potential confounding factors including effects of drugs, we studied mice with cardiac-specific expression of caPI3K.9 There was a significant reduction (P < 0.01) of GLUT4 at the sarcolemma and across subcellular fractions in caPI3K mice when compared with littermate controls with no difference in total cellular GLUT4 levels (Figure 7E–G).
Myocardial glucose transporter 4 trafficking and docking in the mouse heart
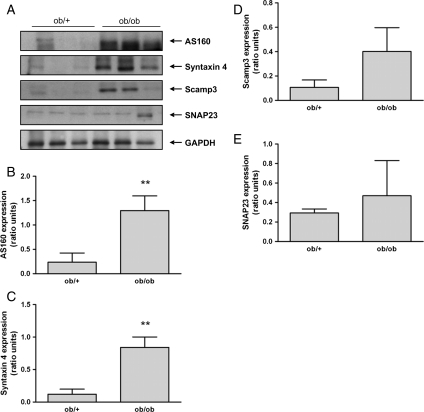
To investigate the underlying mechanism resulting in diminished GLUT4 expression at the sarcolemma in patients with NIDDM, we examined the major components of GLUT4 trafficking and docking in ob/ob mice (Figure 8A). As shown in Figure 8B–D, there was an increase in the expression of AS160, Syntaxin 4, and in Scamp3, although the latter failed to reach statistical significance. No changes were observed in SNAP23 (Figure 8E).
Figure 8.
Expression of proteins involved in glucose transporter 4 translocation and docking in ob/ob mice. (A) Representative immunoblots of AS160, Syntaxin 4, Scamp3, SNAP23, and GAPDH (loading control) in ob/ob mice vs. controls (n = 3). (B–E) Quantification of AS160, Syntaxin 4, Scamp3, and SNAP23 expression in ob/ob mice vs. controls in ratio units normalized to GAPDH; (**P = 0.001).
Discussion
The results of the present study provide some novel findings of the mechanisms underlying whole body and myocardial insulin resistance in patients with NIDDM or LVD. First, we demonstrate a previously unrecognized reduction of IRS1 in the skeletal muscle of LVD patients. Second, we found that in the myocardium of both NIDDM and LVD patients IRS1-PI3K activity was unexpectedly increased with a concomitant activation of the insulin receptor. Third, increased myocardial IRS1-PI3K activity was accompanied by a reduction of sarcolemmal GLUT4 in NIDDM, but not in LVD patients in whom sarcolemmal GLUT4 levels were increased. Fourth, comparative studies in mice confirmed activation of proximal insulin signalling and concurrent reduction in sarcolemmal GLUT4 in the heart of ob/ob mice and increased GLUT4 levels at the sarcolemma in a mouse model of LVD. Finally, we showed marked perturbation of AS160 and Syntaxin4 expression in the heart of ob/ob mice suggesting that the primary mechanism underlying myocardial insulin resistance in diabetes relates to GLUT4 vesicle dysfunction.
Cellular insulin resistance involves a combination of factors and disruption of more than one signalling module.6,7,23 In skeletal muscle, a consistent deficit in IRS1 phosphotyrosine levels has been observed.5,7 IRS1 is a critical point for the control of glucose uptake both in heart and skeletal muscle. This combined with the potential role of GLUT4 in myocardial insulin resistance,8,17,21,24 led us to hypothesize that the nodal points of insulin signalling might be disrupted, in a tissue- or disease-specific manner. Consistent with previous reports,2,25 patients with LVD and those with NIDDM had decreased whole body and myocardial glucose utilization during euglycaemic–hyperinsulinaemic clamp. Despite the differences in the aetiology of insulin resistance between the patient groups, we demonstrated a comparable reduction in IRS1 phosphotyrosine expression in the skeletal muscle of patients with NIDDM or LVD.
In this context, the observed increase in myocardial IRS1-PI3K, which correlated inversely with whole body glucose uptake, was unexpected. Diminished myocardial glucose uptake in the insulin resistant heart could not be accounted for by activation of myocardial PI3K per se. However, in subsequent experiments, we found that sarcolemmal GLUT4 was downregulated in patients with NIDDM, thus providing a mechanism for myocardial insulin resistance in this condition. To examine these findings further, we used the ob/ob mouse, which is among the best-characterized models of diabetic cardiomyopathy21,22,24 and exhibits myocardial insulin resistance.11 In the ob/ob mouse, we confirmed activation of the insulin receptor, IRS1-PI3K, and downregulation of sarcolemmal GLUT4 in the heart. Furthermore, in this model, we demonstrated that insulin-stimulated Akt activity is diminished in the ob/ob heart providing an additional mechanism for myocardial insulin resistance.
The mechanisms leading to differential activation of the insulin receptor in heart and skeletal muscle, at a given insulin concentration, remain to be elucidated. Our results differ in part from those of Mazumder et al.11 who, despite showing increased activation of the insulin receptor, found that downstream Akt phosphorylation was reduced. The differences between the two reports could be explained, at least in part, by the fact that in the study by Mazumder et al.11 Akt phosphorylation was measured in hearts that were perfused ex vivo in the working mode for 15 min.
We propose that both in patients and ob/ob mice compensatory hyperinsulinaemia activates the insulin receptor and PI3K in the heart without restoring insulin signalling in skeletal muscle.7 In support of this, we observed a significant positive correlation in patients between fasting insulin levels and myocardial IRS1-PI3K activity. Consistent with our hypothesis, hyperinsulinaemia has been demonstrated in patients with NIDDM, and also in patients with ischaemic and non-ischaemic heart failure.3,4 We suggest that activation of IRS1-PI3K in patients with NIDDM and LVD might contribute to the cardiac pathophysiology of these conditions9,26 and may explain, in part, the association of insulin resistance with elevated LV mass.21,27,28
Our findings in patients with LVD suggest a different mechanism of insulin resistance in the failing when compared with the diabetic heart. We observed a consistent increase in GLUT4 at the sarcolemma in patients and mice with LVD. The mechanisms leading to increased GLUT4 at the sarcolemma, but diminished insulin-stimulated glucose uptake in the failing heart, remain unclear. One explanation might be that GLUT4 re-distribution at baseline results in diminished levels of recruitable GLUT4 upon insulin stimulation. Alternatively, this could be due to elevated adrenergic signalling in the failing heart, which has been shown to affect some components of insulin signalling.29–31
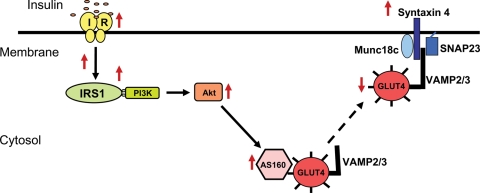
To investigate the mechanism underlying the decreased expression of GLUT4 at the sarcolemma in NIDDM, we examined the major components involved in GLUT4 trafficking and docking in ob/ob mice and found upregulation of AS160 and Syntaxin4. Recent studies in skeletal muscle have led to the hypothesis that the Rab-GAP protein AS160 acts as a point of convergence for different signals, including insulin, contractile activity, and energy status.32–36 Insulin-stimulated translocation of GLUT4 vesicle is mediated by a complex of proteins including Syntaxin4 and SNAP23.37 The increase in AS160 and Syntaxin4 expression suggests that the primary deficit underlying glucose uptake in the diabetic heart is due to GLUT4 vesicle dysfunction. Whether the changes we observed in vesicle proteins are primary or secondary requires further investigation (Figure 9).
Figure 9.
A potential model for the interaction of glucose transporter 4 containing vesicles with the fusion/docking machinery in the mouse diabetic heart. ↑for increased expression, ↓for decreased expression, and for translocation to the membrane.
There are some limitations to our study. The first is inherent in the study protocol: we compared glucose utilization measured during euglycaemic–hyperinsulinaemic clamp in vivo, with molecular analysis carried out ex vivo on samples obtained at the time of surgery. Also, different to our results previous studies of explanted heart samples from patients with end stage heart failure have shown activation of Akt.12,13 The reasons for this discrepancy are unknown, but could relate to differences in the severity and chronicity of ventricular dysfunction. The ob/ob mouse exhibits an extreme body habitus phenotype and may not be suited for some metabolic experiments although the data we present here, and other studies,11,21,22,24 show that this model has many of the cardinal features of human diabetic cardiomyopathy. Finally, it should be noted that the control subjects were affected by cardiovascular disease and this is an unavoidable limitation of this study and other similar studies of the human heart.
Conclusion
In patients with NIDDM and in diabetic mice, myocardial IRS1-PI3K and Akt are activated and there is diminished GLUT4 expression at the sarcolemma. In contrast, in patients with LVD, there is limited activation of IRS1-PI3K, but not of Akt, and GLUT4 is increased at the sarcolemma. This demonstrates disease-specific effects on insulin signalling and the sub-cellular distribution of GLUT4 in the diabetic and failing heart. Our data suggest that the primary deficit underlying myocardial insulin resistance in the diabetic heart occurs at the level of GLUT4 vesicle trafficking and docking although diminished insulin-stimulated Akt activity may be another contributory factor. Altogether our results provide new insights into diabetic cardiomyopathy and demonstrate disease-specific mechanisms of insulin resistance in the heart.
Supplementary material
Supplementary material is available at European Heart Journal online.
Funding
This work was primarily funded by the British Heart Foundation (PG/05/033; S.A.C., P.P., and P.G.C.; and PhD Studentship FS08/019/24776; C.K.). In addition, studies were supported by funding from the National Institute of Health (NIH HL HL077543; A.R.), the Medical Research Council, UK (S.A.C. and P.G.C.), the Department of Health, UK (S.A.C.), and by a Leducq Foundation Network of Research Excellence.
Conflict of interest: none declared.
Supplementary Material
References
- 1.Reaven GM. Banting lecture 1988. Role of insulin resistance in human disease. Diabetes. 1988;37:1595–1607. doi: 10.2337/diab.37.12.1595. [DOI] [PubMed] [Google Scholar]
- 2.Paternostro G, Camici PG, Lammerstma AA, Marinho N, Baliga RR, Kooner JS, Radda GK, Ferrannini E. Cardiac and skeletal muscle insulin resistance in patients with coronary heart disease - A study with positron emission tomography. J Clin Invest. 1996;98:2094–2099. doi: 10.1172/JCI119015. [DOI] [PMC free article] [PubMed] [Google Scholar]
- 3.Doehner W, Rauchhaus M, Ponikowski P, Godsland IF, von Haehling S, Okonko DO, Leyva F, Proudler AJ, Coats AJ, Anker SD. Impaired insulin sensitivity as an independent risk factor for mortality in patients with stable chronic heart failure. J Am Coll Cardiol. 2005;46:1019–1026. doi: 10.1016/j.jacc.2005.02.093. [DOI] [PubMed] [Google Scholar]
- 4.Ingelsson E, Sundstrom J, Arnlov J, Zethelius B, Lind L. Insulin resistance and risk of congestive heart failure. JAMA. 2005;294:334–341. doi: 10.1001/jama.294.3.334. [DOI] [PubMed] [Google Scholar]
- 5.Bjornholm M, Kawano Y, Lehtihet M, Zierath JR. Insulin receptor substrate-1 phosphorylation and phosphatidylinositol 3-kinase activity in skeletal muscle from NIDDM subjects after in vivo insulin stimulation. Diabetes. 1997;46:524–527. doi: 10.2337/diab.46.3.524. [DOI] [PubMed] [Google Scholar]
- 6.Shepherd PR, Kahn BB. Glucose transporters and insulin action–implications for insulin resistance and diabetes mellitus. N Engl J Med. 1999;341:248–257. doi: 10.1056/NEJM199907223410406. [DOI] [PubMed] [Google Scholar]
- 7.Biddinger SB, Kahn CR. From mice to men: insights into the insulin resistance syndromes. Annu Rev Physiol. 2006;68:123–158. doi: 10.1146/annurev.physiol.68.040104.124723. [DOI] [PubMed] [Google Scholar]
- 8.Dutka DP, Pitt M, Pagano D, Mongillo M, Gathercole D, Bonser RS, Camici PG. Myocardial glucose transport and utilization in patients with type 2 diabetes mellitus, left ventricular dysfunction, and coronary artery disease. J Am Coll Cardiol. 2006;48:2225–2231. doi: 10.1016/j.jacc.2006.06.078. [DOI] [PubMed] [Google Scholar]
- 9.Shioi T, Kang PM, Douglas PS, Hampe J, Yballe CM, Lawitts J, Cantley LC, Izumo S. The conserved phosphoinositide 3-kinase pathway determines heart size in mice. EMBO J. 2000;19:2537–2548. doi: 10.1093/emboj/19.11.2537. [DOI] [PMC free article] [PubMed] [Google Scholar]
- 10.Belke DD, Betuing S, Tuttle MJ, Graveleau C, Young ME, Pham M, Zhang D, Cooksey RC, McClain DA, Litwin SE, Taegtmeyer H, Severson D, Kahn CR, Abel ED. Insulin signaling coordinately regulates cardiac size, metabolism, and contractile protein isoform expression. J Clin Invest. 2002;109:629–639. doi: 10.1172/JCI13946. [DOI] [PMC free article] [PubMed] [Google Scholar]
- 11.Mazumder PK, O'Neill BT, Roberts MW, Buchanan J, Yun UJ, Cooksey RC, Boudina S, Abel ED. Impaired cardiac efficiency and increased fatty acid oxidation in insulin-resistant ob/ob mouse hearts. Diabetes. 2004;53:2366–2374. doi: 10.2337/diabetes.53.9.2366. [DOI] [PubMed] [Google Scholar]
- 12.Nagoshi T, Matsui T, Aoyama T, Leri A, Anversa P, Li L, Ogawa W, del Monte F, Gwathmey JK, Grazette L, Hemmings BA, Kass DA, Champion HC, Rosenzweig A. PI3K rescues the detrimental effects of chronic Akt activation in the heart during ischemia/reperfusion injury. J Clin Invest. 2005;115:2128–2138. doi: 10.1172/JCI23073. [DOI] [PMC free article] [PubMed] [Google Scholar]
- 13.Haq S, Choukroun G, Lim H, Tymitz KM, del Monte F, Gwathmey J, Grazette L, Michael A, Hajjar R, Force T, Molkentin JD. Differential activation of signal transduction pathways in human hearts with hypertrophy versus advanced heart failure. Circulation. 2001;103:670–677. doi: 10.1161/01.cir.103.5.670. [DOI] [PubMed] [Google Scholar]
- 14.Marinho NVS, Keogh BE, Costa DC, Lammerstma AA, Ell PJ, Camici PG. Pathophysiology of chronic left ventricular dysfunction - New insights from the measurement of absolute myocardial blood flow and glucose utilization. Circulation. 1996;93:737–744. doi: 10.1161/01.cir.93.4.737. [DOI] [PubMed] [Google Scholar]
- 15.Fath-Ordoubadi F, Beatt KJ, Spyrou N, Camici PG. Efficacy of coronary angioplasty for the treatment of hibernating myocardium. Heart. 1999;82:210–216. doi: 10.1136/hrt.82.2.210. [DOI] [PMC free article] [PubMed] [Google Scholar]
- 16.Hill JA, Karimi M, Kutschke W, Davisson RL, Zimmerman K, Wang Z, Kerber RE, Weiss RM. Cardiac hypertrophy is not a required compensatory response to short-term pressure overload. Circulation. 2000;101:2863–2869. doi: 10.1161/01.cir.101.24.2863. [DOI] [PubMed] [Google Scholar]
- 17.Matsui T, Nagoshi T, Hong EG, Luptak I, Hartil K, Li L, Gorovits N, Charron MJ, Kim JK, Tian R, Rosenzweig A. Effects of chronic Akt activation on glucose uptake in the heart. Am J Physiol Endocrinol Metab. 2006;290:E789–E797. doi: 10.1152/ajpendo.00564.2004. [DOI] [PubMed] [Google Scholar]
- 18.Cook SA, Sugden PH, Clerk A. Activation of c-Jun N-terminal kinases and p38-mitogen-activated protein kinases in human heart failure secondary to ischaemic heart disease. J Mol Cell Cardiol. 1999;31:1429–1434. doi: 10.1006/jmcc.1999.0979. [DOI] [PubMed] [Google Scholar]
- 19.Matsui T, Li L, del Monte F, Fukui Y, Franke TF, Hajjar RJ, Rosenzweig A. Adenoviral gene transfer of activated phosphatidylinositol 3’-kinase and Akt inhibits apoptosis of hypoxic cardiomyocytes in vitro. Circulation. 1999;100:2373–2379. doi: 10.1161/01.cir.100.23.2373. [DOI] [PubMed] [Google Scholar]
- 20.Goodyear LJ, Giorgino F, Sherman LA, Carey J, Smith RJ, Dohm GL. Insulin receptor phosphorylation, insulin receptor substrate-1 phosphorylation, and phosphatidylinositol 3-kinase activity are decreased in intact skeletal muscle strips from obese subjects. J Clin Invest. 1995;95:2195–2204. doi: 10.1172/JCI117909. [DOI] [PMC free article] [PubMed] [Google Scholar]
- 21.Hsueh W, Abel ED, Breslow JL, Maeda N, Davis RC, Fisher EA, Dansky H, McClain DA, McIndoe R, Wassef MK, Rabadan-Diehl C, Goldberg IJ. Recipes for creating animal models of diabetic cardiovascular disease. Circ Res. 2007;100:1415–1427. doi: 10.1161/01.RES.0000266449.37396.1f. [DOI] [PubMed] [Google Scholar]
- 22.Dong F, Zhang X, Yang X, Esberg LB, Yang H, Zhang Z, Culver B, Ren J. Impaired cardiac contractile function in ventricular myocytes from leptin-deficient ob/ob obese mice. J Endocrinol. 2006;188:25–36. doi: 10.1677/joe.1.06241. [DOI] [PubMed] [Google Scholar]
- 23.Shulman GI. Cellular mechanisms of insulin resistance. J Clin Invest. 2000;106:171–176. doi: 10.1172/JCI10583. [DOI] [PMC free article] [PubMed] [Google Scholar]
- 24.Boudina S, Abel ED. Diabetic cardiomyopathy revisited. Circulation. 2007;115:3213–3223. doi: 10.1161/CIRCULATIONAHA.106.679597. [DOI] [PubMed] [Google Scholar]
- 25.Iozzo P, Chareonthaitawee P, Rimoldi O, Betteridge DJ, Camici PG, Ferrannini E. Mismatch between insulin-mediated glucose uptake and blood flow in the heart of patients with Type II diabetes. Diabetologia. 2002;45:1404–1409. doi: 10.1007/s00125-002-0917-3. [DOI] [PubMed] [Google Scholar]
- 26.Okin PM, Devereux RB, Gerdts E, Snapinn SM, Harris KE, Jern S, Kjeldsen SE, Julius S, Edelman JM, Lindholm LH, Dahlof B. Impact of diabetes mellitus on regression of electrocardiographic left ventricular hypertrophy and the prediction of outcome during antihypertensive therapy: the Losartan Intervention For Endpoint (LIFE) Reduction in Hypertension Study. Circulation. 2006;113:1588–1596. doi: 10.1161/CIRCULATIONAHA.105.574822. [DOI] [PubMed] [Google Scholar]
- 27.Phillips RA, Krakoff LR, Dunaif A, Finegood DT, Gorlin R, Shimabukuro S. Relation among left ventricular mass, insulin resistance, and blood pressure in nonobese subjects. J Clin Endocrinol Metab. 1998;83:4284–4288. doi: 10.1210/jcem.83.12.5331. [DOI] [PubMed] [Google Scholar]
- 28.Rutter MK, Parise H, Benjamin EJ, Levy D, Larson MG, Meigs JB, Nesto RW, Wilson PW, Vasan RS. Impact of glucose intolerance and insulin resistance on cardiac structure and function: sex-related differences in the Framingham Heart Study. Circulation. 2003;107:448–454. doi: 10.1161/01.cir.0000045671.62860.98. [DOI] [PubMed] [Google Scholar]
- 29.Mongillo M, John AS, Leccisotti L, Pennell DJ, Camici PG. Myocardial pre-synaptic sympathetic function correlates with glucose uptake in the failing human heart. Eur J Nuclear Med Mol Imaging. 2007;34:1172–1177. doi: 10.1007/s00259-007-0371-z. [DOI] [PubMed] [Google Scholar]
- 30.He A, Liu X, Liu L, Chang Y, Fang F. How many signals impinge on GLUT4 activation by insulin? Cell Signal. 2007;19:1–7. doi: 10.1016/j.cellsig.2006.05.018. [DOI] [PubMed] [Google Scholar]
- 31.Morisco C, Condorelli G, Trimarco V, Bellis A, Marrone C, Condorelli G, Sadoshima J, Trimarco B. Akt mediates the cross-talk between beta-adrenergic and insulin receptors in neonatal cardiomyocytes. Circ Res. 2005;96:180–188. doi: 10.1161/01.RES.0000152968.71868.c3. [DOI] [PubMed] [Google Scholar]
- 32.Abel ED, Kaulbach HC, Tian R, Hopkins JC, Duffy J, Doetschman T, Minnemann T, Boers ME, Hadro E, Oberste-Berghaus C, Quist W, Lowell BB, Ingwall JS, Kahn BB. Cardiac hypertrophy with preserved contractile function after selective deletion of GLUT4 from the heart. J Clin Invest. 1999;104:1703–1714. doi: 10.1172/JCI7605. [DOI] [PMC free article] [PubMed] [Google Scholar]
- 33.Watson RT, Pessin JE. Subcellular compartmentalization and trafficking of the insulin-responsive glucose transporter, GLUT4. Exp Cell Res. 2001;271:75–83. doi: 10.1006/excr.2001.5375. [DOI] [PubMed] [Google Scholar]
- 34.Watson RT, Pessin JE. Bridging the GAP between insulin signaling and GLUT4 translocation. Trends Biochem Sci. 2006;31:215–222. doi: 10.1016/j.tibs.2006.02.007. [DOI] [PubMed] [Google Scholar]
- 35.Fazakerley DJ, Lawrence SP, Lizunov VA, Cushman SW, Holman GD. A common trafficking route for GLUT4 in cardiomyocytes in response to insulin, contraction and energy-status signalling. J Cell Sci. 2009;122:727–734. doi: 10.1242/jcs.041178. [DOI] [PMC free article] [PubMed] [Google Scholar]
- 36.Deshmukh AS, Hawley JA, Zierath JR. Exercise-induced phospho-proteins in skeletal muscle. Int J Obes (Lond) 2008;32(Suppl 4):S18–S23. doi: 10.1038/ijo.2008.118. [DOI] [PubMed] [Google Scholar]
- 37.Spurlin BA, Park SY, Nevins AK, Kim JK, Thurmond DC. Syntaxin 4 transgenic mice exhibit enhanced insulin-mediated glucose uptake in skeletal muscle. Diabetes. 2004;53:2223–2231. doi: 10.2337/diabetes.53.9.2223. [DOI] [PubMed] [Google Scholar]
Associated Data
This section collects any data citations, data availability statements, or supplementary materials included in this article.


