

Abstract
Haloalkane dehalogenase (HD) catalyzes the hydrolysis of haloalkanes via a covalent enzyme–substrate intermediate. Fusing a target protein to an HD variant that cannot hydrolyze the intermediate enables labeling of the target protein with a haloalkane in cellulo. The utility of extant probes is hampered, however, by background fluorescence as well as limited membrane permeability. Here, we report on the synthesis and use of a fluorogenic affinity label that, after unmasking by an intracellular esterase, labels an HD variant in cellulo. Labeling is rapid and specific, as expected from the reliance upon enzymic catalysts and the high membrane permeance of the probe both before and after unmasking. Most notably, even high concentrations of the fluorogenic affinity label cause minimal background fluorescence without a need to wash the cells. We envision that such fluorogenic affinity labels, which enlist catalysis by two cellular enzymes, will find utility in pulse–chase experiments, high-content screening, and numerous other protocols.
Introduction
The labeling of proteins with genetically encoded autofluorescent proteins has revolutionized cell imaging.1 These “tags” can reveal subcellular localization, dynamics, and chemical environment.2 Nonetheless, the utility of autofluorescent proteins has notable limitations, including the restriction of “one clone–one color” and an inability to label temporally disparate pools of protein by using a single genetic construct, thereby precluding pulse–chase as well as other types of experiments.
A recent development has overcome some limitations of autofluorescent proteins. Specifically, genetically encoded enzymic tags now enable the use of small-molecule fluorophores to label proteins in cellulo.3–6 A key advantage of these systems is their modularity. With a single genetic construct, a wide variety of substrate analogs, including fluorophores with disparate spectral properties,3 can be attached to a fusion protein of interest (i.e., one clone–many colors) at any time. In addition, this approach avails the high reactivity that has evolved within enzymic active sites. Second-order rate constants for enzyme-mediated labeling have been reported to be as high as 2.7 × 10⁶ M−1s−1,4 which exceeds by over a million-fold any rate constant reported for a chemoselective labeling reaction involving only small molecules (such as variations of the Huisgen 1,3-dipolar azide–alkyne cycloaddition or Staudinger ligation).5–7
Haloalkane dehalogenase (HD; EC 3.8.1.5) is perhaps the most often-used enzymic fusion tag. This enzyme catalyzes the hydrolysis of haloalkanes via a covalent enzyme–substrate intermediate that undergoes hydrolysis. An HD variant that cannot perform the second, hydrolysis step (HaloTag®) reacts rapidly and specifically to form a covalent adduct with a wide variety of chloroalkanes, including assorted fluorophores of varied spectral and physiochemical properties.8,4
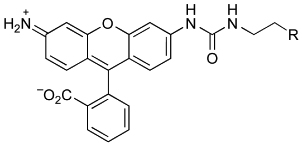
Still, problems remain with HD and other enzymic fusion tags. Background fluorescence from excess probe and the inefficient passage of small-molecule probes through cellular membranes are especially problematic, necessitating long incubation times or vigorous washing steps. We reasoned that a latent fluorophore based on the venerable trimethyl lock system9,10 could both diminish background fluorescence and enhance cellular delivery. Accordingly, we designed and synthesized probe 1 (Figure 1) as an affinity label for HD and tested its ability to label HD in living cells. The results are indicative of an advantageous means to label proteins in cellulo.
Figure 1.

Fluorogenic (1 and 2) and fluorescent (3) labels for haloalkane dehalogenase.
Results and discussion
Design and synthesis of probe 1
The design of probe 1 was based on previous work in which the trimethyl lock system was used to mask the intrinsic fluorescence or absorbance of a small molecule.11–19 The trimethyl lock moiety is stable to spontaneous hydrolysis, but susceptible to intracellular esterase-catalyzed hydrolysis. The use of a urea moiety rather than a second trimethyl lock allows for single-hit kinetics and the facile addition of reactive groups for bioconjugation.12 The trimethyl lock–urea system is modular, accommodating a variety of dyes and appendages for bioconjugation.11–19
We synthesized probe 1 by condensing two fragments: a fluorogenic substrate for a cellular esterase and a chloroalkane affinity label for HD (Scheme 1). Briefly, known t-Boc–rhodamine 412 was subjected to reaction with an in situ-generated isocyanate from protected succinate 520 to generate t-Boc–rhodamine–urea 6. Deprotection with trifluoroacetic acid furnished the urea–rhodamine 7 that underwent carbodiimide-mediated coupling with trimethyl lock acid 821 to give benzyl-protected 9. Removal of the benzyl group by catalytic hydrogenation at −5 °C22 afforded acid 10. Activation of the acid to the succimidyl ester, followed by reaction with alkyl chloride 11 gave the desired probe 1.
Scheme 1.

Synthesis of probe 1.
Cell imaging with probe 1
We compared the utility of probe 1 for live-cell imaging with that of known probes 2 (diAcFAM) and 3 (R110Direct™). In these experiments, we used a cell line, U2OS, that had been stably transfected to produce a nucleus-directed HD variant (HaloTag®–NLS3). The nuclear envelope is covered with pores that allow small molecules such as probes 1–3 to enter the nucleus by passive diffusion from the cytosol.23
We found that images of U2OS cells exposed to probes 1–3 differed significantly. Incubation of cells with probes 2 and 3 resulted in non-specific fluorescence after 15 min (Figure 2A). This unsolicited fluorescence was intracellular for 2 and extracellular for 3. In contrast, probe 1 showed remarkable specificity with virtually no background fluorescence. Additionally, imaging with 1 was strikingly rapid, as images had developed nearly fully after only 10 min (Figure 2B). Labeling with a ten-fold higher concentration of 1 retained specificity without a large increase in background fluorescence (Figure 2C).
Figure 2.

Labeling of an HD variant (HaloTag®–NLS3) in live, unwashed U2OS cells at 37 °C as visualized by confocal microscopy. Scale bars = 200 µm. (A) Effect of probe type. Probe (1.0 µM) was incubated with cells for 15 min; (i) 1, (ii) 2, (iii) 3, (iv, v, and vi) overlay with brightfield images. (B) Effect of incubation time. Probe 1 (1.0 µM) was incubated with cells for (i) 10 min, (ii) 15 min, and (iii) 30 min. (C) Effect of probe concentration. Probe 1 was incubated with cells for 15 min at (i) 1 µM, (ii) 10 µM, (iii and iv) overlay with brightfield images. (D) Effect of probe unmasking. Probe (1.0 µM) was incubated with cells for 15 min; (i) unmasked 1, (ii) unmasked 2, and (iii) 3.
We suspected that the variation in labeling between the fluorogenic affinity labels 1 and 2 is due to differing abilities of the masked and unmasked probes to cross the cell membrane. Although masked 1 and 2 have a net charge of Z = 0, unmasked 1 has Z = 0 whereas unmasked 2 has Z = −2. Cell images suggest that unmasked 2 that has not reacted with the HD variant becomes trapped in the cell, leading to intracellular background fluorescence (Figure 2Aii and v). Conversely, unmasked 1 that has not reacted with the HD variant can exude from the cell, leading to low background fluorescence.
The low background fluorescence observed with probe 1 could be attributed solely to the latency of its fluorescence. To address this issue, we treated probes 1 and 2 with porcine liver esterase prior to the no-wash labeling procedure. As anticipated from its net charge of Z = −2, unmasked 2 was largely membrane impermeant (Figure 2Dii). Remarkably, unmasked 1 (Figure 2Di) displayed much less intracellular and extracellular background fluorescence than did 3 (Figure 2Diii). These data demonstrate that the fluorescence-masking trimethyl lock moiety is not the singular determinant for preventing extracellular background fluorescence. Rather, the intrinsic cell-permeability of probe 1, in its masked and unmasked state, plays an important role.
Probe lipophilicity
To seek an explanation for the differences in probe internalization, we first calculated the value of logD24,25 for the predominant form of relevant labels at pH 7.4 (Table 1). Because increased lipophilicity generally correlates with increased membrane permeability,26 probes with higher logD values are expected to permeate the membrane more rapidly. The relatively low calculated logD value of unmasked 2 corresponds with its slower rate of internalization. There is, however, only a small difference between the calculated values of unmasked 1 and 3, even though cell-imaging experiments demonstrate that unmasked 1 is much more membrane permeant (Figure 2D).
Table 1.
Calculated values of logD for masked and unmasked probes at pH 7.4.
| Probe | logD |
|---|---|
| 1 | 4.82 |
| 2 | 3.93 |
| 3 | 2.37 |
 |
2.63 |
 |
0.12 |
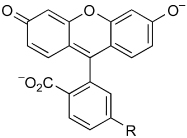
The inconsistency in the anticipated and demonstrated membrane permeability led us to hypothesize that the increased rate of internalization of unmasked 1 relative to 3 is due to perturbation of the lactone–quinoid equilibrium of the two rhodamine-based dyes12 (Figure 3). We reasoned that electron-withdrawal by the urea moiety shifts the equilibrium somewhat from the relatively membrane-impermeant quinoid (which is zwitterionic and hence polar) to the lactone.
Figure 3.

Lactone–quinoid equilibrium of 1, 12, and 13.
To investigate the propensity of rhodamine–urea dyes to form the lactone, we determined the effect of solvent dielectric constant (ε) on the lactone–quinoid equilibrium of unmasked 1 and related compounds 12 (rhodamine 110) and 13 (a rhodamine–urea).12 The ultraviolet–visible spectrum of the quinoid is characterized by a relative absorbance maximum at ~500 nm, which is absent in the spectrum of the lactone.27 The value of ε was varied by altering dioxane/water ratios.28 We found that formation of the less polar lactones of unmasked 1 and 13, which contain a urea moiety, is favorable in solutions of higher polarity than with compound 12 (Figure 4). We conclude that the increased rate of internalization of rhodamine–urea dyes is likely due to their increased propensity for lactone formation. This feature ameliorates the difficulty of cell-membrane penetration and lowers background fluorescence.
Figure 4.

Effect of dielectric constant on the lactone–quinoid equilibrium of unmasked 1, 12, and 13. Absorption spectra of (A) unmasked 1 (50 µM), (B) 12 (12.5 µM), and (C) 13 (12.5 µM) in mixtures of dioxane and water. (D) Absorption at λmax in the spectra in panels A–C. Values of ε are from ref. 28.
Recapitulation
Together, the data indicate that probe 3, which is always fluorescent, is not especially membrane-permeant and produces much extracellular, background fluorescence with our rapid-imaging protocol (Figure 2A, panels iii and vi). Although the acetyl groups of probe 2 mask its fluorescence, these groups are vulnerable to hydrolysis in cell-free medium and even PBS.12 At short time scales (i.e., minutes), the resultant unmasking is not a severe problem. The intracellular background is due to the anionic unmasked fluor that has not reacted with the HD protein but cannot exit the cell because of its membrane impermeance. Only probe 1 has the attributes necessary.
Conclusions
We have demonstrated that probe 1 is a useful cell-permeant affinity label for the facile, rapid labeling of target proteins in live cells. The omission of wash steps is particularly advantageous for the labeling of proteins in non-adherent cells, which are more tedious to separate from excess probe than are adherent cells. In addition, as probe 1 exhibits low background fluorescence, little effort is needed to determine a useful concentration. This attribute could be useful for the labeling of target proteins within a population of transiently transfected cells. The rapidity of cellular labeling with probe 1 enables interrogations with high temporal resolution. This attribute is particularly beneficial for pulse–chase experiments, which require differential labeling of temporally disparate pools of protein. Finally, we suspect that probe 1 will be useful in high-content screens, wherein wash steps, optimization of label concentration, and probe instability are especially problematic and costly. Accordingly, we envision that probe 1 and analogous fluorogenic affinity labels will be a useful addition to the armamentarium for the labeling of proteins in cellulo.
Experimental
Synthesis of 1
General
Amine 11 was a generous gift from the Promega Corporation (Madison, WI). Dimethylformamide (DMF), tetrahydrofuran (THF), and dichloromethane (CH2Cl2) were drawn from a Baker CYCLE-TAINER solvent delivery system. All other reagents were obtained from Sigma (Saint Louis, MO) or Fisher Scientific (Hanover Park, IL) and used without further purification.
Thin-layer chromatography was performed with aluminum-backed plates coated with silica gel containing F254 phosphor and visualized by UV illumination or staining with I2, ceric ammonium molybdate, or phosphomolybdic acid. Flash chromatography was performed by using open columns loaded with silica gel-60 (230–400 mesh), or on a FlashMaster Solo system (Argonaut, Redwood City, CA) with Isolute Flash Si II columns (International Sorbent Technology, Hengoed, Mid Glamorgan, UK). The term “concentrated under reduced pressure” refers to the removal of solvents and other volatile materials using a rotary evaporator at water-aspirator pressure (<20 mm Hg) while maintaining the water-bath temperature below 40 °C. The term “high vacuum” refers to vacuum achieved by a mechanical belt-drive oil pump.
NMR spectra were obtained with a Bruker DMX-400 Avance spectrometer at the National Magnetic Resonance Facility at Madison (NMRFAM). Mass spectrometry was performed with a Micromass LCT (electrospray ionization, ESI) mass spectrometer in the Mass Spectrometry Facility in the Department of Chemistry.
Synthesis of succinic acid monobenzyl ester (5)
Compound 5 was synthesized according to a published procedure.20 The white crystalline material afforded in the published procedure was dissolved in a minimal amount of 1:1 hexanes/EtOAc and cooled to 4 °C. Crystallization was initiated by the dropwise addition of hexane (~20 drops). The mixture was stored overnight at −20 °C. The crystals were isolated by filtration, washed with cold hexane (4 °C), and dried in the air. Residual solvent was removed under high vacuum to yield compound 5 as a white crystalline solid (3.44 g, 83%). 1H NMR (400 MHz, DMSO-d6) δ (ppm): 12.25 (s, 1H), 7.36 (m, 5H), 5.10 (s, 2H), 2.58 (m, 2H), 2.50 (m, 2H). 13C NMR (400 MHz, DMSO-d6) δ (ppm): 173.47, 172.10, 136.25, 128.45, 128.00, 127.84, 65.53, 28.78, 28.72. HRMS (ESI): [M+Na]+ calculated, 231.0628; found, 231.0635.
Synthesis of t-Boc–rhodamine–urea 6
Succinic acid monobenzyl ester (5; 193 mg, 0.929 mmol) was dissolved in anhydrous THF (2.0 mL) under Ar(g). Hünig’s base (DIEA; 202 µL, 1.16 mmol) was then added, followed by the dropwise addition of diphenyl phosphoryl azide (DPPA; 256 mg, 0.929 mmol). The solution was stirred for 6 h and subsequently heated at reflux for an additional 2 h. Then, known t-Boc–rhodamine 412 (100 mg, 0.232 mmol) was added, and the reaction mixture was stirred at reflux for 18 h. The reaction mixture was then partitioned between 5% v/v HCl(aq) and CH2Cl2. The organic extract was washed consecutively with 5% v/v HCl, water (3×), 5% w/v NaHCO3(aq) (2×), water (3×), and saturated brine, and dried over MgSO4(s). The solution was concentrated under reduced pressure, and the residue was purified by column chromatography (silica gel; first column: 5:3:2 hexanes/EtOAc/CH2Cl2→4:4:2 hexanes/EtOAc/CH2Cl2, second column: 0→2% v/v MeOH in CH2Cl2 containing AcOH (1% v/v), third column: 5:3:2 hexanes/EtOAc/CH2Cl2). Compound 6 was obtained as a pale yellow solid (137.2 mg, 93%). 1H NMR (400 MHz, CDCl3) δ (ppm): 7.99 (d, J = 7.0 Hz, 1H), 7.65-7.56 (m, 3H), 7.37-7.29 (m, 6H), 7.10 (s, 1H), 7.06 (m, 3H), 6.99 (d, J = 8.4 Hz, 1H), 6.66 (d, J = 8.6 Hz, 1H), 6.55 (d, J = 8.7 Hz, 1H), 6.00 (t, J = 5.6 Hz, 1H), 5.11 (s, 2H), 3.53 (dd, J = 11.5, 5.7 Hz, 2H), 2.62 (t, J = 6.1 Hz, 2H), 1.52 (s, 9H). 13C NMR (400 MHz, CDCl3) δ (ppm): 172.42, 170.12, 155.20, 152.59, 151.98, 151.82, 142.15, 141.21, 135.67, 135.25, 129.82, 128.57, 128.28, 128.18, 126.32, 125.29, 124.34, 115.40, 114.41, 112.91, 112.17, 106.34, 106.15, 81.17, 66.47, 35.71, 34.76, 28.33. HRMS (ESI): [M+H]+ calculated, 636.2341; found, 636.2341.
Synthesis of rhodamine–urea 7
t-Boc–rhodamine–urea 6 (54.0 mg, 0.0848 mmol) was dissolved in CH2Cl2 (2.0 mL). Trifluoroacetic acid (TFA, 400 µL) was added, and the reaction mixture was stirred at 0 °C for 2 h. The reaction mixture was then allowed to warm to ambient temperature and stirred for an additional 3 h. The solution was concentrated under reduced pressure, and residual TFA was removed by azeotropic distillation with toluene. The residue was then dissolved in a minimal amount of acetone and purified by column chromatography (silica gel, 5→10% v/v MeOH:CH2Cl2) to afford compound 7 as an orange crystalline solid (40 mg, 88%). 1H NMR (400 MHz, acetone-d6) δ (ppm): 8.34 (s, 1H), 7.97 (d, J = 7.6 Hz, 1H), 7.81-7.76 (m, 2H), 7.70 (t, J = 7.1 Hz, 1H), 7.39-7.25 (m, 6H), 6.92 (dd, J = 8.6, 2.2 Hz, 1H), 6.61 (d, J = 8.6 Hz, 1H), 6.58 (d, J = 2.1 Hz, 1H), 6.47 (d, J = 8.5 Hz, 1H), 6.42 (dd, J = 8.5, 2.1 Hz, 1H), 6.09 (br, 1H), 5.14 (m, 2H), 3.50 (q, J = 6.3 Hz, 2H), 2.63 (t, J = 6.5 Hz, 2H), 2.09 (s, 2H). HRMS (ESI): [M+H]+ calculated, 536.1822; found, 536.1816.
Synthesis of trimethyl lock–rhodamine–urea 9
Compound 7 (39.0 mg, 0.0728 mmol) was dissolved in 2.0 mL DMF and 2.0 mL pyridine. Trimethyl lock acid 821 (38.5 mg, 0.146 mmol) and 1-ethyl-3-(3-dimethylaminopropyl)carbodiimide (EDC; 28 mg, 0.146 mmol) were then added, and the reaction mixture was stirred overnight at ambient temperature. The solution was concentrated under reduced pressure, and the residue was dissolved in CH2Cl2 (200 mL). The resulting solution was washed consecutively with 5% v/v HCl(aq), water, saturated NaHCO3(aq), and saturated brine. The organic fraction was dried over Na2SO4(s). The residue was purified by column chromatography (silica gel, 4:6→5:5 hexanes/EtOAc) to give compound 9 as an orange solid (46 mg, 81%). 1H NMR (400 MHz, CDCl3) δ (ppm): 7.98 (d, J = 7.3 Hz, 1H), 7.66-7.56 (m, 3H), 7.38 (s, 1H), 7.32 (s, 5H), 7.20 (s, 1H), 7.06-7.02 (m, 3H), 6.80 (s, 1H), 6.67-6.61 (m, 2H), 6.57-6.53 (m, 2H), 5.74 (t, J = 5.7 Hz, 1H), 5.12 (s, 2H), 3.57-3.50 (m, 2H), 2.63-2.61 (m, 4H), 2.43 (s, 3H), 2.37 (s, 3H), 2.21 (s, 3H), 1.69-1.67 (m, 6H). 13C NMR (400 MHz, CDCl3) δ (ppm): 172.40, 171.96, 170.39, 170.24, 155.18, 153.15, 151.48, 149.97, 141.74, 139.91, 138.85, 137.18, 135.70, 135.31, 133.13, 132.96, 129.75, 128.55, 128.25, 128.13, 126.18, 124.90, 124.10, 123.42, 115.32, 114.93, 113.70, 111.65, 107.66, 106.22, 83.74, 66.38, 50.81, 40.25, 35.60, 34.77, 32.02, 25.53, 21.93, 20.16. HRMS (ESI): [M+H]+ calculated, 782.3073; found, 782.3062.
Synthesis of trimethyl lock–rhodamine–urea 10
Ethanol (10 mL) was added to compound 9 (35 mg, 0.045 mmol) and Pd/C (10% w/w, 14 mg) at −5 °C. The resulting mixture was stirred under an H2(g) atmosphere for 30 min. The reaction mixture was filtered through celite and washed consecutively with CH2Cl2 and EtOH. The washings were combined and concentrated under reduced pressure. The residue was then adsorbed onto celite and purified by column chromatography (silica gel, 0→10% v/v MeOH in CH2Cl2 containing 1% v/v AcOH) to afford compound 10 as a pale-yellow solid (26 mg, 84%). 1H NMR (400 MHz, CDCl3) δ (ppm): 8.00-7.90 (m, 2H), 7.84 (s, 1H), 7.59-7.49 (m, 2H), 7.34 (s, 1H), 7.22 (s, 1H), 6.95 (d, J = 7.3 Hz, 1H), 6.81 (d, J = 7.2 Hz, 1H), 6.74 (s, 1H), 6.64-6.55 (m, 2H), 6.53-6.42 (m, 2H), 6.10 (b, 1H), 3.39 (s, 2H), 2.62 (s, 2H), 2.46 (s, 2H), 2.39 (s, 3H), 2.32 (s, 3H), 2.16 (s, 3H), 1.63 (s, 6H). 13C NMR (400 MHz, CDCl3) δ (ppm): 176.38, 171.97, 170.60, 170.04, 155.88, 152.83, 151.52, 151.48, 149.89, 141.58, 139.74, 138.76, 137.08, 135.31, 133.03, 132.93, 129.77, 128.00, 126.17, 124.87, 124.03, 123.35, 115.45, 114.93, 113.94, 111.88, 107.83, 106.40, 83.66, 50.65, 40.17, 35.53, 34.76, 32.00, 25.48, 21.88, 20.12. HRMS (ESI): [M+Na]+ calculated, 714.2422; found, 714.2396.
Synthesis of probe 1
Compound 10 (26 mg, 0.038 mmol) was dissolved in DMF (1.0 mL) and pyridine (1.0 mL each). EDC (22 mg, 0.113 mmol) was added, and the resulting mixture was stirred for 1 h. N-Hydroxysuccinimide (NHS; 13 mg, 0.113 mmol) was then added, and the reaction mixture was stirred for 36 h under Ar(g). The solution was concentrated under reduced pressure, and the residue was partitioned between 10% w/v citric acid(aq) and CH2Cl2. The layers were separated, and the aqueous layer was extracted with CH2Cl2. The organic extracts were combined, washed consecutively with water and saturated brine, and dried over Na2SO4(s) to give the crude succinimide intermediate as a pale-yellow solid (35 mg). This intermediate (35 mg) was then dissolved in 2.0 mL of 9:1 DMF/DIEA. Amine 11 (10 mg, 0.044) was added, and the reaction mixture was stirred under Ar(g) for 72 h. The solution was concentrated under reduced pressure, and the residue was partitioned between EtOAc and 6% v/v HCl(aq). The layers were separated, and the aqueous phase was extracted with EtOAc. The organic extracts were combined, washed consecutively with water and saturated brine, and dried over Na2SO4(s). Probe 1 was isolated by column chromatography (silica gel; first column: 5:3:2 hexanes/EtOAc/CH2Cl2, second column: 2% v/v MeOH in CH2Cl2) as an off-white solid (12.5 mg, 32%). 1H NMR (400 MHz, CDCl3) δ (ppm): 7.98 (d, J = 6.5 Hz, 1H), 7.87 (s, 1H), 7.60 (dt, J = 4.3, 1.4 Hz, 2H), 7.46 (s, 1H), 7.39 (dd, J = 10.3, 2.2 Hz, 2H), 7.09 (d, J = 7.3 Hz, 1H), 6.97 (dd, J = 8.6, 2.2 Hz, 1H), 6.79 (s, 1H), 6.62-6.52 (m, 4H), 6.17 (br, 1H), 5.80 (br, 1H), 3.62 (s, 4H), 3.53-3.45 (m, 10H), 2.56 (m, 2H), 2.42 (m, 5H), 2.38 (s, 3H), 2.23 (s, 3H), 1.75-1.64 (m, 8H), 1.63-1.54 (m, 2H), 1.46-1.26 (m, 4H). HRMS (ESI): [M+Na]+ calculated, 919.3656; found, 919.3617.
Cell imaging
General
Probe 2 and U2OS cells were generous gifts from Promega. Probe 3 was from Promega. Rhodamine 110 was from Sigma–Aldrich. Cell-culture medium was from Invitrogen or Hyclone (Fisher Scientific). Dulbecco’s phosphate-buffered saline (PBS) and fetal bovine serum were from Invitrogen. Porcine liver esterase, MW ~163 kDa, as a suspension in 3.2 M (NH4)2SO4 was from Sigma Chemical (product number E2884). For labeling experiments, fluorogenic and fluorescent probes were stored as stock concentrations in DMSO and diluted such that DMSO concentration did not exceed 1%. Absorbance measurements were recorded at ambient temperature (23 ± 2 °C) in 1-cm path-length cuvettes on a Cary model 50 spectrometer from Varian.
Cell Preparation
U2OS cells (ATCC HTB-96TM) were plated on glass-bottom culture dishes (35 × 10 mm; Electron Microscopy Sciences) and grown to 60–90% confluence at 37 °C in McCoy’s 5A modified media containing FBS (10% v/v). Prior to the addition of probes, the medium was replaced with phenol red-free McCoy’s 5A medium (800 µL) that had been incubated at 37 °C. Probes were dissolved at a 5× working concentration in phenol red-free medium (200 µL) that had been incubated at 37 °C. For the experiments with unmasked probes (Figure 2D), porcine liver esterase (10 µL, 1.66 U/µL) was then added, and the resulting medium was incubated at room temperature for 3½ h. The probe-containing medium was added to the cell-containing medium, and the resulting medium was incubated at 37 °C. Cells were visualized by confocal microscopy after 10, 15, or 30 min.
Microscopy
Images of cells were obtained with a Nikon Eclipse TE2000-U confocal microscope equipped with a Zeiss AxioCam digital camera. Excitation at 488 nm was provided by an argon-ion laser, and emission light was passed through a filter centered at 515 nm and having a 40-nm band-pass. Brightfield images indicated that the cells were alive and appeared to have normal physiology, both before and after imaging.
Ultraviolet–visible spectroscopy
For each measurement, a probe was initially added to 20 µL PBS. To unmask the fluorescence of 1, porcine liver esterase (3.0 µL, 1.66 U/µL) was added, and the solution was left at ambient temperature for 4 h. Then, varying ratios of water and dioxane were added to a final volume of 200 µL, and absorbance was measured from 400–600 nm.
Calculation of logD
The parameter logD refers to the ratio of concentration of all probe microspecies (including both ionized and neutral forms) in octanol to that in water, according to eq 1:24,25
| (1) |
Values of logD were calculated with ACD/PhysChem Suite, version 12.29 Parameters of fluorescein (pKa 6.3230; logD −0.9931) and rhodamine 110 (logD 0.832) were entered into the software training database.
Supplementary Material
Acknowledgements
We are grateful to the Promega Corporation for gifts of compounds 2 and 11, and U2OS cells. This work was supported by grant CA073808 (NIH). R.W.W. was supported by an NSF Graduate Research Fellowship and by Chemistry–Biology Interface Training Grant GM008505 (NIH). L.D.L was supported by an ACS Division of Organic Chemistry Fellowship sponsored by the Genentech Foundation and by Biotechnology Training Grant GM008349 (NIH). V.M.K. was supported by a Barry M. Goldwater Scholarship and a Hilldale Undergraduate/Faculty Research Fellowship. NMRFAM was supported by grant P41RR02301 (NIH).
Footnotes
Supporting Information
1H and 13C NMR spectra.
References
- 1.Teodori L, Bushnell T, Campanella L, Tárnok A. Cytometry. 2008;73A:1109–1110. doi: 10.1002/cyto.a.20673. [DOI] [PubMed] [Google Scholar]
- 2.Chalfie M, Kain SR, editors. Green Fluorescent Protein: Properties, Applications, and Protocols. 2nd ed. Hoboken, NJ: John Wiley & Sons; 2006. [Google Scholar]
- 3.Lavis LD, Raines RT. ACS Chem. Biol. 2008;3:142–155. doi: 10.1021/cb700248m. [DOI] [PMC free article] [PubMed] [Google Scholar]
- 4.Los GV, Encell LP, McDougall MG, Hartzell DD, Karassina N, Zimprich C, Wood MG, Learish R, Ohana RF, Urh M, Simpson D, Mendez J, Zimmerman K, Otto P, Vidugiris G, Zhu J, Darzins A, Klaubert DH, Bulleit RF, Wood KV. ACS Chem. Biol. 2008;3:373–382. doi: 10.1021/cb800025k. [DOI] [PubMed] [Google Scholar]
- 5.Agard NJ, Baskin JM, Prescher JA, Lo A, Bertozzi CR. ACS Chem. Biol. 2006;1:644–648. doi: 10.1021/cb6003228. [DOI] [PubMed] [Google Scholar]
- 6.Soellner MB, Nilsson BL, Raines RT. J. Am. Chem. Soc. 2006;128:8820–8828. doi: 10.1021/ja060484k. [DOI] [PubMed] [Google Scholar]
- 7.Ning X, Guo J, Wolfert MA, Boons G-J. Angew. Chem. Int. Ed. 2008;47:2253–2255. doi: 10.1002/anie.200705456. [DOI] [PMC free article] [PubMed] [Google Scholar]
- 8.Los GV, Wood K. Methods Mol. Biol. 2007;356:195–208. doi: 10.1385/1-59745-217-3:195. [DOI] [PubMed] [Google Scholar]
- 9.Milstein S, Cohen LA. J. Am. Chem. Soc. 1972;94:9158–9165. doi: 10.1021/ja00781a029. [DOI] [PubMed] [Google Scholar]
- 10.Borchardt RT, Cohen LA. J. Am. Chem. Soc. 1972;94:9166–9174. doi: 10.1021/ja00781a030. [DOI] [PubMed] [Google Scholar]
- 11.Chandran SS, Dickson KA, Raines RT. J. Am. Chem. Soc. 2005;127:1652–1653. doi: 10.1021/ja043736v. [DOI] [PubMed] [Google Scholar]
- 12.Lavis LD, Chao T-Y, Raines RT. ACS Chem. Biol. 2006;1:252–260. doi: 10.1021/cb600132m. [DOI] [PMC free article] [PubMed] [Google Scholar]
- 13.Huang ST, Lin YL. Org. Lett. 2006;8:265–268. doi: 10.1021/ol052635e. [DOI] [PubMed] [Google Scholar]
- 14.Lavis LD, Chao T-Y, Raines RT. ChemBioChem. 2006;7:1151–1154. doi: 10.1002/cbic.200500559. [DOI] [PMC free article] [PubMed] [Google Scholar]
- 15.Johnson RJ, Chao T-Y, Lavis LD, Raines RT. Biochemistry. 2007;46:10308–10316. doi: 10.1021/bi700857u. [DOI] [PMC free article] [PubMed] [Google Scholar]
- 16.Levine MN, Lavis LD, Raines RT. Molecules. 2008;13:204–211. doi: 10.3390/molecules13020204. [DOI] [PMC free article] [PubMed] [Google Scholar]
- 17.Mangold SL, Carpenter RT, Kiessling LL. Org. Lett. 2008;10:2997–3000. doi: 10.1021/ol800932w. [DOI] [PMC free article] [PubMed] [Google Scholar]
- 18.Yatzeck MM, Lavis LD, Chao TY, Chandran SS, Raines RT. Bioorg. Med. Chem. Lett. 2008;18:5864–5866. doi: 10.1016/j.bmcl.2008.06.015. [DOI] [PMC free article] [PubMed] [Google Scholar]
- 19.Turcotte RF, Lavis LD, Raines RT. FEBS J. 2009;276:4270–4281. doi: 10.1111/j.1742-4658.2009.07098.x. [DOI] [PMC free article] [PubMed] [Google Scholar]
- 20.Winkler J, Urban E, Losert D, Wacheck V, Pehamberger H, Noe CR. Nucleic Acids Res. 2004;32:710–718. doi: 10.1093/nar/gkh229. [DOI] [PMC free article] [PubMed] [Google Scholar]
- 21.Amsberry KL, Borchardt RT. J. Org. Chem. 1990;55:5867–5877. [Google Scholar]
- 22.Zaikova TO, Rukavishnikov AV, Birrell GB, Griffith OH, Keana JFW. Bioconjug. Chem. 2001;12:307–313. doi: 10.1021/bc0001138. [DOI] [PubMed] [Google Scholar]
- 23.Monnè L. Proc. Soc. Exp. Biol. Med. 1935;32:1197–1199. [Google Scholar]
- 24.van de Waterbeemd H, Testa B. Adv. Drug Res. 1987;16:85–225. [Google Scholar]
- 25.van de Waterbeemd H. In: Drug Bioavailability: Estimation of Solubility, Permeability, Absorption, and Bioavailability. 2nd ed. van de Waterbeemd H, Lennernas H, Arturrson P, editors. Weinheim, Germany: Wiley–VHC; 2009. pp. 71–100. [Google Scholar]
- 26.Camenisch G, Alsenz J, van de Waterbeemd H, Folkers G. Eur. J. Pharm. Sci. 1998;6:313–319. [PubMed] [Google Scholar]
- 27.Ioffe IS, Otten VF. Zh. Obshch. Khim. 1965;1:333–336. [Google Scholar]
- 28.Kuila K SC, Lahiri Z. Phys. Chem. 2004;218:803–828. [Google Scholar]
- 29. [Accessed: 29 April 2009]; www.acdlabs.com/physchemsuite.
- 30.Goldberg JM, Baldwin RL. Biochemistry. 1998;37:2546–2555. doi: 10.1021/bi972402y. [DOI] [PubMed] [Google Scholar]
- 31.Cheruvu NP, Kompella UB. Invest. Ophthalmol. Vis. Sci. 2006;49:333–341. doi: 10.1167/iovs.07-0214. [DOI] [PMC free article] [PubMed] [Google Scholar]
- 32.Lampidis TJ, Castello C, del Giglio A, Pressman BC, Viallet P, Trevorrow KW, Valet GK, Tapiero H, Savaraj N. Biochem. Pharmacol. 1989;38 doi: 10.1016/0006-2952(89)90525-x. 4267-2471. [DOI] [PubMed] [Google Scholar]
Associated Data
This section collects any data citations, data availability statements, or supplementary materials included in this article.