

Abstract
Key cellular processes such as cell division, membrane compartmentalization, and intracellular transport rely on motor proteins. Motors have been studied in detail on the single motor level such that information on their step size, stall force, average run length, and processivity are well known. However, in vivo, motors often work together, so that the question of their collective coordination has raised great interest. Here, we specifically attach motors to giant vesicles and examine collective motor dynamics during membrane tube formation. Image correlation spectroscopy reveals directed motion as processive motors walk at typical speeds (≤500 nm/s) along an underlying microtubule and accumulate at the tip of the growing membrane tube. In contrast, nonprocessive motors exhibit purely diffusive behavior, decorating the entire length of a microtubule lattice with diffusion constants at least 1000 times smaller than a freely-diffusing lipid-motor complex in a lipid bilayer (1 μm2/s); fluorescence recovery after photobleaching experiments confirm the presence of the slower-moving motor population at the microtubule-membrane tube interface. We suggest that nonprocessive motors dynamically bind and unbind to maintain a continuous interaction with the microtubule. This dynamic and continuous interaction is likely necessary for nonprocessive motors to mediate bidirectional membrane tube dynamics reported previously.
Introduction
The emergent collective behavior of motor proteins plays an important role in intracellular transport. Processive kinesin motors, motors that take many steps along a microtubule (MT) before dissociating, collectively generate enough force to extract membrane tubes from membrane compartments in vitro (1–3). Surprisingly, nonprocessive nonclaret disjunctional (Ncd) motors, which only take a single step before dissociating from a MT, can also extract membrane tubes where tubes show distinct phases of persistent growth, retraction, and an intermediate regime characterized by dynamic switching between the two (4).
To understand the dynamics of nonprocessive motors as they mediate membrane tube movement, we investigate the general mobility of these motors at the MT-membrane tube interface. We use a minimal in vitro model system where motors are specifically attached to a fluorescently labeled lipid on giant unilamellar vesicles (GUVs) to directly probe motor dynamics during membrane tube formation. We examine both processive and nonprocessive motors as they collectively extract membrane tubes from the GUV. Because processive motors walk unidirectionally on MTs at effectively constant speeds, we expect their behavior to show characteristics of a system with directed motion. Because nonprocessive motors, though also unidirectional, only take a single step and then unbind from the MT, their dynamics are likely to appear diffusive. We adapt fluorescence image correlation spectroscopy (5) for temporal analysis and, along with fluorescence recovery after photobleaching (FRAP) (6–8), extract information about dynamic properties of the motors as they drive membrane tube dynamics. In contrast to previous experiments where GUVs were coated with ≈3000 motors/μm2 (4), the number of motors on the GUVs here is reduced dramatically to ≈125 motors/μm2 (comparable to (2)). This reduction in motor density allows for adequate ICS and FRAP analysis. However, fewer nonprocessive motors result in much slower membrane tube dynamics: nonprocessive motors form networks on the scale of hours whereas previously at high motor densities the networks formed in tens of minutes (4).
Our key findings are that nonprocessive motors interacting with the MT distribute themselves over the entire length of the membrane tube whereas processive motors accumulate at the tip of the tube. Processive motors walk along the MT toward the tip and exhibit a signature of directed motion at typical motor walking speeds, ≤500 nm/s. In contrast, nonprocessive motors at the MT-membrane tube interface show purely diffusive behavior with diffusion constants 10−3 times smaller than motors freely diffusing in a membrane tube (1 μm2/s). We interpret the small diffusion constant as an indicator that motors continuously disconnect and reconnect the membrane tube to the MT. Based on a previously proposed model (4), a dynamic but continuous connection between the membrane tube and the MT is essential for nonprocessive motors to drive membrane tube movement.
Materials and Methods
GUVs
1,2,-Dioleoyl-sn-glycero-3-phosphocoline (DOPC) was purchased from Avanti Polar Lipids (Alabaster, AL) and rhodamine-labeled biotinylated phosphatidylethanolamine (Rh-B-DSPE) was supplied by L. Bourel-Bonnet of Jolimâitre et al. (9). For fluorescence correlation spectroscopy experiments, a lipid composition of 99.9 mol % DOPC with 0.1 mol % Rh-B-DSPE was used to bind ≈125 motors/μm2; for FRAP experiments, 99.7 mol % DOPC with 0.3 mol % Rh-B-DSPE was used to bind ≈375 motors/μm2. GUVs were formed using the electroformation method. Ten microliters of a 2 mM lipid mixture in 1:10 methanol/chloroform were dropped onto one of two indium tin oxide-coated glass slides (4 cm × 6 cm). The lipids were distributed on the glass by the rock-and-roll method (10) and dried for 1 h under continuous nitrogen flow. A 300-μL volume chamber was constructed from the two glass plates, the dried lipids on the bottom glass, and a polydimethylsiloxane spacer. The chamber was filled with a solution of 200 mM sucrose and an AC voltage applied to the glass plates, forming GUVs by the electroformation method (10).
Microtubules and motor proteins
Microtubules (MTs) were prepared from tubulin purchased from Cytoskeleton (Denver, CO). Tubulin (10 mg/mL) in MRB40 (40 mM PIPES/4 mM MgCl2/1 mM EGTA, pH 6.8) with 1 mM GTP was incubated for 15 min at 37°C to polymerize. MTs were stabilized by mixing them 1:10 (vol/vol) with MRB40 containing 10 μM taxol (MRB40tax). The first 401 residues of the Kinesin-1 heavy-chain from Drosophila melanogaster, with a hemagglutinin tag and a biotin at the N-terminus, were expressed in Escherichia coli and purified as described (11). Residues K195–K685 of the Ncd motor from Drosophila melanogaster, with a 6×-His tag (12) and biotin, were expressed and purified in the same fashion, but with lower induction conditions, using 10 μM isopropyl β-D-1-thiogalactopyranoside. Motors were further purified by MT affinity purification. Their ATP activity was verified by an ATPase assay, and the motors were tested for MT gliding activity bound to a glass surface via their biotin tag. Kinesins exhibited speeds from 450 to 500 nm/s in MT gliding assays (13,14). Ncd speeds ranged from 16 nm/s to 120 nm/s, depending on the surface density of motors (4).
Tube-pulling assay
Glass coverslips were cleaned by sonication in KOH and further charged with DETA (Sigma Aldrich, St. Louis, MO), a peptide similar to poly-l-lysine, as described (15). A glass cover slide and the DETA-treated coverslip were used to make a 15 μL flow cell. Taxol stabilized MTs incubated in the flow cell for 10 min to adhere to the surface. MTs that did not stick to the surface were removed by rinsing the flow cell twice with MRB40tax. Casein Sodium Salt (Sigma Aldrich) (200 μg/mL) in MRB40tax was incubated in the flow cell for 8 min to block the remaining surface and minimize interaction of GUVs with exposed glass. The flow cell was subsequently rinsed with MRB40tax.
In parallel, GUVs were mixed 1:1 in MRB40tax with 180 mM glucose to osmotically match the intravesicular osmolarity (Halbmikro Osmometer, Type M; Knauer, Berlin, Germany). One microliter of 2 mg/mL streptavidin was added to 30 μL of the vesicle solution and incubated for 10 min. Next, 1 μL of 2 μM motor was added and incubated for 10 min. Finally, 0.5 μL Oxygen Scavenger (8 mM DTT/0.4 mg/mL catalase/0.8 mg/mL glucose oxidase) and 1 μL of 100 mM ATP were added to the vesicle solution. Fifteen microliters of the vesicle solution was slowly pipetted with a cutoff pipette tip into the flow cell. GUVs were then examined under the microscope and membrane tubes were extracted from the vesicles.
For FRAP experiments, we also examined membrane tubes that were not formed by motor proteins. These membrane tubes were formed by flow (16) where a small part of the vesicle is anchored to the coverslip, and the rest of the vesicle moves with flow of buffer through the sample chamber, creating a membrane tube. Tubes formed by flow were easily distinguishable from tubes formed by motors because the tubes were only attached to the sample surface at their tips. These tubes were used in FRAP experiments to determine the dynamics of motors where all motors were freely diffusing in the membrane tube. They were bleached only in the middle region, because motor dynamics in the tip region are likely influenced by the interaction with the coverslip where the tube is anchored.
Image acquisition and analysis
Images for fluorescence correlation data were acquired on a spinning disk microscope comprised of a confocal scanner unit (CSU22; Yokogawa Electric, Tokyo, Japan) attached to an inverted microscope (DMIRB; Leica, Wetzlar, Germany) equipped with a 100×/1.3 NA oil immersion lens (PL FLUOTAR; Leica) and a built-in 1.5× magnification changer lens. The sample was illuminated using a 514-nm laser (Coherent Laser, Santa Clara, CA). Images were captured by an electron-multiplying charge-coupled device (C9100; Hamamatsu Photonics, Iwata-City, Japan) controlled by software from VisiTech International (Sunderland, United Kingdom). Images were acquired with a 100-ms exposure at 10 Hz.
Fluorescence recovery after photobleaching data was acquired on a wide-field fluorescence microscope setup. An oil immersion objective (100×, NA =1.4; Carl Zeiss, Oberkochen, Germany) was mounted onto a piezo-driven actuator (PIFOC, Physik Instrumente; Karlsruhe, Germany) on an inverted microscope (Axiovert200; Carl Zeiss). Images were projected onto a charge-coupled device camera (Cascade 512B; Roper Scientific, Tucson, AZ). A dichroic mirror and an emission filter (z514rdc and D705/40m; Chroma Technology, Rockingham, VT) were used to discriminate the fluorescence emission from the excitation. The excitation beam was generated with an argon-ion laser (Coherent Laser) coupled to a fiber to generate a clean Gaussian beam. After the fiber, a positive lens was used to focus the beam onto the back-focal plane of the objective. An intense bleach pulse was implemented by placing this lens onto a piezo stage (250-μm range, Physik Instrumente; PIHera, Karlsruhe, Germany), which was used to quickly move the lens along the optical axis, generating a tight laser beam of ≈1.2 μm to bleach a small circular area in the sample. After bleaching, the piezo was moved back to the original position (Δt = 20 μs) to image fluorescence recovery. Images were acquired at 10 Hz.
Results
We investigate collective motor behavior during membrane tube formation with a minimal system where biotinylated motor proteins are linked directly via streptavidin to a small fraction of Rhodamine-labeled biotinylated lipids in GUVs (9). GUVs are allowed to sediment to a surface coated with taxol-stabilized MTs and, after the addition of ATP, motors extract membrane tubes from the GUVs.
The images in Fig. 1, a and d, show sums of all the frames in a movie of active membrane tube networks formed by nonprocessive Ncd (Fig. 1 a) and processive kinesin (Fig. 1 d) motors. The tube networks follow the turns and bends of the randomly oriented and crossing MT network on the surface indicating that motors actively form the networks by walking on MTs. These networks are formed on the scale of minutes by processive motors (as in (2)), and on the scale of hours by nonprocessive motors. Because Ncds have an ATP turnover rate (and hence walking speed) ≈100× slower than kinesins (17,18), the differences in timescales for the formation of tube networks are to be expected. Individual images in the movie are illuminated for 100 ms, and acquired at 10 Hz. A single pixel-width line extends along the length of the membrane tube (dashed line) and we observe the fluorescence fluctuations in time along this line. The resulting kymograph shows the time evolution of the fluorescence profile of this line along the tube (Fig. 1 b, nonprocessive; Fig. 1 e, processive). Processive motors consistently move toward the tip of the membrane tube. The processive motors in Fig. 1 d walk at typical speeds (≈400 nm/s) along the underlying MT and accumulate at the tip of the more slowly growing membrane tube (≈50 nm/s). The accumulation occurs because motors at the tip have to work against tension in the membrane tube and are slowed whereas motors in the rest of the tube may walk freely through a lipid bilayer and are only slowed as clusters grow large enough so that motors impede each other's paths (2). Nonprocessive motors, however, decorate the entire length of the microtubule lattice. Nonprocessive motors along the membrane tube do not show any directed motion, nor is there any emergent pattern. However, we can see there are motor dynamics indicated by fluorescence fluctuations (above the background noise shown in shaded representation in Fig. 1 c) shown in the fluorescence intensity profile at the tip of the tube in the solid line of Fig. 1 c.
Figure 1.
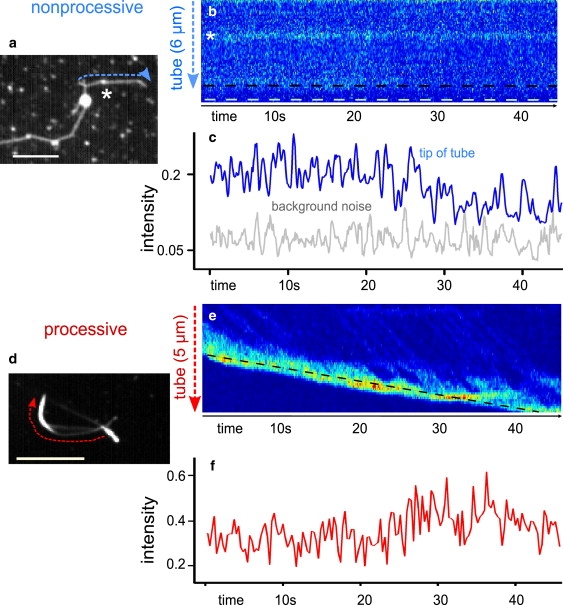
Motor activity in membrane tubes. (a) Sum of images in a movie of a membrane tube network formed by nonprocessive (Ncd) motors. The star indicates an additional small vesicle bound to the same MT as the membrane tube. Bar = 5 μm. (b) Kymograph of line indicated in panel a, showing the evolution of the fluorescence profile, and hence the Ncd motor locations, along the membrane tube in time. Ncd motors do not show any directed motion nor is there any emergent pattern. Again, the star indicates the small vesicle which shows a persistently high fluorescence signal through time, in contrast to the motors in the membrane tube. The black dashed line indicates the tip of the membrane tube and the white dashed line sits beyond the tip into the bulk of the sample. (c) Fluorescence intensity profile along the tip of the membrane tube (indicated by the dashed line in b) formed by nonprocessive motors measured for each point in time. The fluctuations in fluorescence intensity in the tip region are above the background noise shown in shaded representation. (d) Sum of images in a movie of a membrane tube network formed by processive (kinesin) motors. Bar = 5 μm. (e) Kymograph of line indicated in panel d showing the evolution of the fluorescence profile, the kinesin motor locations, along the membrane tube in time. Kinesins walk toward and accumulate at the tip of the membrane tube. (f) Intensity profile along the tip of the growing membrane tube as indicated by the dashed line in panel e. As expected for processive motors, motors accumulate at the tip of the tube, resulting in an increase of the fluorescence intensity.
Fluorescence image correlation analysis
Correlations in the fluorescence fluctuations from the data of, e.g., Fig. 1, b and e, can be used to provide information about the mechanisms and rate constants behind the processes that drive the fluorescence fluctuations. We expect different driving processes from processive and nonprocessive motors. Processive motors should create a system with a directed motion as motors walk along an MT toward the tip of a membrane tube, as shown in Fig. 1 d. In contrast, because nonprocessive motors continuously bind to and unbind from the MT, we would expect them to exhibit a diffusive-type behavior. There are two motor populations in the experiments considered here: motors that interact with the MT, and motors that freely diffuse in the membrane. However, the population of motors that freely diffuse in the membrane tube move very quickly on the scale of our experimental measurements (2) and likely do not contribute to the majority of the dynamics on the seconds timescale, so we do not consider them here. To probe the dynamics of motors at the MT by considering the fluctuations in fluorescence signal along a membrane tube, we examine the influence of diffusion and a directed motion on the autocorrelation function. First, we assume that a membrane tube is much longer than it is wide so that it can be approximated as a one-dimensional system. Thus, fluorescence correlations can also be examined in one dimension. The normalized temporal fluorescence autocorrelation H(τ) (5,6) for a single pixel along the membrane tube is
| (1) |
For a system dominated by a single diffusive species, the autocorrelation curve is
| (2) |
where , in which s is the width of a single pixel and D is the diffusion constant (6). For a system with a directed motion, the autocorrelation is described as
| (3) |
where and V is the velocity of the particles in the system.
The exponential decay in Eq. 3 for a system with a directed motion can be seen at longer correlation times (Fig. 2 a, lower line), whereas, in a system driven by diffusion, the feature is absent (Fig. 2 a, upper line). The processive motors should yield a correlation curve that shows features of a directed motion in the autocorrelation curve and the nonprocessive motors should yield a correlation curve that shows features of a diffusive-type behavior. We use simulated data to confirm that the one-dimensional model and autocorrelation curves accurately describe both diffusion and directed motion (see Supporting Material).
Figure 2.
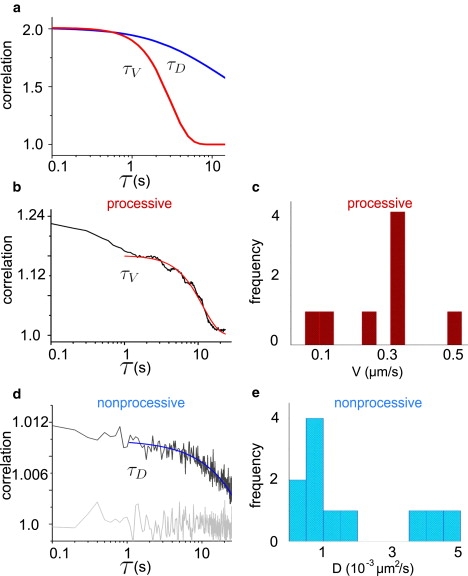
One-dimensional temporal autocorrelation curves for diffusion and flow. (a) The upper curve is a model curve for a system that is driven purely by single-component diffusion where τD = 12 s and D = 1 × 10⁻³ μm2/s. The lower curve is a model curve for a system with a directed motion, where τV = 0.78 s and V = 140 nm/s. The most striking difference between the two curves occurs at longer correlation times where the curve with a directed motion follows an exponential decay to zero. (b) Average autocorrelation curve for the points along a tube formed by processive motors (see line in Fig. 1d). The curve is characteristic for a system of particles that have a directed movement with an exponential decay at longer times. The curve is described by a one-dimensional model for a system of particles with a direction motion of velocity, where τV = 0.54 ± 0.07 s and V ≈ 200 nm/s, the motor speeds as they walk on the MT toward the tip of a membrane tube. (c) Histogram of speeds extracted from fits to the autocorrelation curves by a one-dimensional model for a system with directed movement. (d) Autocorrelation curve for nonprocessive motors in a membrane tube (see line in Fig. 1a). The curve is fit with a diffusive model for fluorescence correlations in a one-dimensional tube to yield a diffusion constant for nonprocessive motors that interact with the microtubule lattice. Here τD = 29 ± 4 s and D ≈ 0.4 × 10⁻³μm2/s. The signal is compared to background noise (lower shaded curve) to indicate that the signal is above the noise of the system. (e) Histogram of diffusion constants from fits to the autocorrelation curves for membrane tubes formed by nonprocessive motors. The resulting diffusion constants are very small, of ∼10−3μm2/s.
We consequently examine the experimental data and determine the autocorrelation for each pixel along a membrane tube individually, and average the resulting autocorrelation curves. The data for processive kinesin motors, excluding the saturated tip region, show a signature for a system with a directed motion in the autocorrelation curves (Fig. 2 b). Because we expect all motors that interact with the MT lattice to walk, we assume that diffusion at the MT lattice does not play a role. Thus, we fit the autocorrelation curve where τD → ∞ and determine that τV = 0.54 ± 0.07 s, which gives V ≈ 200 nm/s using Eq. 3. The fit does not extend to small timelags (Fig. 2 b) because our model assumes a system with a single motor fraction. We do not consider the motors freely diffusing in the membrane tube that contribute to very fast timescale fluorescence signals. Thus, at small time lags in the fluorescence correlation spectroscopy data, the signals between the two motor populations mix and the experimental data deviates from the model. Fig. 2 c shows a histogram of processive motor speeds in different experimental membrane tubes. The spread in speed is to be expected because as motors locally accumulate they can impede each other's path to slow each other down and there is also error in the fits from the model.
Fig. 2 d shows the autocorrelation curve for a tube pulled by nonprocessive motors. It should be noted that the experimental curves are well above the noise shown in shaded representation in Fig. 2 d. We fit the autocorrelation curves obtained from the experimental data of tubes pulled by nonprocessive motors with the one-dimensional model driven by diffusion (Eq. 2). The autocorrelation curve shows the dynamics of the slower fraction of molecules in the system: motors interacting with the MT. The resulting diffusion time for the nonprocessive motors from the fit in Fig. 2 d is τD = 29 ± 4 s so that D ≈ 0.4 × 10⁻³ μm2/s. In general, the diffusion constants for nonprocessive motors interacting with the MT are 10−3 μm2/s, as shown in Fig. 2 e. Surprisingly, the values of the diffusion constant are very small as compared to the diffusion constant of a motor-lipid complex freely moving in a lipid bilayer, ≈1 μm2/s (2).
We also examine spatial fluorescence correlations to rule out the possibility that motors artificially aggregate or show preferential binding regions on the MT. We find that, on length scales comparable to the point-spread function of the microscope motor, clusters are not spatially correlated. The absence of correlation indicates that artificial aggregation and preferential binding do not influence the motor dynamics we observe (see Supporting Material for detailed analysis).
Fluorescence recovery analysis
Until now, the fraction of motors freely diffusing in the membrane tube has been ignored. However, to fully understand the motor dynamics in the system, we need to know how motors diffusing in the membrane tube behave and what fraction of the motors interact with the MT. To probe the population of freely-diffusing motors, we used a technique that is commonly exploited to examine the dynamics of diffusive particles: fluorescence recovery after photobleaching (FRAP) (6–8). We bleach the motors in a small region of the membrane tube and examine the fluorescence recovery in that region. The timeseries in Fig. 3 a shows the fluorescence of a membrane tube formed by nonprocessive motors that is bleached at t = 0 in the circular region. Over time, the fluorescence in the bleached region is recovered. Examples of normalized curves for bleached regions of nonprocessive motors in membrane tubes both in the absence and presence of MTs are shown in Fig. 3 b. Membrane tubes in the absence of MTs are formed by flow. We examine the half-time for recovery for tubes with processive motors, nonprocessive motors, and tubes where motors do not interact with a MT and are freely diffusing. The half-times for bleached membrane tubes are shown in Fig. 3 c. The solid squares show the fluorescence recovery for a membrane tube (bleached in the middle) that does not interact with a microtubule below, so that all of the motors freely diffuse in the membrane tube. The average timescale for the half-time for recovery (large symbols in Fig. 3 c), τ1/2, for all of the tubes is approximately the same, suggesting that, in contrast to the ICS experiments, free diffusion of fluorescent motors in the membrane tube dominates the recovery signal.
Figure 3.
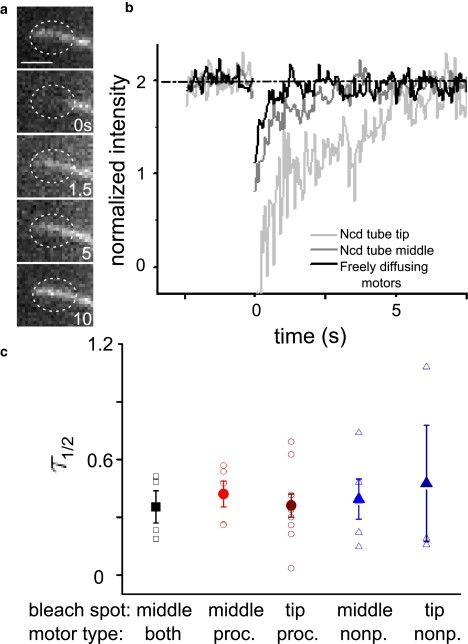
FRAP curves. (a) Timeseries showing the fluorescence recovery of nonprocessive motors in a membrane tube before and after bleaching of a region at the tip of the tube (dashed circle), bar = 2 μm. (b) FRAP curves for nonprocessive motors at a region in the middle of a membrane tube, at the tip of a membrane tube, and for motors diffusing in a membrane tube formed by flow in the absence of an underlying MT. (c) We examine the half-time for recovery of fluorescence into the bleached region, τ1/2. The plot shows this half-time for recovery for tubes that have only freely diffusing lipid-motor complexes (open squares; the solid square represents the mean), tubes with processive motors either bleached in the middle of a tube or at the tip (circles), and tubes with nonprocessive motors either bleached in the middle or at the tip (triangles).
The FRAP data also provides values for the diffusion constant of the motors diffusing in the membrane and the fraction of motors at the MT-membrane tube interface. To extract this information from the data, we again approximate a membrane tube as a line. Because FRAP probes fast timescales, the recovery curves can be described for a one-dimensional model system with a single diffusive species, the motors diffusing in the membrane tube. The normalized fluorescence intensity, F(t), from a one-dimensional recovery model for a single diffusive species of initial concentration, C0, in a bleached region of width w in the middle of a membrane tube is
| (4) |
where and D is the diffusion constant. Motors bleached at the tip of a tube encounter a reflecting boundary so that the recovery curve is
| (5) |
Fig. 4 a shows an example FRAP curve for nonprocessive motors in a membrane tube that has been bleached at the tip of the tube. The curve is fit (solid line in Fig. 4 a) with Eq. 5 to determine τD. Here, τD = 126 ± 18 s and w = 1.87 μm so that D = 0.027 μm2/s. The diffusion constant for this tube and diffusion constants for other nonprocessive motor membrane tubes are plotted in the scatterplot of Fig. 4 b. As expected in tubes that do not interact with a MT, all the motors are fast-moving and these freely-moving motor-lipid complexes have a diffusion constant of ≈1 μm2/s, indicated by the solid circles. The value is in agreement with measurements from FRAP experiments on a lipid bilayer on a surface (the bottom of a GUV) (2). The FRAP curves from nonprocessive motors in various tubes yield different diffusion constants, ranging from 10−2 m2/s to 1 μm2/s. The diffusion constants often have values below the value of purely freely-diffusing motors because the fraction of motors at the MT-membrane tube interface also contributes to the signal. Also, as predicted, the fraction of motors that interacts with the MT varies from tube to tube but the fraction of freely-diffusing motors is always higher.
Figure 4.
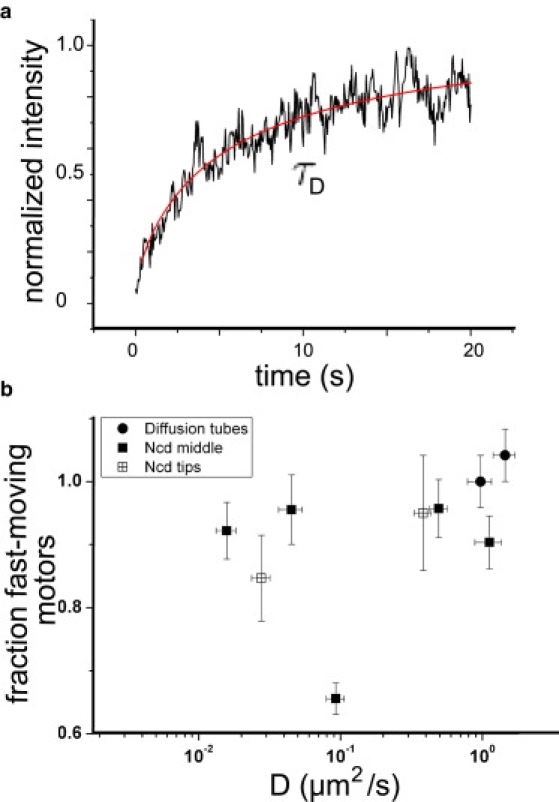
FRAP data. (a) FRAP curve for nonprocessive motors in a membrane tube fit by a one-dimensional model for recovery due to diffusion. The model gives τD = 126 ± 18 s and D = 0.027 μm2/s. (b) Scatterplot of diffusion constants measured for nonprocessive motors in membrane tubes using FRAP. Motors freely diffusing in a membrane tube have diffusion constants of 1 μm2/s (circles) and nonprocessive motors interacting with an underlying MT show a reduced diffusion constant. When motors interact with an MT on the surface the percentage of freely diffusing motors is reduced, as indicated by changes in the percentage of fast-moving motors on the y axis. Error bars are calculated from error in the fit of the model to the data.
Nature of the slowly diffusing fraction
The values of the diffusion constants from FRAP (10−2–1 μm2/s) and the values derived from ICS (10−3 μm2/s) describe the dynamics of two different populations: slow-moving motors at the MT-membrane tube interface and fast-moving motors that diffuse freely in the membrane. Because each timestep in the ICS measurements lasts 100 ms, the signal from any fast-moving motors is averaged out over the entire tube. Thus, ICS measurements only probe longer timescale behavior at the MT-membrane tube interface, a slow-moving fraction of the motor population. The diffusion constants of ∼10−3 μm2/s are an indicator of motor behavior at the MT lattice, which likely reflects repeated motor binding and unbinding.
FRAP measurements probe both this slow-moving fraction and the fast-moving fraction of the motor population (i.e., the motors that freely diffuse in the membrane). The net diffusion constant from FRAP can be called a measure of an effective interrupted diffusion constant, Deff, where (19). Here, Df is the diffusion constant for motors freely diffusing in the membrane, kon is the rate at which motors bind to the MT lattice, and koff is the rate at which motors leave the lattice. We can consider koff to be constant; its value is known from kinetic studies on Ncd, koff = 10 s−1 (17). We expect kon to be high because the membrane tube is close to the MT and motors may easily bind to the MT. The high kon results in the smaller Deff that we measure.
The ICS measurements, however, only provide information about the fraction of molecules on the MT lattice, the slow-moving fraction. We speculate that the small diffusion constant could result from two possible scenarios. First, motors could unbind and then quickly rebind within the same pixel on timescales faster than we probe with the ICS experiments. Cooperative binding, where the probability that a motor will bind next to a motor already bound on a MT is much higher than a motor randomly binding on the MT, could facilitate quick rebinding. Second, motors could stay bound to the MT for longer periods of time than the 0.1 s expected based on earlier kinetic studies (17). The depletion rate of ATP for our experiments does not allow ADP to compete with ATP until several hours into an experiment. Thus, we assume that neither long ADP nor nucleotide-free MT-bound states contribute to the signal of slow dynamics at the MT lattice. In this case, the relatively long dwell-times for motors on the MT are likely facilitated by binding (20). The consequence of this small diffusion constant in relation to the emergent collective behavior of tube extension and shrinkage (4) is that motors are continuously available to anchor the membrane tube to the MT.
We have shown with ICS and FRAP that nonprocessive motors show a diffusive behavior at the MT lattice with a very small diffusion constant. The small diffusion constant measured on the MT is an indicator of a continuous binding and rebinding of motors to the MT lattice. Continuous reorganization of motors along the lattice would allow a stochastic clustering-mechanism to arise. Such clustering has been predicted to be the driving force behind dynamic membrane tube transport by nonprocessive motors as seen in previous studies (4).
Supporting Material
Three figures are available at http://www.biophysj.org/biophysj/supplemental/S0006-3495(09)01572-0.
Supporting Material
Acknowledgments
The authors thank Dr. T. Surrey and Dr. F. Nédélec for providing the Kinesin plasmid and Dr. R. Stewart for the Ncd plasmid; Dr. M. van Duijn for constructing the biotinylated Ncd; Dr. S. Olthuis-Meunier for protein purifications; L. Holtzer for developing the FRAP setup; and Dr. J. van Noort for critical reading of the manuscript.
This work is part of the research program of the Stichting voor Fundamenteel Onderzoek der Materie, which is financially supported by the Nederlandse Organisatie voor Wetenschappelijk Onderzoek within the program on Material Properties of Biological Assemblies, grant No. FOM-L1708M.
References
- 1.Koster G., VanDuijn M., Dogterom M. Membrane tube formation from giant vesicles by dynamic association of motor proteins. Proc. Natl. Acad. Sci. USA. 2003;100:15583–15588. doi: 10.1073/pnas.2531786100. [DOI] [PMC free article] [PubMed] [Google Scholar]
- 2.Leduc C., Campàs O., Prost J. Cooperative extraction of membrane nanotubes by molecular motors. Proc. Natl. Acad. Sci. USA. 2004;101:17096–17101. doi: 10.1073/pnas.0406598101. [DOI] [PMC free article] [PubMed] [Google Scholar]
- 3.Campàs O., Leduc C., Prost J. Coordination of kinesin motors pulling on fluid membranes. Biophys. J. 2008;94:5009–5017. doi: 10.1529/biophysj.107.118554. [DOI] [PMC free article] [PubMed] [Google Scholar]
- 4.Shaklee P.M., Idema T., Dogterom M. Bidirectional membrane tube dynamics driven by nonprocessive motors. Proc. Natl. Acad. Sci. USA. 2008;105:7993–7997. doi: 10.1073/pnas.0709677105. [DOI] [PMC free article] [PubMed] [Google Scholar]
- 5.Petersen N.O., Höddelius P.L., Magnusson K.E. Quantitation of membrane receptor distributions by image correlation spectroscopy: concept and application. Biophys. J. 1993;65:1135–1146. doi: 10.1016/S0006-3495(93)81173-1. [DOI] [PMC free article] [PubMed] [Google Scholar]
- 6.Elson E. Fluorescence correlation spectroscopy and photobleaching recovery. Annu. Rev. Phys. Chem. 1985;36:379–406. [Google Scholar]
- 7.Axelrod D., Koppel D.E., Webb W.W. Mobility measurement by analysis of fluorescence photobleaching recovery kinetics. Biophys. J. 1976;16:1055–1069. doi: 10.1016/S0006-3495(76)85755-4. [DOI] [PMC free article] [PubMed] [Google Scholar]
- 8.Soumpasis D.M. Theoretical analysis of fluorescence photobleaching recovery experiments. Biophys. J. 1983;41:95–97. doi: 10.1016/S0006-3495(83)84410-5. [DOI] [PMC free article] [PubMed] [Google Scholar]
- 9.Jolimaître P., Roux A., Bourel-Bonnet L. Synthesis and preliminary physical applications of a rhodamine-biotin phosphatidylethanolamine, an easy attainable lipid double probe. Chem. Phys. Lipids. 2005;133:215–223. doi: 10.1016/j.chemphyslip.2004.10.005. [DOI] [PubMed] [Google Scholar]
- 10.Angelova M.I., Soléau S., Bothorel P. Preparation of giant vesicles by external AC fields. Kinetics and application. Prog. Colloid Polym. Sci. 1992;89:127–131. [Google Scholar]
- 11.Young E.C., Berliner E., Gelles J. Subunit interactions in dimeric kinesin heavy chain derivatives that lack the kinesin rod. J. Biol. Chem. 1995;270:3926–3931. doi: 10.1074/jbc.270.8.3926. [DOI] [PubMed] [Google Scholar]
- 12.deCastro M.J., Fondecave R.M., Stewart R.J. Working strokes by single molecules of the kinesin-related microtubule motor Ncd. Nat. Cell Biol. 2000;2:724–729. doi: 10.1038/35036357. [DOI] [PubMed] [Google Scholar]
- 13.Gilbert S.P., Johnson K.A. Expression, purification, and characterization of the Drosophila kinesin motor domain produced in Escherichia coli. Biochemistry. 1993;32:4677–4684. doi: 10.1021/bi00068a028. [DOI] [PubMed] [Google Scholar]
- 14.Howard J. Sinauer; Sunderland, MA: 2001. Mechanics of Motor Proteins and the Cytoskeleton. [Google Scholar]
- 15.Verbrugge S., Kapitein L.C., Peterman E.J.G. Kinesin moving through the spotlight: single-motor fluorescence microscopy with submillisecond time resolution. Biophys. J. 2007;92:2536–2545. doi: 10.1529/biophysj.106.093575. [DOI] [PMC free article] [PubMed] [Google Scholar]
- 16.Borghi N., Rossier O., Brochard-Wyart F. Hydrodynamic extrusion of tubes from giant vesicles. Europhys. Lett. 2003;64:837. [Google Scholar]
- 17.Pechatnikova E., Taylor E.W. Kinetics processivity and the direction of motion of Ncd. Biophys. J. 1999;77:1003–1016. doi: 10.1016/S0006-3495(99)76951-1. [DOI] [PMC free article] [PubMed] [Google Scholar]
- 18.Hackney D.D. Highly processive microtubule-stimulated ATP hydrolysis by dimeric kinesin head domains. Nature. 1995;377:448–450. doi: 10.1038/377448a0. [DOI] [PubMed] [Google Scholar]
- 19.Sprague B.L., Pego R.L., McNally J.G. Analysis of binding reactions by fluorescence recovery after photobleaching. Biophys. J. 2004;86:3473–3495. doi: 10.1529/biophysj.103.026765. [DOI] [PMC free article] [PubMed] [Google Scholar]
- 20.Roos W.H., Campàs O., Cappello G. Dynamic kinesin-1 clustering on microtubules due to mutually attractive interactions. Phys. Biol. 2008;5:046004. doi: 10.1088/1478-3975/5/4/046004. [DOI] [PubMed] [Google Scholar]
Associated Data
This section collects any data citations, data availability statements, or supplementary materials included in this article.