

Abstract
The purpose of the study was to design a computer-aided detection (CAD) system for breast mass detection on digital breast tomosynthesis (DBT) mammograms and to perform a preliminary evaluation of the performance of this system. Twenty-six patients were imaged with a prototype DBT system. Institutional review board approval and written informed patient consent were obtained. Use of the data set in this study was HIPAA compliant. The CAD system first screened the three-dimensional volume of the mass candidates by means of gradient-field analysis. Each mass candidate was segmented from the structured background, and its image features were extracted. A feature classifier was designed to differentiate true masses from normal tissues. The CAD system was trained and tested by using a leave-one-case-out method. The classifier calculated a mean area under the test receiver operating characteristic curve of 0.91 ± 0.03 (standard error of mean). The CAD system achieved a sensitivity of 85%, with 2.2 false-positive objects per case. The results demonstrate the feasibility of the authors’ approach to the development of a CAD system for DBT mammography.
Mammography is considered the most cost-effective screening method for the early detection of breast cancer. However, the sensitivity of mammography is often limited by the presence of overlapping dense fibroglandular tissue in the breast. Dense parenchyma reduces the conspicuity of abnormalities and thus constitutes one of the main causes of missed breast cancer (1). The advent of full-field digital detectors offers opportunities to develop advanced techniques for improved imaging of dense breasts, such as digital tomosynthesis (2), stereomammography (3–7), and breast computed tomography (CT) (8). To our knowledge, these techniques are still under development and their potential influences on breast cancer detection remain to be investigated.
Digital tomosynthesis is based on the same principle as conventional tomography, which involves the use of a screen-film system as the image receptor for imaging body parts at selected depths. With conventional tomography, a series of projection exposures is accumulated on the same film when the x-ray source is moved about a fulcrum while the screen-film system is moved in the opposite direction. A drawback of conventional tomography is that each tomogram can depict only one plane at a selected depth with a relatively sharp focus. If the exact depth of interest is not known in advance or the abnormality encompasses a range of depths, then a tomogram at each depth will have to be acquired at separate imaging examinations, requiring additional radiation doses and examination time.
With digital tomosynthesis, the series of projection exposures is read out by the digital detector as separate projection views when the x-ray source moves to different locations about the fulcrum. Tomographic sections focused at any depth of the imaged volume can then be generated from the same series of projection images by using digital reconstruction techniques. Because of the wide dynamic range and the linear response of the digital detector, each projection image can be acquired with a fraction of the x-ray exposure used to obtain a conventional projection radiograph. The total radiation dose required for digital tomosynthesis imaging may be kept at nearly the same as or only slightly higher than that required for conventional radiography. Properly designed digital reconstruction techniques have an additional advantage in that the depth resolution of tomosynthesis is generally much higher than that of conventional tomography. Thus, digital tomosynthesis makes it more practical to apply tomography to breast imaging in terms of radiation dose, examination time, and spatial resolution.
Digital breast tomosynthesis (DBT) mammography is one of the promising methods that may help reduce the camouflaging effects of dense breast tissue and improve the sensitivity of mammography for breast cancer detection in dense breasts. Several research groups are developing digital tomosynthesis methods for the reconstruction of tomographic sections from series of projection images (2,9–11). A study to compare DBT mammograms with conventional mammograms in breast cancer detection is underway (12).
Computer-aided detection (CAD) has been shown to improve breast cancer detection at mammography (13–15). Although the results of a preliminary evaluation indicated that breast lesions can be visualized more easily on DBT images than on conventional mammograms (12), to our knowledge, the overall detection sensitivity and specificity of DBT compared with those of conventional mammography remain to be investigated. With DBT, the number of reconstructed sections of each breast is very large. Even with 1-mm section thickness, the number of sections per breast will range from about 30 to more than 80. The time required to interpret a DBT case can be expected to be much longer than that required to interpret a conventional mammographic case.
With increases in radiologist workloads, the possibility of subtle lesions being overlooked may not be negligible. CAD will probably have a role in the reading of DBT mammograms, as it does in the reading of conventional mammograms. Thus, the purpose of our study was to design a CAD system for the detection of masses at DBT mammography and to perform a preliminary evaluation of the performance of this system.
Materials and Methods
Data Set
D.B.K. is the patent holder of the described DBT system. A data set of DBT cases was collected by the researchers (D.B.K., E.A.R., R.H.M., T.W.) at the Breast Imaging Research Laboratory of Massachusetts General Hospital with institutional review board approval. The recruited patients gave written informed consent. Use of the data set in this study was Health Insurance Portability and Accountability Act compliant. The patients were imaged with a prototype DBT system (GE Medical Systems, Milwaukee, Wis). This system has a flat-panel amorphous silicon detector with a pixel size of 0.1 × 0.1 mm. The DBT system acquired 11 projection-view mammograms of the compressed breast over a 50° arc in the mediolateral oblique view. The total radiation dose used to obtain the 11 projection-view mammograms was designed to be less than 1.5 times the dose used to obtain a single conventional (ie, screen-film) mammogram. DBT sections were reconstructed with 1-mm intersection spacing by using an iterative maximum-likelihood algorithm (9).
In this preliminary study, the DBT mammograms obtained in 26 patients aged 41–77 years (mean, 56 years; median, 56 years) were used. The number of DBT sections obtained per patient ranged from 37 to 89 (mean, 60.1), depending on the thickness of the compressed breast. Each patient case consisted of DBT sections of a single breast. The 26 cases included 23 breast masses and three areas of architectural breast distortion. Thirteen masses and two areas of architectural distortion were proved to be malignant at biopsy. Eight masses and the other area of architectural distortion were proved to be benign at biopsy. Two masses were determined to be benign by means of long-term follow-up or additional imaging. In each case, a Mammography Quality Standards Act (MQSA)-accredited radiologist (E.A.R.) with 5 years of experience in breast imaging determined the true location of the mass or area of architectural distortion on the basis of the diagnostic information. The longest diameters of the lesions ranged from 5.4 to 29.4 mm (mean, 14.2 mm; median, 12.1 mm), as estimated on the DBT section intersecting the lesion at approximately its largest cross section by an MQSA-accredited radiologist (M.A.H.) with 17 years of experience in breast imaging. The distribution of the longest diameters of the masses or areas of architectural distortion is shown in Figure 1. The distribution of breast density among the 26 breasts in terms of Breast Imaging Reporting and Data System category, as estimated by one of the MQSA-accredited radiologists (M.A.H.) by viewing the digitized screen-film mammograms, is shown in Figure 2.
Figure 1.
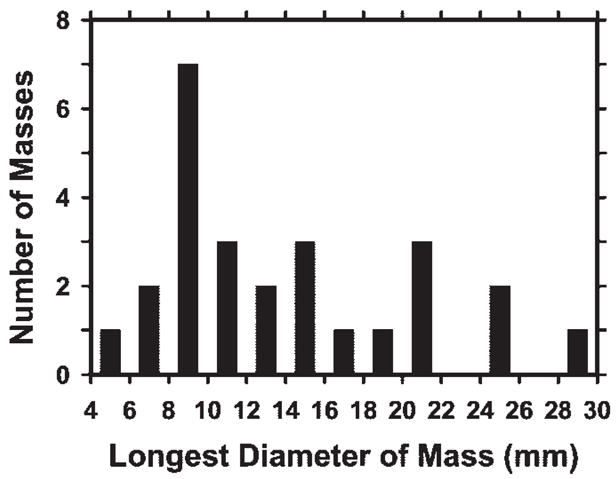
Distribution of longest diameters of the 23 masses and three areas of architectural distortion, as estimated on the DBT section intersecting the lesion at approximately its largest cross section.
Figure 2.
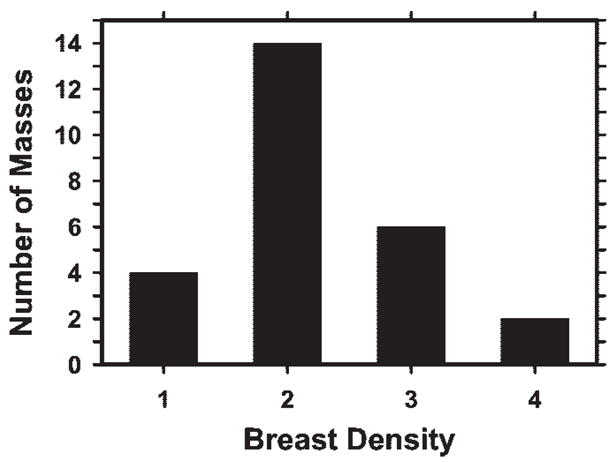
Distribution of breast density in terms of Breast Imaging Reporting and Data System category for the 26 breasts, as estimated from the conventional mammograms by an MQSA-accredited radiologist (M.A.H.).
An example of a DBT section intersecting a spiculated mass is shown in Figure 3a. For comparison, the same mass depicted in the same view on a conventional mammogram is shown in Figure 3b. The spicules of the mass are much more conspicuous on the DBT section than on the conventional mammogram, probably because of the reduced structured background on the DBT image.
Figure 3.

Mass (arrow) depicted in the mediolateral oblique view on (a) DBT and (b) screen-film mammograms. The spicules of the mass are much more conspicuous in a.
Computerized Detection
The CAD mass detection system was developed in the CAD Research Laboratory at the University of Michigan. The system includes several major steps, including prescreening, segmentation, feature extraction, and false-positive object reduction, as shown in Figure 4. For a given case, the DBT section containing the entire breast volume was input into the CAD system for processing. The section thickness was linearly interpolated to 0.1 mm in the direction perpendicular to the detector plane so that the voxels in the data set were converted to 0.1 × 0.1 × 0.1-mm isotropic cubes.
Figure 4.
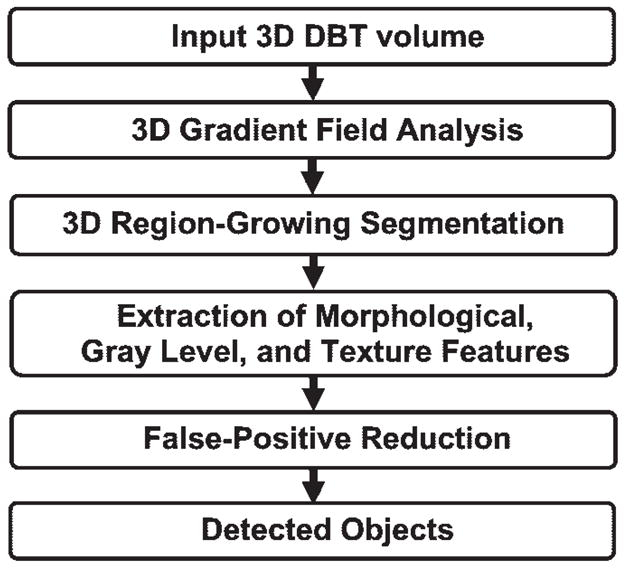
Schematic outline of CAD system steps for mass detection on DBT mammograms. 3D = three-dimensional.
In the prescreening step, three-dimensional (3D) gradient-field analysis of the volumetric data set in each case was performed to detect lesion candidates. To reduce noise in the gradient calculation, the image voxels were first averaged over every 2 × 2-voxel region to obtain a smoothed volumetric data set. The gradient-field analysis was performed in a spherical region that had a radius of about 6 mm and was centered at each voxel of the breast volume. The gradient vector at each smoothed voxel in the spherical region was computed, and the direction of the gradient vector was projected to the radial direction from the central voxel to the smoothed voxel. The average gradient direction over a spherical shell of voxels at a radius, R(k), of k voxels from the central voxel was calculated as the mean of the gradient directions over voxels on three adjacent spherical shells: R(k − 1), R(k), and R(k + 1). Finally, the gradient-field convergence at the central voxel was determined to be the maximum of the average gradient directions among all shells in the spherical region. Gradient-field convergence calculation was performed over all voxels in the breast region to result in a 3D gradient-field image.
The CAD algorithm then identified the locations of high-gradient convergence on the 3D gradient-field image as the locations of mass candidates. A 256 × 256 × 256-voxel volume of interest was centered at each location. The object in each volume of interest was segmented by using a 3D region-growing method with which the location of high-gradient convergence was used as the starting point and the object was allowed to “grow” across multiple sections. In this study, region growing was guided by the radial gradient magnitude. The growth of the object was terminated where the radial gradient reached a threshold value that was adaptively selected for the local object. After region growing, all connected voxels constituting the object were labeled. The 3D object characteristics could then be extracted from the object.
Three groups of features—morphologic features, gray-level features, and texture features—were extracted from the segmented object. Morphologic feature descriptors included the volume in terms of the number of voxels in the object, the volume change before and after 3D morphologic opening by a spherical element with a 5-voxel radius, the surface area, the maximum perimeter of the segmented object among all sections intersecting the object, and the longest diameter of the object. The compactness of the object was described in terms of the percentage of overlap with a sphere of the same volume centered at the centroid of the object. The gray-level features included the contrast of the object relative to the surrounding background; the minimal and maximal gray levels; and the characteristics derived from the gray-level histogram of the object, such as skewness, kurtosis, energy, and entropy.
The texture features were described by using run-length statistics as follows: On each section, the cross section of the 3D object was treated as an object on a two-dimensional image. We applied the rubber-band straightening transform (RBST) that we previously developed for analysis of masses on two-dimensional mammograms (16) to the object. A 60-pixel-wide region around the object margin was transformed into a rectangular coordinate system. Sobel filtering in the x and y directions was then applied to the RBST image to generate gradient images in the two directions. A gradient-magnitude image of the transformed rectangular object margin was derived from these gradient images as the square root of the sum of the squares of the gradients at each corresponding pixel of these images.
Five run-length statistics texture features were extracted from the gradient-magnitude image in the horizontal and vertical directions: short-runs emphasis, long-runs emphasis, gray-level nonuniformity, run-length nonuniformity, and run percentage. A detailed description of the RBST and of the run-length statistics texture features for mammographic masses can be found in the literature (16,17). For a 3D object in the DBT data set, each run-length statistics texture feature was obtained by averaging the corresponding feature values over sections containing the segmented object.
Data and Statistical Analyses
Because of the limited data set available for this preliminary study, a leave-one-case-out resampling technique was used to train and test the performance of the CAD system. A classifier was trained to differentiate true masses from false-positive objects. The classifier was based on linear discriminant analysis and stepwise feature selection (18) that were designed with the training subset in each leave-one-case-out cycle. The trained classifier was applied to the lesion candidates in the left-out case such that each object was assigned a discriminant score. The test performance of the linear discriminant analysis classifier in differentiating true from false masses in the feature classification step of the CAD system was evaluated by performing receiver operating characteristic (ROC) analysis (19) of the discriminant scores of objects in the left-out cases. The area under the ROC curve and its standard error were obtained by using the ROCKIT program (version 9.1; Charles E. Metz, University of Chicago, Chicago, Ill), which uses maximum-likelihood estimation to fit a binormal ROC curve to the test discriminant scores output by the classifier.
Free-response ROC analysis was used to evaluate the test performance of the CAD system. A decision threshold was applied to the test discriminant score of each detected object. When an object had a discriminant score above the threshold, the location of that object was compared with the location of the true mass in that case. An object was considered to be true-positive if the centroid of the true mass marked by the radiologist was within the volume of the object; otherwise, the object was considered to be false-positive. For each decision threshold, the detection sensitivity and the average number of false-positive objects per case were determined on the basis of the entire data set. The free-response ROC curve was generated by varying the decision threshold over a range of values.
Results
Figure 5a and 5b shows an example of a section through a mass in a volume of interest and of the mass boundary determined by using 3D region-growing segmentation, respectively. An example of RBST applied to the section containing the mass and of the gradient image derived from the RBST image is shown in Figure 5c and 5d, respectively. The spicules radiating from the mass are approximately in the vertical direction, and the segmented boundary of the mass is transformed to a straight line, forming the upper edge of the rectangular RBST image.
Figure 5.
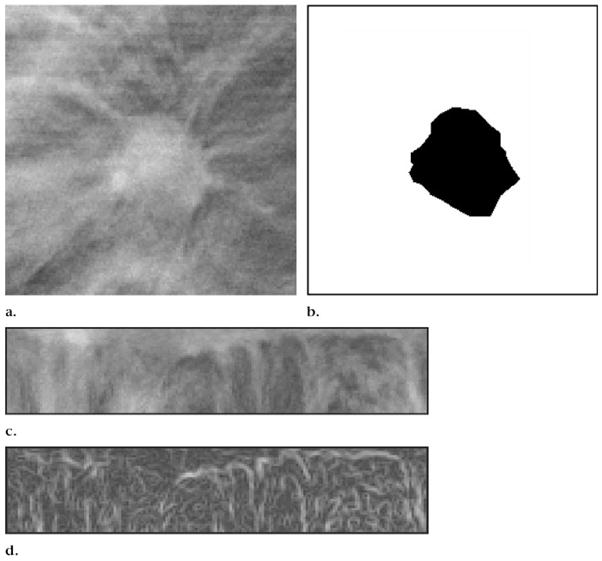
(a) DBT mammographic section intersecting a spiculated breast mass. (b) Mass in a after 3D region-growing segmentation. (c) RBST image of a 60-pixel-wide region around the same mass. The segmented mass boundary is transformed into a straight line, forming the upper boundary of the rectangular RBST image. (d) Gradient-magnitude image derived from Sobel filtering of the RBST image in c.
To design the linear discriminant analysis classifier for false-positive object reduction, the stepwise feature selection procedure was used to select the most effective subset of features from the available feature pool and thus reduce the dimensionality of the feature space for the classifier (18,20). An average of seven features were selected from the available feature pool. The most often selected features included object contrast, minimal gray level, volume change before and after 3D morphologic opening, maximal perimeter, compactness, and two run-length statistics texture features—horizontal short-runs emphasis and gray-level nonuniformity. The ROC curve derived from the test discriminant scores of the masses and normal objects is shown in Figure 6. The area under the ROC curve reached 0.91 ± 0.03.
Figure 6.
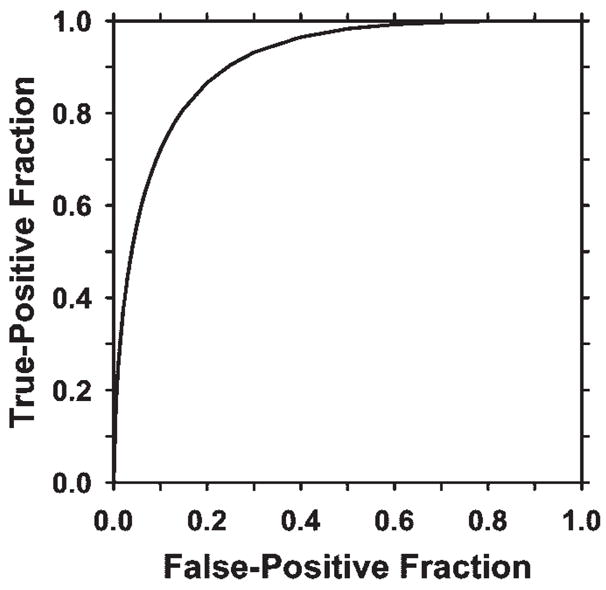
ROC curve showing the performance of the linear discriminant classifier obtained from leave-one-case-out testing. The area under the ROC curve was 0.91 ± 0.03, indicating that the classifier was effective in reducing the number of false-positive objects.
In the prescreening step, 100% of the masses and architectural distortions were detected, with an average of 29 false-positive objects per case. The overall test performance of the CAD system after false-positive object reduction is illustrated by the free-response ROC curve shown in Figure 7. The system achieved sensitivities of 85% (22/26) with 2.2 false-positive objects per case and 80% (21/26) with 2.0 false-positive objects per case in this preliminary study.
Figure 7.
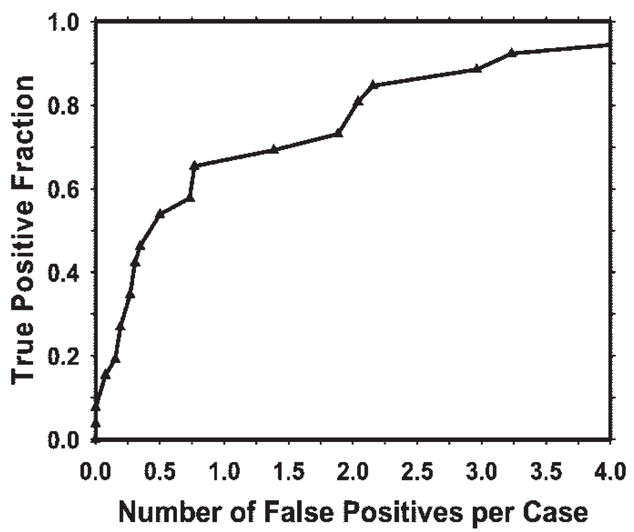
Free-response ROC curve for the test performance of the CAD system for DBT mammography. The current CAD system achieved 85% sensitivity, with 2.2 false-positive objects per case.
Discussion
In this preliminary study, we used a 3D approach that takes advantage of the volumetric nature of tomosynthesis reconstruction. Prescreening of lesion candidates, image segmentation, and feature extraction were performed in the volumetric data set for each breast. The pre-screening and segmentation methods developed for 3D processing are effective for locating true lesions. Although the training samples in this study were small, the overall performance of the system is promising. Therefore, the results of this study demonstrate the feasibility of our approach to the development of a CAD system for assisting radiologists in detecting masses on DBT mammograms. Further improvement in the performance of the system can be expected with use of a larger data set for training the algorithms.
With DBT mammography, the structured background such as the dense fibroglandular tissue was suppressed on the reconstructed DBT sections. However, DBT is different from CT in that the overlapping tissues are reduced but not totally eliminated. Tomosynthesis reconstruction left residual overlapping tissue on the DBT sections. Similarly, the shadow of a lesion can be seen on most DBT sections, even though the actual size of the mass may be only a fraction of the breast thickness. In addition, the voxel dimension in the z direction (ie, the direction perpendicular to the sections) on the reconstructed sections is 10 times larger than that in the x–y plane (ie, the planes of the sections). Therefore, the boundary of an object in the z direction is not as well defined as that in the x–y plane.
The features extracted in three dimensions may have a strong directional dependence. For example, in this study we extracted texture features along the x–y plane only, and a 3D texture feature was obtained by averaging the corresponding two-dimensional texture values over sections containing the object. For true 3D texture analysis, the texture feature values should be calculated in the shell of voxels surrounding the object or on the planes that intersect the object centroid from different directions. We will investigate the potential directional effects of the features on false-positive object reduction when a larger data set becomes available.
A limitation caused by the small data set in this study is the possibility that the distributions of the characteristics of the masses and the breast parenchyma in this data set were not statistically similar to those in the patient population. Although the results appear to be promising, the methods and features used may have been biased toward the specific data set used. Further studies are needed to evaluate the robustness of these computer vision techniques in a larger data set.
For DBT imaging, the raw data were acquired as 11 projection-view mammograms. On average, each projection-view mammogram was obtained by using about 14% of the radiation dose used to obtain a conventional mammogram. A projection-view mammogram is therefore noisier than a conventional mammogram. However, the 11 projection-view mammograms offer the advantage that a lesion will be projected at slightly different angles, and, thus, there will be somewhat different overlapping tissues on each view. A lesion that may be camouflaged by dense tissue on some views may become more conspicuous on other views. In addition, overlapping tissues that mimic lesions on some views may mimic lesions to a lesser degree on other views. If a CAD lesion detection system is applied to projection-view mammograms, the complementary information derived from the different projection-view mammograms may be used to improve sensitivity and reduce the number of false-positive objects. We are studying the feasibility of developing a CAD system for detecting lesions on projection-view mammograms and investigating methods to merge the information from the 11 projection-view mammograms. In future studies, this approach will be compared with the current approach of detecting lesions on reconstructed DBT volumetric data sets.
Furthermore, although with our current lesion-detection algorithm, DBT sections reconstructed from the iterative maximum-likelihood algorithm are used as input, we expect that our image-processing methods will not strongly depend on the reconstruction method for generating the DBT sections as long as the image quality of the reconstructed sections is reasonable. The effects of the factors that may affect image quality—including image acquisition technique, number of projection views, tomographic angle, reconstruction method, and section thickness—on lesion detection accuracy will have to be investigated when DBT cases obtained with different methods and parameters become available in the future.
Acknowledgments
Work conducted at the University of Michigan supported by USPHS grants CA91713 and CA95153 and U.S. Army Medical Research and Materiel Command grant DAMD17-02-1-0214. The development of the prototype digital breast tomosynthesis system and the clinical trial were supported by USAMRMC grant DAMD17-98-1-8309 awarded to Massachusetts General Hospital.
The authors are grateful to Charles E. Metz, PhD, for the ROCKIT program provided from the University of Chicago Web site (http://xray.bsd.uchicago.edu/krl/index.htm).
Abbreviations
- CAD
computer-aided detection
- DBT
digital breast tomosynthesis
- MQSA
Mammography Quality Standards Act
- RBST
rubber-band straightening transform
- ROC
receiver operating characteristic
- 3D
three-dimensional
Footnotes
See Materials and Methods for pertinent disclosures.
The content of this paper does not necessarily reflect the position of the government, and no official endorsement of any equipment or product of any companies mentioned herein should be inferred.
Author contributions:
Guarantor of integrity of entire study, H.P.C.; study concepts/study design or data acquisition or data analysis/interpretation, all authors; manuscript drafting or manuscript revision for important intellectual content, all authors; approval of final version of submitted manuscript, all authors; literature research, H.P.C., J.W.; clinical studies, E.A.R., T.W., R.H.M., D.B.K.; experimental studies, all authors; statistical analysis, J.W.; and manuscript editing, H.P.C., B.S., M.A.R., L.M.H., M.A.H.
References
- 1.Bird RE, Wallace TW, Yankaskas BC. Analysis of cancers missed at screening mammography. Radiology. 1992;184:613–617. doi: 10.1148/radiology.184.3.1509041. [DOI] [PubMed] [Google Scholar]
- 2.Niklason LT, Christian BT, Niklason LE, et al. Digital tomosynthesis in breast imaging. Radiology. 1997;205:399–406. doi: 10.1148/radiology.205.2.9356620. [DOI] [PubMed] [Google Scholar]
- 3.Goodsitt MM, Chan HP, Hadjiiski LM. Stereomammography: evaluation of depth perception using a virtual 3D cursor. Med Phys. 2000;27:1305–1310. doi: 10.1118/1.599008. [DOI] [PubMed] [Google Scholar]
- 4.Goodsitt MM, Chan HP, Darner KL, Hadjiiski LM. The effects of stereo shift angle, geometric magnification and display zoom on depth measurements in digital stereomammography. Med Phys. 2002;29:2725–2734. doi: 10.1118/1.1517615. [DOI] [PubMed] [Google Scholar]
- 5.Getty DJ, Pickett RM, D’Orsi CJ. Stereoscopic digital mammography: improving detection and diagnosis of breast cancer. Berlin, Germany: International Congress Series. 2001;1230:506–511. [Google Scholar]
- 6.Chan HP, Goodsitt MM, Hadjiiski LM, et al. ROC study comparing radiologists’ performances in evaluating breast lesions on stereoscopic and single-projection digital specimen mammograms (abstr) Med Phys. 2003;30:1456. [Google Scholar]
- 7.Chan HP, Goodsitt MM, Hadjiiski LM, et al. Effects of magnification and zooming on depth perception in digital stereomammography: an observer performance study. Phys Med Biol. 2003;48:3721–3734. doi: 10.1088/0031-9155/48/22/007. [DOI] [PubMed] [Google Scholar]
- 8.Boone JM, Nelson TR, Lindfors KK, Seibert JA. Dedicated breast CT: radiation dose and image quality evaluation. Radiology. 2001;221:657–667. doi: 10.1148/radiol.2213010334. [DOI] [PubMed] [Google Scholar]
- 9.Wu T, Stewart A, Stanton M, et al. Tomographic mammography using a limited number of low-dose cone-beam projection images. Med Phys. 2003;30:365–380. doi: 10.1118/1.1543934. [DOI] [PubMed] [Google Scholar]
- 10.Suryanarayanan S, Karellas A, Vedantham S, et al. Evaluation of linear and nonlinear tomosynthetic reconstruction methods in digital mammography. Acad Radiol. 2001;8:219–224. doi: 10.1016/S1076-6332(03)80530-5. [DOI] [PubMed] [Google Scholar]
- 11.Dobbins JT, Godfrey DJ. Digital x-ray to-mosynthesis: current state of the art and clinical potential. Phys Med Biol. 2003;48:R65–R106. doi: 10.1088/0031-9155/48/19/r01. [DOI] [PubMed] [Google Scholar]
- 12.Rafferty EA, Georgian-Smith D, Kopans DB, Hall DA, Moore R, Wu T. Comparison of full-field digital tomosynthesis with two view conventional film screen mammography in the prediction of lesion malignancy (abstr) Radiology. 2002;225(P):268. [Google Scholar]
- 13.Chan HP, Doi K, Vyborny CJ, et al. Improvement in radiologists’ detection of clustered microcalcifications on mammograms: the potential of computer-aided diagnosis. Invest Radiol. 1990;25:1102–1110. doi: 10.1097/00004424-199010000-00006. [DOI] [PubMed] [Google Scholar]
- 14.Freer TW, Ulissey MJ. Screening mammography with computer-aided detection: prospective study of 12 860 patients in a community breast center. Radiology. 2001;220:781–786. doi: 10.1148/radiol.2203001282. [DOI] [PubMed] [Google Scholar]
- 15.Helvie MA, Hadjiiski LM, Makariou E, et al. Sensitivity of noncommercial computer-aided detection system for mammographic breast cancer detection: a pilot clinical trial. Radiology. 2004;231:208–214. doi: 10.1148/radiol.2311030429. [DOI] [PMC free article] [PubMed] [Google Scholar]
- 16.Sahiner B, Chan HP, Petrick N, Helvie MA, Goodsitt MM. Computerized characterization of masses on mammograms: the rubber band straightening transform and texture analysis. Med Phys. 1998;25:516–526. doi: 10.1118/1.598228. [DOI] [PubMed] [Google Scholar]
- 17.Galloway MM. Texture classification using gray level run lengths. Comput Graph Image Process. 1975;4:172–179. [Google Scholar]
- 18.Sahiner B, Chan HP, Petrick N, Wagner RF, Hadjiiski LM. Feature selection and classifier performance in computer-aided diagnosis: the effect of finite sample size. Med Phys. 2000;27:1509–1522. doi: 10.1118/1.599017. [DOI] [PMC free article] [PubMed] [Google Scholar]
- 19.Metz CE, Herman BA, Shen JH. Maximum-likelihood estimation of receiver operating characteristic (ROC) curves from continuously distributed data. Stat Med. 1998;17:1033–1053. doi: 10.1002/(sici)1097-0258(19980515)17:9<1033::aid-sim784>3.0.co;2-z. [DOI] [PubMed] [Google Scholar]
- 20.Chan HP, Sahiner B, Wagner RF, Petrick N. Classifier design for computer-aided diagnosis: effects of finite sample size on the mean performance of classical and neural network classifiers. Med Phys. 1999;26:2654–2668. doi: 10.1118/1.598805. [DOI] [PubMed] [Google Scholar]