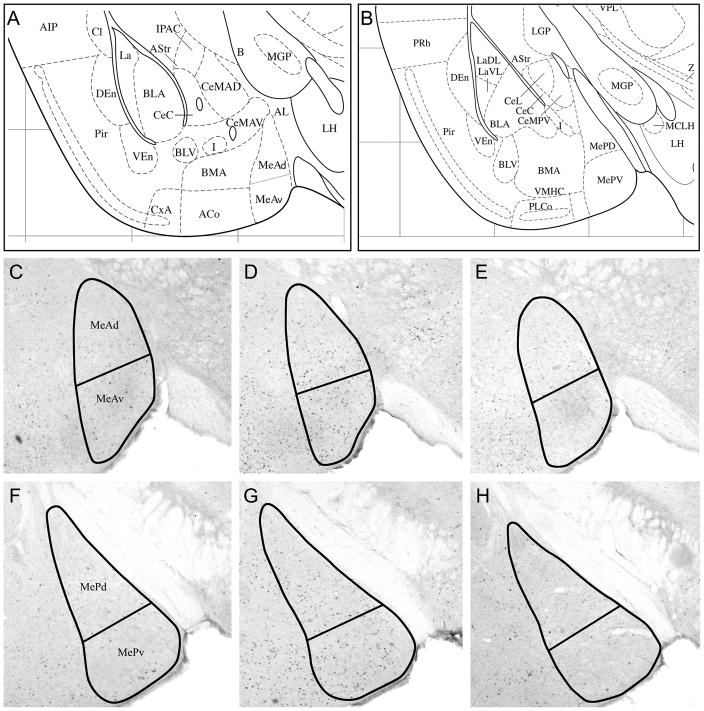
Figure 3.
Representative coronal sections (40 μM) showing outlines within which FRAs-immunoreactive nuclei were counted. (A, B) Ventrolateral forebrain structures of the coronal sections used to measure IEG response in medial amygdala (from the Paxinos and Franklin (2003) mouse brain atlas): (A) At the level of anterior medial amygdala; Panels C, D, E are approximately at this level (1.06 mm posterior to bregma); (B) Posterior medial amygdala; Panels F, G, H are approximately at this level (1.58 mm posterior to bregma). C, D; F, G: Representative sections showing FRAs-labeled nuclei in anterior medial amygdala (C, D) and posterior medial amygdala (F, G) in SHAM-operated mice exposed to (C, F) clean swabs or to (D, G) female mouse urine (fMU). E and H show the reduced FRAs expression the medial amygdala of a mouse exposed to fMU after bilateral vomeronasal organ removal.

