Abstract
The concerted movement of cells from different germ layers contributes to morphogenesis during early embryonic development. Using an optimized imaging approach and quantitative methods, we analyzed the trajectories of hundreds of ectodermal cells and internalized mesodermal cells within Drosophila embryos over 2 hours during gastrulation. We found a high level of cellular organization, with mesoderm cell movements correlating with some but not all ectoderm movements. During migration, the mesoderm population underwent two ordered waves of cell division and synchronous cell intercalation, and cells at the leading edge stably maintained position. Fibroblast growth factor (FGF) signaling guides mesodermal cell migration; however, we found some directed dorsal migration in an FGF receptor mutant, which suggests that additional signals are involved. Thus, decomposing complex cellular movements can provide detailed insights into collective cell migration.
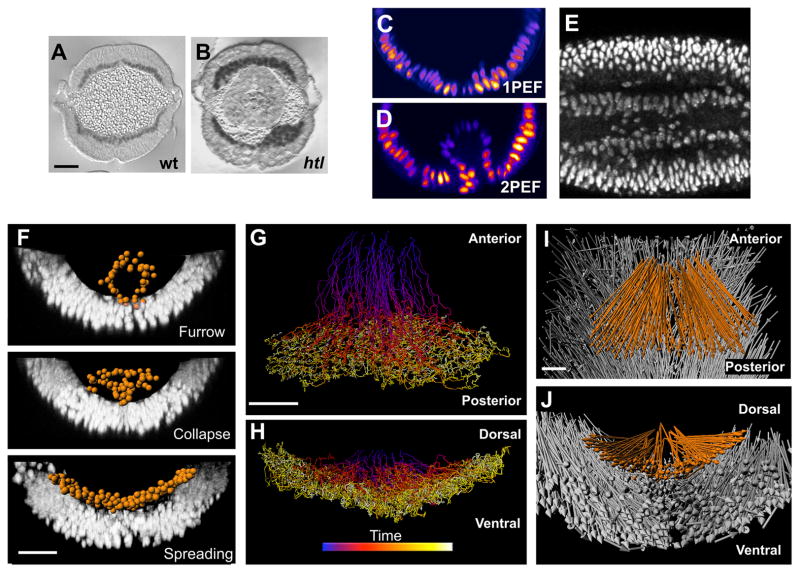
An embryo is shaped by a complex combination of collective cell movements that result in cell diversification and tissue formation (1–4). The majority of these morphogenetic events are dynamic and involve the simultaneous execution of different movements, with large populations of cells moving in three-dimensional (3D) space deep inside the embryo (4, 5). Gastrulation is the earliest morphogenetic event involving massive cellular movements of the germ layers (6). Because it is technically challenging to image individual cell movements inside an embryo without compromising its viability, studies of mesoderm cell migration during gastrulation in Drosophila have relied on the extrapolation of dynamical events from observations of fixed embryos (Fig. 1, A and B) or from in vivo descriptions of small numbers of cells (7–9).
Fig. 1.
Two-photon microscopy and analysis of histone2A (H2A)–GFP expressing embryos captures key events in gastrulation. (A and B) Cross-sections of wild-type (A) and htl mutant (B) embryos stained with antibody to Twist. (C and D) Confocal 1PEF (C) fails to image internalized mesoderm cells, whereas 2PEF (D) captures the positions of the internalized cells. (E) A 50-μm-deep and 10-μm-thick lateral slice through an H2A-GFP embryo demonstrates the signal-to-noise ratio (anterior, left). (F) Segmentation of mesoderm nuclei (orange spheres) by the use of Imaris software (Bitplane AG, Zurich, Switzerland). Each sphere was defined by the fluorescent intensity of H2A-GFP. Furrow formation, furrow collapse as a result of an EMT, and spreading of the mesoderm to form a monolayer are illustrated from top to bottom, respectively. (G to J) Tracking cell positions in three dimensions over time. Shown are dorsal (G) and posterior (H) views of mesoderm tracks (blue and yellow indicate early and late time points, respectively) and dorsal (I) and posterior (J) views of mesoderm (orange) and ectoderm (gray) net displacement vectors. Scale bars, 20 μm.
We used optimized two-photon excited fluorescence (2PEF) (10, 11) to image large domains of Drosophila embryos ubiquitously expressing nuclear green fluorescent protein (GFP) (Fig. 1, C and D) (12) with sufficient spatial and temporal resolution to examine mesoderm spreading non-invasively over 2 hours (Fig. 1E and movie S1) (13). We extracted the complex cell movements of the mesoderm and ectoderm cells from each large imaging data set (~3 billion voxels) by using 3D segmentation of cell positions and 3D tracking over time (Fig. 1, F to H, and movie S2). This involved the analysis of over 100,000 cell positions per embryo (movie S3) (13). We used computational analysis to capture the three main morphogenetic events of the mesoderm (Fig. 1F) and confirmed that the ectoderm cell layer, upon which mesoderm cells are migrating, undergoes germ-band elongation by means of convergent extension movements (Fig. 1, I and J) (14, 15).
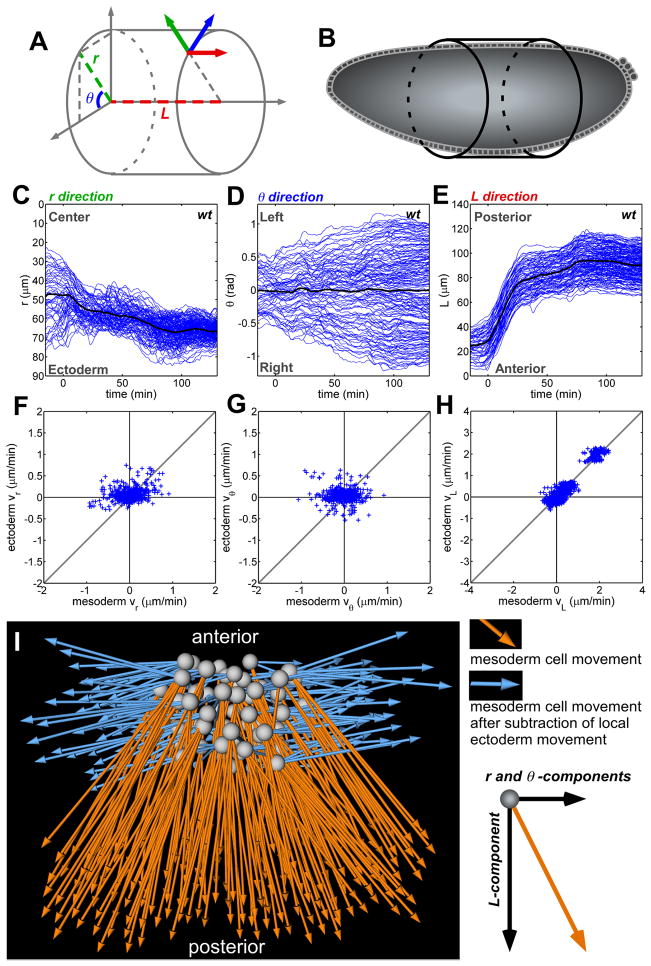
We developed custom software tools to extract quantitative information from the cell trajectories and to describe the dynamic behavior in detail (movie S3) (13). First, we redefined the positions of cells in accordance with a cylindrical coordinate system [radial (r), angular (θ), and longitudinal (L)] by fitting a cylinder on the average position of ectoderm cells. This coordinate system, unlike the standard Cartesian system (x, y, and z), is more appropriate for the body plan of Drosophila embryos and the geometry of their morphogenetic events (Fig. 2, A to E, fig. S1, and movie S4) (14, 15).
Fig. 2.
Decomposition and correlative analysis of cell movements with the use of cylindrical coordinates. (A and B) The use of cylindrical coordinates allows the positioning of cells according to the body plan of the embryo at stage 6. (C to E) Cell trajectories (blue lines) reveal that each axis corresponds to a morphogenetic movement. (C) r is the radial position over time (for example, furrow collapse and intercalation; 0 indicates the center of the embryo). (D) θ is the angular movement (for example, mesoderm spreading and ectoderm convergence; 0 indicates the position of the ventral midline). (E) L corresponds to the movement of cells along the length of the embryo (for example, germ-band elongation). In (C) to (E), time (t) = 0 is set as the point when AP movement begins. (F to H) Correlation of the velocity (v) of each mesoderm cell with its six nearest ectodermal neighbors along the (F) radial, (G) angular, and (H) AP axes, with correlation values of 0.21 ± 0.43, 0.08 ± 0.18, and 0.90 ± 0.06, respectively (n = 3 embryos). (I) Dorsal view of mesoderm cell displacement before (orange) and after (blue) subtraction of local ectoderm cell movements.
We determined the influence of ectoderm cell movements on the migratory path of the overlying mesoderm by investigating the coupling between the motions of these two cell populations. The ectoderm is in close physical contact with the mesoderm: The mesoderm invaginates from the ectoderm, and the ectoderm serves as the substratum on which the mesoderm cells spread during germ-band elongation (15, 16). Previous qualitative studies suggested a coupling of their movements; in mutants that fail to form ectoderm, mesoderm cells are specified but fail to move (14). Statistical analysis of our data revealed that the trajectories of mesoderm and ectoderm cells correlate highly in the anterior-posterior (AP) direction (the L axis) (Fig. 2H). However, in the other directions (the r and θ axes), little to no correlation was found (Fig. 2, F and G). Subtracting axial motions of the local ectoderm cells from the motion of each mesoderm cell resulted in no residual movement of the mesoderm in the L direction (Fig. 2I and movies S5 and S6), which suggests that the mesoderm cells are carried by the strong movement of the ectoderm during germ-band elongation in this direction. The lack of correlation in the radial and angular directions suggests that mesoderm cells undergo active movement, distinct from that of the ectoderm.
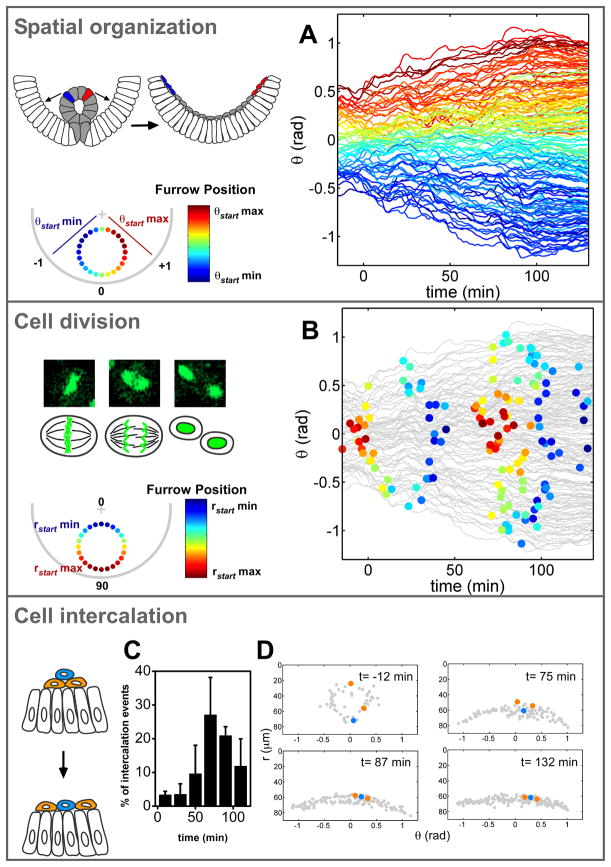
In the angular direction (θ), mesoderm cell movement was symmetrical with respect to the ventral midline of the embryo, as demonstrated by a θ mean value of 0 (Fig. 2D). Using a color code to identify each cell track by its position of origin in the furrow (Fig. 3A), we revealed a stable chromatic pattern of the trajectories in the θ direction, highlighting the fact that the spatial organization of cells in this direction is preserved over time. The straightness of the trajectories and the limited intermixing of cells support the view that cell movements are directed. The cell trajectories revealed that a group of cells originating from the upper lateral parts of the furrow (Fig. 3A) becomes positioned at each leading edge of the mesoderm cell population, which was maintained for the entire course of their migration (movie S7). These leading cells were neither the first nor the last to invaginate; instead, their location within the furrow positioned them to land in the leading position as the furrow collapsed after the epithelial-to-mesenchymal transition (EMT).
Fig. 3.
Quantitative analysis of morphogenetic events reveals a high level of organization in wild-type embryos. (A) A color code marks the angular position of cells in the furrow at stage 7 and shows the spatial organization as cells move over time. rad, radians. Each line represents the trajectory of one cell. (B) Position and timing of each cell division (colored circle). The color code represents the radial position in the furrow at stage 7. DNA morphology during cell division in H2A-GFP embryos is shown (top left). (C) Analysis of intercalation events within the mesoderm over time shown as a percentage of mesoderm cells intercalating (n = 3 embryos). (D) The position of mesoderm cells before and after intercalation events.
We explored other morphogenetic events that might contribute to mesoderm spreading, such as cell division pattern and cell intercalation, based on our cell-tracking data. Each mesoderm cell divided twice (7, 8, 17, 18), and these divisions were ordered in space and time (Fig. 3B). Cells nearest the ectoderm divided first, followed by cells nearer to the top of the ventral furrow. This order was maintained during the second division cycle. Analysis of the cell division mutants did not uncover any of the characteristic mesoderm migration defects observable in fixed sections (fig. S6) (18). Our tracking data revealed that the orientation of cell divisions within the mesoderm is random and that altering the organization of cell divisions had no effect on mesoderm spreading or embryo viability (fig. S7, A to C). Thus, it is unlikely that these organized cell divisions play a role in mesoderm spreading. The radial cell intercalation events (19) were synchronous with the second wave of cell division (Fig. 3, C and D), but the orientation of the cell divisions did not seem to play a causal role in the intercalation motions. Mesoderm cell intercalation contributes to monolayer formation and spreading (Fig. 3, C and D).
To facilitate comparisons between embryos, we developed a statistical analysis characterizing the spreading behavior of the mesoderm cells. As suggested by the spatial organization of the spreading (Fig. 3A), the angular positions of each cell at the onset (θstart) and at the end (θend) of the process were highly correlated. A plot of starting and ending positions revealed a linear relationship (fig. S4, A to C). Given this, linear regressions that were applied to the θend (θstart) values provided a measure of both the strength of the spreading (as the slope of the line, A) (fig. S4, D and E) and a quantitative measure of collective behavior (the degree of correlation, R) (13). Wild-type cells followed an ordered spreading behavior [θend ≈ 2(θStart)], which is shared by the majority of cells (R > 0.9) (fig. S5). Comparison of the regression analysis from five wild-type embryos showed the consistency of cell behaviors (n = 5 embryos and n = 596 cells) (fig. S5).
Previous studies of fixed embryos (8, 9, 20, 21) have suggested that fibroblast growth factor (FGF) signaling is involved in regulating mesoderm cell migration, but its exact function has remained elusive. We used our methodology to study the function of the FGF signaling pathway on the regulation of gastrulation by analyzing embryos of the FGF receptor mutant heartless (htl) in the same way as wild-type embryos (figs. S2 and S3 and movie S9). We decomposed the cell movements within htl mutant embryos into their components in r, θ, and L (fig. S3, A to C), permitting direct comparisons with wild-type embryos (Fig. 2, C to E). The ectoderm-coupled movements of mesoderm cells in the L direction were unaffected in htl mutants (fig. S3F), and we obtained no evidence for defects in cell-division events (fig. S7D). However, htl mutant embryos displayed mesoderm cell defects that affected both collapse of the furrow (r axis) and spreading in the angular direction (θ axis) (fig. S3, A and B). A statistical analysis of cell movement conducted on htl mutant–tracking data showed a scattered distribution of θend(θstart) values (figs. S4I and S5), resulting in low spreading and correlation values (A <1 and R < 0.5 to 0.7, respectively) (fig. S5C). Values obtained with analysis of individual htl embryos or by pooling the cells from multiple htl embryos (n = 3 embryos and n = 284 cells) (fig. S5, B and C) quantitatively demonstrated that a similar disruption of spreading is present in all htl embryos.
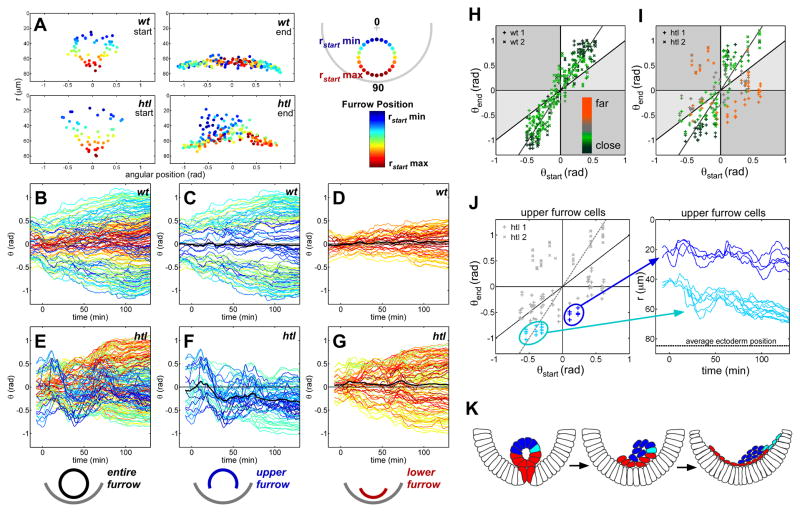
Cell tracking analysis revealed that loss of FGF signaling affected the mesoderm cells non-homogenously (movie S10). In the radial direction, cells originating from the upper half of the furrow (“upper-furrow” cells) in general did not collapse, remaining far from the ectoderm during the entire acquisition time (Fig. 4A, fig. 3SA, and movies S11 and S8). The angular movement of upper-furrow cells was strongly affected in htl mutants (Fig. 4, B to G). In contrast, the last cells to invaginate in htl mutants, which make up the lower furrow, behaved in a manner similar to wild-type mesoderm cells and could achieve the same dorsal position as the wild type (Fig. 4G). Our statistical analysis of cell movements of upper- and lower-furrow cells confirmed the presence of two distinct cell behaviors in htl embryos (fig. S5, D and E). Other cell labeling approaches, such as photoactivatable GFP, can be used to characterize mutant phenotypes, but the limited number of cells they can follow (7) make interpretation difficult, especially when there are multiple behaviors, such as in htl mutant embryos.
Fig. 4.
Furrow collapse and spreading of mesoderm cells are disrupted in htl mutants. (A) Position of mesoderm cells (circles) at stage 7 and stage 10 in wild-type and htl embryos shown with a radial color code. (B to G) Angular movement of cells over time analyzed in wild-type [(B) to (D)] and htl mutant [(E) to (G)] embryos within the entire [(B) and (E)], upper [(C) and (F)], and lower [(D) and (G)] furrow (black line indicates the average mesoderm displacement with respect to the midline). (H and I) Spreading profile of wild-type (H) and htl (I) embryos. The color code represents the distance from the ectoderm at the end of spreading (red indicates far from ectoderm and green indicates close to ectoderm). The gray line represents a spreading coefficient of A = 2, where θend = A(θstart)+ B [B, constant (13)]. Cells that do not spread within the collective are represented within gray regions of the graph (13). In general, cells located close to the ectoderm fall along the gray line. (J) The radial position (r) of two particular groups of mesoderm cells from the upper furrow of htl mutants is depicted over time. One group exhibits normal spreading behavior (light blue), and the other group exhibits aberrant spreading (dark blue). (K) The furrow collapse in htl mutants is disrupted, resulting in cells falling randomly to one side of the embryo. Upper-furrow cells that reach the ectoderm (light blue) undergo normal spreading, whereas cells that remain far from the ectoderm spread abnormally (dark blue). Red cells are Red indicates lower-furrow cells.
Some cells from the upper furrow in htl mutants displayed normal positions in the θend(θstart) graph, similar to those of wild-type embryos. These cells were positioned close to the ectoderm at the end of spreading (Fig. 4, I and J, and fig. S4J). This suggested that the distance from the ectoderm might have a major influence on spreading behavior. Indeed, the distinction between the two migratory behaviors observed was more clear when analyzing cells that were close to or far from the ectoderm (Fig. S5, D and E). We confirmed this by plotting a θend(θstart) graph using a color code for the radial position of the cells at the end of the spreading process (Fig. 4, H and I): The htl cells that followed wild-type behavior [θend≈2(θstart) such that A = 2] ended up close to the ectoderm (Fig. 4I, green), whereas the cells that stayed far from the ectoderm (Fig. 4I, red) had clearly disrupted behaviors, with several cells crossing the midline and migrating in the wrong direction (A < 0). All wild-type cells ended up close to the ectoderm (Fig. 4H).
Our analysis provides several insights into the htl mutant phenotype. First, the primary function of FGF signaling must be to help all cells within the furrow to collapse, directing them toward the ectoderm (Fig. 4K). Second, another as-yet unidentified signal must guide the migration of the cells in the angular direction toward the dorsal ectoderm, because movement is observed even in the absence of FGF signaling. Third, contact with the ectoderm is key for the mesoderm to respond to this guidance cue, because the distance of the mesoderm cells from the ectoderm defines their migratory competence. Any cell that encounters the ectoderm is capable of directed movement in the angular direction in response to a cue that cannot be solely FGF-dependent. Movement of the mesoderm cells might require contact with the ectoderm to make them competent to respond to a directional signal, as evidenced in other systems (22–24).
This study demonstrates that stereotypical morphogenetic events during embryo development can be systematically quantified, analyzed, and compared between wild-type and mutant embryos by means of the live imaging of large groups of cells. Complex cell movements are decomposed into particular cell behaviors, revealing a high level of organization and permitting the interpretation of subtle mutant phenotypes in Drosophila. Future developments in imaging and cell tracking will facilitate this quantitative approach, enabling its application at a larger scale and in other model systems, to expand the understanding of collective cell migration and embryonic development from the molecular level to that of the entire organism (25).
Supplementary Material
References and Notes
- 1.Rorth P. Trends Cell Biol. 2007;17:575. doi: 10.1016/j.tcb.2007.09.007. [DOI] [PubMed] [Google Scholar]
- 2.Montell DJ. Curr Opin Genet Dev. 2006;16:374. doi: 10.1016/j.gde.2006.06.010. [DOI] [PubMed] [Google Scholar]
- 3.Stern CD. Gastrulation: From Cells to Embryo. Cold Spring HarborLaboratory Press; Cold Spring Harbor, NY: 2004. [Google Scholar]
- 4.Lecaudey V, Gilmour D. Curr Opin Cell Biol. 2006;18:102. doi: 10.1016/j.ceb.2005.12.001. [DOI] [PubMed] [Google Scholar]
- 5.Rohde LA, Heisenberg CP. Int Rev Cytol. 2007;261:159. doi: 10.1016/S0074-7696(07)61004-3. [DOI] [PubMed] [Google Scholar]
- 6.Leptin M. Dev Cell. 2005;8:305. doi: 10.1016/j.devcel.2005.02.007. [DOI] [PubMed] [Google Scholar]
- 7.Murray MJ, Saint R. Development. 2007;134:3975. doi: 10.1242/dev.005389. [DOI] [PubMed] [Google Scholar]
- 8.Wilson R, Vogelsang E, Leptin M. Development. 2005;132:491. doi: 10.1242/dev.01603. [DOI] [PubMed] [Google Scholar]
- 9.Schumacher S, Gryzik T, Tannebaum S, Muller HA. Development. 2004;131:2631. doi: 10.1242/dev.01149. [DOI] [PubMed] [Google Scholar]
- 10.Helmchen F, Denk W. Nat Methods. 2005;2:932. doi: 10.1038/nmeth818. [DOI] [PubMed] [Google Scholar]
- 11.Supatto W, et al. Proc Natl Acad Sci USA. 2005;102:1047. doi: 10.1073/pnas.0405316102. [DOI] [PMC free article] [PubMed] [Google Scholar]
- 12.Clarkson M, Saint R. DNA Cell Biol. 1999;18:457. doi: 10.1089/104454999315178. [DOI] [PubMed] [Google Scholar]
- 13.Materials and methods are available as supporting material on Science Online.
- 14.Irvine KD, Wieschaus E. Development. 1994;120:827. doi: 10.1242/dev.120.4.827. [DOI] [PubMed] [Google Scholar]
- 15.Zallen JA, Blankenship JT. Semin Cell Dev Biol. 2008;19:263. doi: 10.1016/j.semcdb.2008.01.005. [DOI] [PMC free article] [PubMed] [Google Scholar]
- 16.Wilson R, Leptin M. Philos Trans R Soc London Ser B. 2000;355:891. doi: 10.1098/rstb.2000.0625. [DOI] [PMC free article] [PubMed] [Google Scholar]
- 17.Seher TC, Leptin M. Curr Biol. 2000;10:623. doi: 10.1016/s0960-9822(00)00502-9. [DOI] [PubMed] [Google Scholar]
- 18.Grosshans J, Wieschaus E. Cell. 2000;101:523. doi: 10.1016/s0092-8674(00)80862-4. [DOI] [PubMed] [Google Scholar]
- 19.Voiculescu O, Bertocchini F, Wolpert L, Keller RE, Stern CD. Nature. 2007;449:1049. doi: 10.1038/nature06211. [DOI] [PubMed] [Google Scholar]
- 20.Gisselbrecht S, Skeath JB, Doe CQ, Michelson AM. Genes Dev. 1996;10:3003. doi: 10.1101/gad.10.23.3003. [DOI] [PubMed] [Google Scholar]
- 21.Beiman M, Shilo BZ, Volk T. Genes Dev. 1996;10:2993. doi: 10.1101/gad.10.23.2993. [DOI] [PubMed] [Google Scholar]
- 22.Krieg M, et al. Nat Cell Biol. 2008;10:429. doi: 10.1038/ncb1705. [DOI] [PubMed] [Google Scholar]
- 23.Sato M, Kornberg TB. Dev Cell. 2002;3:195. doi: 10.1016/s1534-5807(02)00202-2. [DOI] [PubMed] [Google Scholar]
- 24.Yang X, Dormann D, Munsterberg AE, Weijer CJ. Dev Cell. 2002;3:425. doi: 10.1016/s1534-5807(02)00256-3. [DOI] [PubMed] [Google Scholar]
- 25.Megason SG, Fraser SE. Cell. 2007;130:784. doi: 10.1016/j.cell.2007.08.031. [DOI] [PubMed] [Google Scholar]
- 26.We thank M. Levine and E. Meyerowiz for comments on the manuscript, M. Liebling for advice on Imaris and Matlab, and the Caltech Biological Imaging Center for sharing equipment. This work was supported by grants to A.S. from NIH (R01 GM078542), the Searle Scholars Program, and the March of Dimes (Basil O’Conner Starter Scholar Award, 5-FY06-12), and grants to S.F. from the Caltech Beckman Institute and NIH (Center for Excellence in Genomic Science grant P50 HG004071).
Associated Data
This section collects any data citations, data availability statements, or supplementary materials included in this article.


