

Abstract
The development of fetal brain is influenced by nutrients such as docosahexaenoic acid (DHA, 22:6) and choline. Phosphatidylethanolamine-N-methyltransferase (PEMT) catalyzes the biosynthesis of phosphatidylcholine from phosphatidylethanolamine enriched in DHA and many humans have functional genetic polymorphisms in the PEMT gene. Previously, it was reported that Pemt−/− mice have altered hippocampal development. The present study explores whether abnormal phosphatidylcholine biosynthesis causes altered incorporation of DHA into membranes, thereby influencing brain development, and determines whether supplemental dietary DHA can reverse some of these changes. Pregnant C57BL/6 wild type (WT) and Pemt−/− mice were fed a control diet, or a diet supplemented with 3 g/kg of DHA, from gestational day 11 to 17. Brains from embryonic day 17 fetuses derived from Pemt−/− dams fed the control diet had 25–50% less phospholipid-DHA as compared with WT (p < 0.05). Also, they had 60% more neural progenitor cell proliferation (p < 0.05), 60% more neuronal apoptosis (p < 0.01), and 30% less calretinin expression (p < 0.05; a marker of neuronal differentiation) in the hippocampus compared with WT. The DHA-supplemented diet increased fetal brain Pemt−/− phospholipid-DHA to WT levels, and abrogated the neural progenitor cell proliferation and apoptosis differences. Although this diet did not change proliferation in the WT group, it halved the rate of apoptosis (p < 0.05). In both genotypes, the DHA-supplemented diet increased calretinin expression 2-fold (p < 0.05). These results suggest that the changes in hippocampal development in the Pemt−/− mouse could be mediated by altered DHA incorporation into membrane phospholipids, and that maternal dietary DHA can influence fetal brain development.
Introduction
Docosahexaenoic acid (DHA)2 (22:6) and choline are essential nutrients (1) that are critical for normal development of fetal brain (2, 3). DHA is an omega-3 (22:6(n-3)) polyunsaturated fatty acid that accumulates in the fetal brain in a manner that is dependent on maternal dietary DHA levels (4–7). It is typically found enriched in the aminophospholipids, phosphatidylethanolamine (PtdEtn) and phosphatidylserine (PtdSer), of neural membranes (8). Because of its effects on brain and retina development and function, DHA is also included in many infant formulas and in diets of pregnant women (2). The effects of DHA may be related to changes in formation of membrane phospholipid species containing this fatty acid (2).
Choline is included in infant formulas and in the maternal diet because, during a critical span of time during fetal brain development, choline availability influences neural progenitor cell proliferation, apoptosis, and differentiation (9–11). In humans, low choline intake during pregnancy is associated with an increased risk for neural tube defects in the fetus (12, 13). It has been suggested that the effects of this nutrient on brain development are mediated by changes in gene methylation (14, 15). However, there is a metabolic pathway that links choline with DHA, and there could be a common mechanism for the effects of these two nutrients on brain development.
DHA metabolism and choline metabolism are linked by the enzyme phosphatidylethanolamine-N-methyltransferase (PEMT), which catalyzes de novo biosynthesis of phosphatidylcholine (PtdCho) by methylation of PtdEtn (16). This enzyme prefers species of PtdEtn that contain long-chain polyunsaturated fatty acids such as DHA (17), thereby forming DHA-enriched species of PtdCho in membranes. Available PtdCho and PtdEtn are used to form phosphatidylserine (PtdSer) by serine base exchange enzymes (18). Because PtdCho is almost exclusively found in the outer leaflet of the cell membrane and PtdEtn and PtdSer are only found in the inner leaflet, any change in the activity of PEMT can modify not only PtdCho-DHA and PtdEtn-DHA concentrations, but may also lead to an imbalance in DHA distribution in the leaflets of the membrane. In fact, PtdCho-DHA concentrations in liver cell membranes and plasma were diminished in Pemt−/− mice compared with wild type (19).
There is increased neurogenesis and decreased GABAergic neuron differentiation in the fetal hippocampus of the Pemt−/− mouse compared with wild type (20). Because PEMT activity is a major user of S-adenosylmethionine (21), and because there was increased S-adenosylmethionine concentration as well as increased DNA and histone methylation in the hippocampus of Pemt−/− fetuses, it was suggested that the effects of deleting Pemt on fetal brain development were mediated by changes in gene methylation (20, 22). Although this remains a likely mechanism mediating many of the observed changes, we now consider whether changes in DHA concentrations and/or DHA distribution in membrane leaflets might also mediate or enhance the observed effects of deleting Pemt. We hypothesized that dietary supplementation of DHA to Pemt−/− dams would restore normal PtdCho-DHA concentrations in cell membranes, and that this would reverse at least some of the abnormal cell proliferation, apoptosis, and differentiation observed in the knock-out fetal mouse hippocampus.
EXPERIMENTAL PROCEDURES
Animals
C57BL/6 wild type mice, in-house bred from timed pregnant C57BL/6 wild type mice purchased from The Jackson Laboratory (Bar Harbor, ME), and in-house bred Pemt−/− mice (fully backcrossed with C57BL/6 mice by the MAX/BAX method at Charles River Laboratories (Wilmington, MA)) were used, and all experiments were performed in duplicate to generate fetal brain data from 5 to 10 dams per group, using 1–4 fetuses per dam. Knock-out mice were mated with knock-out mice, wild type mice with wild type. The day after mating was considered gestational (embryonic) day zero (E0). Mice were maintained in a temperature controlled room at 24 °C and exposed to a 12-h light and dark cycle. All animal procedures were approved by the University of North Carolina Institutional Animal Care and Use Committee.
Pemt Genotyping
Tail clippings of young post-weaned mice were collected under sterile conditions. DNA was extracted using a DNeasy tissue kit (Qiagen, Valencia, CA) according to the manufacturer's protocol and quantified. For the Pemt WT, 250 ng of DNA was added to a mixture (20 μl total volume) containing 1 μm primers (forward, GAGCGCAATGGTACTCACCACATTCC and reverse, GATCTTGTCTTCAGAGCCACAG; Operon Biotechnologies, Huntsville, AL) and 10 μl of Takara enzyme SYBR mixture (Takara Bio, Shiga, Japan). For the Pemt Neo, forward (CTTGGGTGGAGAGGCTATTC) and reverse primers (AGGTGAGATGACAGGAGATC; Operon Biotechnologies) were used. Successful amplification was carried out on an Ep Realplex 1.5 Thermalcycler (Eppendorf, Westbury, NY). The following conditions were used for Pemt WT: 95 °C for 2 min; 37 cycles (95 °C for 15 s, 61 °C for 15 s, and 70 °C for 20 s) annealing, followed by 95 °C for a 15-s final extension and melting curve. For the Pemt Neo, conditions for “touchdown PCR” included enzyme activation at 94 °C for 2 min, 12 cycles of 94 °C for 20 s melting, 64 °C for 30 s (repeated decrease in temperatures by 0.5 °C/cycle) annealing, 72 °C for 35 s extension followed by 25 cycles of 94 °C for 20 s, 50 °C for 30 s, and 72 °C for 35 s final extension, and melting curve. DNA contamination, if any, was identified by comparing the reverse transcription-PCR results to a standard curve.
Experimental Diets
Mice were maintained on an ad libitum AIN-76A pelleted diet containing standard choline chloride (1.1 g/kg) and 50 g/kg of corn oil (Dyets, Bethlehem, PA) and on ad libitum water until they were on the experimental diets. At the end of day 11 of gestation, pregnant mice were randomly assigned to one of two feeding groups: control or DHA supplemented. From day 11 of gestation until the end point on gestational day 17, pregnant mice in the control group continued on the standard AIN-76A pelleted diet, whereas mice on the DHA-supplemented diet were fed a modified AIN-76A pelleted diet containing the 1.1 g/kg of choline chloride, 47 g/kg of corn oil, and 3 g/kg of DHA (DHA was obtained as an ethyl ester from Nu-Check Prep (Elysian, MN) and given to Dyets for the preparation of the diet). Corn oil contains about 10% palmitate (16:0), 3% stearate (18:0), 30% oleate (18:1), 56% linoleate (18:2), 1% α-linolenate (18:3), and no DHA (23). Antioxidant content was equalized in all diets. The diets were kept refrigerated and replaced in the cages each day to minimize oxidation.
Tissue Collection
On gestational day 17, the pregnant dams were anesthetized by intra-peritoneal injection of ketamine (200 mg/kg body weight) and xylazine (20 mg/kg body weight; Henry Schein, Melville, NY). The uterine horns were exposed by a midline abdominal incision to collect the fetuses, which were kept in culture dishes containing 0.1 m phosphate-buffered saline (PBS) on a heating pad at 37 °C to maintain body temperature. The fetuses were removed individually from the uterine sacs, decapitated, and in an alternating manner, brains and whole skulls were collected.
Fetal brains for biochemical determinations were frozen in liquid nitrogen and stored at −80 °C until used. Fetal brains were collected for immunohistochemical determinations using the modified technique of Park et al.(24). Skulls were opened and immersed in fixation buffer containing 4% formaldehyde and 0.2% glutaraldehyde (Polysciences, Warrington, PA) in PBS overnight at 4 °C. On the subsequent day, fetal brains were removed from the skull, post-fixed with perfusion fixative, rinsed in PBS, and stored in 70% ethanol at 4 °C. The fixed tissues were processed overnight in an automated processor (model ASP300S, Leica Microsystems, Nussloch, Germany) and embedded in paraffin wax. Embedded fetal brains were processed for serial 5-μm coronal sections using a microtome (model RM2155 version 1.0, Leica Microsystems) and serially collected on superfrost glass slides. The fetal brains were appropriately oriented during paraffin embedding to get coronal sections of the hippocampus. Because there is a posterior to anterior gradient of neurogenesis in fetal mouse hippocampus (25), the fetal brain serial sections were reviewed and selected before immunohistochemical staining to ensure that they included anatomically equivalent areas of the hippocampus as defined by a standard atlas of the developing brain (26).
Phospholipid-DHA in Fetal Brain
Phospholipid-DHA concentrations in fetal brain were determined by capillary gas chromatography. Lipids were extracted (27) and the phospholipids separated by thin layer chromatography (CHCl3, 2-propanol, triethylamine, MeOH, 0.25% KCl (w/v), H2O, 30:25:18:9:3:3, v/v) (28). The bands that co-eluted with authentic PtdCho, PtdEtn, PtdSer, and phosphatidylinositol (PtdIns) standards were collected, saponified, and the fatty acids trans-methylated by a sequential 1-ml addition of 4.25% NaOH in CHCl3/MeOH (2:1, v/v) and 1 n HCl in saline (29). The resulting methyl esters were evaporated to dryness under nitrogen, re-suspended in 50 μl of undecane, and separated on a capillary column (coated with 70% cyanopropyl polysilphenylene-siloxane; 10 m × 0.1 mm inner diameter, BPX70 0.2 μm; SGE, Austin, TX), using a split injection system (Agilent 7890A Gas Chromatograph, Agilent Technologies, Santa Clara, CA), with helium as the carrier gas. The injector temperature was 240 °C, and detector 280 °C. The four phospholipids with heptadecanoic acid (C17:0, Avanti Polar Lipids, Alabaster, AL) were added to the samples as internal standards to correct for recovery. Individual fatty acids were identified by comparing their retention times with authentic standards (NuChek Prep). Data were analyzed using ChemStation Firmware A.01.09 (Agilent).
Immunohistochemistry
Consecutive coronal fetal brain sections, 5 μm thick, selected from the middle to posterior regions of the fetal hippocampus from at least one fetus per dam, and at least five dams from each genotype and dietary treatment group, were used for immunohistochemical analyses of neural progenitor cell proliferation, calretinin expression, and neural cell apoptosis. Wrinkles on fetal brain paraffin sections were flattened by incubating the slides horizontally at 55–60 °C in an Isotemp oven for 10 min. Fetal brain sections that were damaged during sectioning or immunohistochemistry processing were excluded from the study.
Coronal sections were probed for phosphorylated histone H3 (phosphohistone H3), a specific marker for mitosis (11, 30). Slides were deparaffinized in fresh xylene three times for 20 min each, washed three times for 5 min each in absolute ethanol, then rehydrated gradually in 95% ethanol for 5 min, 70% ethanol with 0.25% ammonium hydroxide for 1 h, and 50% ethanol for 15 min. This was followed by three washes, each for 5 min, in PBS with 0.1% Tween 20 (PBST) (Sigma). Antigen retrieval was carried out for 20 min in 20 μg/ml of proteinase K (Sigma), followed by 40 min in 10 mg/ml of sodium borohydrate (Sigma), both steps at room temperature. A heat-induced antigen unmasking was done by incubating the slides in citric buffer, pH 6.0, at >90 °C in a microwave oven for 10 min. After cooling to room temperature and washing three times with PBST, nonspecific sites were blocked overnight with 10% nonimmune goat serum (Chemicon, Temecula, CA) in PBST. Brain sections were incubated overnight at 4 °C in rabbit anti-phosphohistone H3 antibody (Upstate, Lake Placid, NY) at a concentration of 2 μg/ml in blocking buffer (1:1000 dilution). Negative control sections were treated with non-immune goat serum instead of the primary antibody. Phosphohistone H3 expressing cells were detected using a Cy3-conjugated goat anti-rabbit IgG (Chemicon) at 1:1000 dilution after 2 h at room temperature. Nuclear DNA was counterstained with 0.1 μg/ml of 4′,6-diamidino-2-phenylindole (DAPI, Sigma) for 20 min at room temperature. Sections were mounted using 80% Tris-buffered glycerol, pH 7.0, and covered by a number 1 thickness coverglass. Images were acquired using a Microphot FXA Microscope (Nikon Instrument Group, Garden City, NY), which was equipped with a QImaging Micropublisher CCD camera for digital image acquisition by epifluorescence on an Apple IMAC computer. Different laser wavelengths were used for DAPI (359 nm), and for Cy3 (550 nm excitation and 570 nm emission). The total number of phosphorylated histone H3 positive cells were counted in two periventricular regions: adjoining the developing hippocampus and adjoining the developing cortex, beginning at the junction of the hippocampus and choroid plexus (hippocampal wedge). Cells were counted at a final magnification of ×100 in six to eight hippocampal hemispheres from three to four consecutive serial sections for each of the above mentioned regions, and the average number of proliferating neural progenitor cells per region in each fetus was calculated. Ventricular zone lengths were measured in calibrated images at the same magnification (×40) and resolution.
Coronal sections were probed for the expression of calretinin, a vitamin D-dependent protein involved in calcium signaling, and which is expressed by a subclass of GABAergic neurons when they differentiate (10). Slides were deparaffinized, rehydrated, subjected to antigen retrieval, and blocked as stated above. Brain sections were then incubated in rabbit anti-calretinin antibody (Chemicon) at a 1:2000 dilution in blocking buffer overnight at 4 °C. Sites of calretinin immunoreactivity were detected using a goat anti-rabbit Cy2-conjugated secondary antibody (Chemicon) in a 1:250 dilution in PBST, prepared fresh and incubated for 2 h at room temperature. Slides were counterstained and mounted as stated above. As an internal control, we monitored the calretinin immunoreactivity of the dorsal hypothalamic nucleus, a region of developing mouse brain that contains neurons expressing high levels of calretinin. Quantitative image analysis in the primordial dentate gyrus of the fetal hippocampus, specifically the putative outer marginal zone of the granular cell layer, using ×100 magnification, was performed on a confocal laser scanning microscope equipped with an integrating camera connected to a computer utilizing a Scion CG7 image capture card for digital image capture of standard and epifluorescence images, as described earlier (20). The laser wavelength at 359 nm was used for DAPI, and 492 nm excitation and 510 nm emission used for Cy2. The images were then analyzed using the Scion Image software program (Scion Corporation, Fredrick, MD), converting the pictures taken from the microscope to gray scale images, and then inverting them to obtain mean optical density, background, and the area of the selected region of interest. These measurements were used to calculate integrated optical density (IOD = (mean optical density − background) × area) for six to eight hemispheres from three to four serial sections, and an averaged value reported for calretinin expressed in the primordial dentate gyrus of each hippocampus hemisphere.
Activated cleaved caspase-3 immunoreactivity and terminal deoxynucleotidyl transferase dUTP nick end labeling (TUNEL) were used to detect apoptotic cells in paraffin-embedded fetal hippocampal coronal sections. After deparaffinization, rehydration, and antigen retrieval of fetal brain sections (as described for phosphohistone H3 and calretinin above), cleaved activated caspase-3 immunofluorescence labeling was assessed after overnight incubation with a primary rabbit monoclonal antibody to cleaved (activated) caspase-3 (Asp-175; Cell Signaling Technology, Beverly, MA) according to the manufacturer's protocol. Sections were incubated with goat Cy3-anti-rabbit IgG (Calbiochem, San Diego, CA) for 2 h at room temperature followed by counterstaining with 0.1 μg/ml of DAPI (Sigma) for 20 m. The activated caspase-3 positive cells in the fetal hippocampus were identified based on the presence of red fluorescent staining and scored using ×10 or 20 magnification with a Nikon fluorescence microscope. Two laser wavelengths were used (359 nm for DAPI, 550 nm excitation and 570 nm emission for Cy3). For the TUNEL-based assay, labeling was assessed according to the manufacturer's protocol (ApopTag® Plus Fluorescein In Situ Apoptosis Detection Kit S7111; Chemicon). Two laser wavelengths were used (359 nm for DAPI, 490 nm excitation and 520 nm emission for FITC). The number of apoptotic cells per hippocampus was counted in 4–8 brain hemispheres from 2 to 4 consecutive serial sections and averaged to obtain a mean single hemilateral value/hippocampal section/fetus.
Statistical Analysis
We used a two-way analysis of variance with and without interaction, followed by a pairwise comparison of the diets separately for each genotype. Statistical differences were determined using JMP software (V2, SAS Institute, Cary, NC). Data are presented as mean ± S.E.
RESULTS
Changes in brain phospholipids were examined in two ways, as changes in the distribution of fatty acid species present in individual phospholipids, and as changes in the concentrations of phospholipids. We observed significant differences in the fatty acid composition of the phospholipids in fetal brain from the Pemt−/− mice compared with the WT mice (Table 1). Pemt−/− mice had lower proportional fractions of DHA in all four phospholipids measured in fetal brain than did WT mice on the control diet (p < 0.05; Tables 1 and supplemental S1, S3, S5, and S7). Maternal supplementation with DHA during E11–E17 increased the proportional fraction of PtdCho-DHA and PtdIns-DHA in the fetal brains of the WT mice by ∼150% (p < 0.001; Table 1), and increased the proportional fraction of PtdEtn-DHA and PtdSer-DHA in fetal brains by ∼10%. DHA supplementation of the Pemt−/− dams increased the proportional fraction of DHA in several membrane phospholipids in the fetal brain (PtdSer-DHA to 135% of the fraction present in control diet; PtdEtn-DHA to 158%; PtdCho-DHA to 192%; and PtdIns-DHA to 220%; all values p < 0.01 different from those on control diet Table 1) so that these fractions were similar to, or higher than, those measured in WT on the control diet. In addition, the fatty acid species docosapentaenoic acid (22:5) was detected in PtdEtn and PtdSer fractions of the Pemt−/− but not in WT fetal brains (Table 1). Brain PtdEtn-18:1 was higher in the fetuses from the Pemt−/− mice on the control diet compared with WT (p < 0.01; Table 1), but returned to WT levels with DHA supplementation. In PtdEtn, PtdSer, and PtdIns of fetal brains, the arachidonic acid (20:4) species was higher in Pemt−/− compared with WT on the control diet (p < 0.01; Table 1), but maternal DHA supplementation decreased the proportional amount in Pemt−/− fetal brains (p < 0.05).
TABLE 1.
Proportion of fatty acid species present in phospholipids of fetal mouse brain
Wild type and Pemt−/− mice dams were fed either AIN-76 or DHA-supplemented diet at E11 to E17. Fetal brains were collected, phospholipids extracted and separated, and fatty acids quantified by gas chromatography. Data are presented as mean ± S.E., n = 5–10/group.
| AIN-76A diet |
DHA diet |
|||
|---|---|---|---|---|
| Pemt+/+ | Pemt−/− | Pemt+/+ | Pemt−/− | |
| g/100 g total fatty acids | ||||
| PtdCho | ||||
| 18:1 | 20.6 ± 1.0 | 19.5 ± 1.0 | 20.7 ± 0.8 | 20.5 ± 0.7 |
| 18:2 | 0.6 ± 0.1 | 0.9 ± 0.1a | 0.4 ± 0.1 | 0.7 ± 0.1b |
| 20:4 | 5.9 ± 0.4 | 6.7 ± 0.5 | 6.0 ± 0.2 | 5.8 ± 0.5 |
| 22:6 | 2.5 ± 0.1 | 1.3 ± 0.1c | 4.0 ± 0.2c | 2.5 ± 0.2 |
| PtdEtn | ||||
| 18:1 | 9.4 ± 0.1 | 11.1 ± 0.6d | 9.2 ± 0.1 | 9.4 ± 0.4 |
| 18:2 | NDe | 0.4 ± 0.2 | ND | 0.2 ± 0.1 |
| 20:4 | 19.7 ± 0.1d | 25.4 ± 0.8c | 17.6 ± 0.1d | 21.8 ± 0.3d |
| 22:5 | ND | 0.6 ± 0.1 | ND | 0.6 ± 0.1 |
| 22:6 | 26.1 ± 0.5 | 15.7 ± 0.9c | 28.9 ± 0.3d | 24.9 ± 0.5 |
| PtdSer | ||||
| 18:1 | 6.7 ± 0.2 | 9.0 ± 1.0a | 7.0 ± 0.1 | 7.9 ± 0.6 |
| 20:4 | 7.4 ± 0.3 | 10.6 ± 0.5c | 6.0 ± 0.1d | 8.2 ± 0.3 |
| 22:5 | ND | 0.2 ± 0.1 | ND | 0.4 ± 0.1 |
| 22:6 | 31.3 ± 0.2 | 23.1 ± 1.2c | 35.4 ± 0.2d | 31.3 ± 1.0 |
| PtdIns | ||||
| 18:1 | 6.1 ± 0.4 | 5.3 ± 0.6 | 5.2 ± 0.1 | 6.9 ± 0.6 |
| 20:4 | 39.8 ± 0.8 | 43.7 ± 0.7c | 38.2 ± 0.3 | 36.2 ± 0.8 |
| 22:6 | 7.0 ± 0.3d | 5.3 ± 0.3d | 10.6 ± 0.5 | 11.7 ± 0.3 |
a Different from WT on the AIN diet, p < 0.05.
b Different from Pemt−/− on AIN diet, p < 0.05.
c Different from all other groups, p < 0.01.
d Different from all other groups, p < 0.05.
e ND, none detected.
Although we observed the above changes in the fatty species present in PtdCho, the concentrations of PtdCho in fetal mouse brain were unchanged by genotype or diets (Table 2). PtdEtn concentrations were lower in the Pemt−/− mice than in WT (p < 0.05), and the DHA diet restored normal concentrations. PtdSer concentrations were lower in WT on the control diet than in the Pemt−/− groups or in the DHA-supplemented WT fetuses (Table 2, p < 0.05). PtdIns concentrations were lower on the AIN76 diet than on the DHA-supplemented diet (p < 0.05). Most of the DHA in phospholipids was in the PtdEtn and PtdSer phospholipids in fetal brain (Tables 2 and supplemental S2, S4, S6, and S8). The concentration of DHA bound to PtdCho, PtdSer, and PtdIns increased in fetal brains of both genotypes (p < 0.05) when DHA was added to the maternal diet (Table 2). For PtdCho-DHA, there was an interaction between genotype and diet (p = 0.0007). This was also true for PtdSer-DHA (p = 0.02), whereas PtdIns had interactions for arachidonic acid (20:4, p = 0.0006) and DHA (p = 0.0014). PtdEtn had genotype x diet interactions for oleic acid (18:1, p = 0.04), DHA (p < 0.0001), and total nanamole/g (p = 0.0002).
TABLE 2.
Concentrations of phospholipids and their DHA species in fetal mouse brain
Wild type and Pemt−/− mice dams were fed either AIN-76 or DHA-supplemented diet at E11 to E17. Fetal brains were collected, phospholipids extracted and separated, and fatty acids quantified by gas chromatography. Data are presented as mean ± S.E., n = 5/group.
| AIN-76A diet |
DHA diet |
|||
|---|---|---|---|---|
| Pemt+/+ | Pemt−/− | Pemt+/+ | Pemt−/− | |
| nmol/g tissue | ||||
| PtdCho | ||||
| 22:6 | 310 ± 16 | 183 ± 24a | 591 ± 24a | 297 ± 7 |
| Total | 17,052 ± 717 | 17,443 ± 781 | 19,462 ± 558 | 17,820 ± 392 |
| PtdEtn | ||||
| 22:6 | 3,466 ± 91 | 1,660 ± 154a | 3,286 ± 81 | 3,676 ± 291 |
| Total | 15,382 ± 337 | 12,385 ± 867 | 12,665 ± 333 | 16,869 ± 1,109b,c,d |
| PtdSer | ||||
| 22:6 | 839 ± 30 | 987 ± 102 | 1,205 ± 136 | 1,346 ± 161b |
| Total | 2,907 ± 93c | 4,908 ± 353b | 3,746 ± 417 | 4,885 ± 459 |
| PtdIns | ||||
| 22:6 | 17 ± 1 | 20 ± 4 | 52 ± 5b | 54 ± 7d |
| Total | 302 ± 9 | 468 ± 73b | 530 ± 34 | 676 ± 57d |
a Different from all other groups, p < 0.01.
b Different from WT on AIN diet, p < 0.05.
c Different from WT on DHA diet, p < 0.05.
d Different from Pemt−/− on AIN diet, p < 0.05.
On the AIN-76A diet, Pemt−/− fetal brains had 60% more neural progenitor cell proliferation (assessed by histone-3 phosphorylation) in the ventricular zone of the developing hippocampus and cortex (p < 0.05; Fig. 1) as compared with WT. Feeding the DHA supplemented diet to dams did not change neural progenitor cell proliferation in WT fetal brains, but decreased this proliferation in Pemt−/− fetal brains in both the hippocampal (p < 0.05) and cortical (p < 0.05) ventricular zones, such that values were no longer higher than those in fetal brains from WT dams on the control diet. There was an interaction between genotype and diet for neural progenitor cell proliferation in the hippocampus (p = 0.012) and cortex (p = 0.044) of fetal brains. On the control diet, Pemt−/− fetal brains had 30% less calretinin protein levels (a marker for differentiation of GABAergic neurons) in the primordial dentate gyrus as compared with fetuses from WT dams (p < 0.05; Fig. 2), however, DHA supplementation increased calretinin expression 2-fold in both genotypes (p < 0.05, Fig. 2).
FIGURE 1.

Proliferation of neural progenitor cells is increased in E17 Pemt−/− fetal mouse brain, and is restored to normal after maternal dietary DHA supplementation. Wild type (+/+) and Pemt−/− mice dams were fed either an AIN-76A (control) or DHA-supplemented diet from days E11 to E17, and fetal brains were collected. Coronal sections were prepared and neural cell proliferation was assessed using immunohistochemistry for phosphorylated histone 3 present in the ventricular zones lining the E17 fetal hippocampus and cortex as described under “Experimental Procedures.” Data are presented as mean ± S.E.; n = 5–7 per group. Bars with different letters differ significantly (p < 0.05). The ventricular zone length was equivalent in the tissue sections used (data not shown). Representative images of phosphorylated histone H3 positive (mitotic) cells in the ventricular zone of the hippocampus and cortex are shown for the four groups (×200 magnification). DAPI nuclear DNA counterstaining is blue, whereas the staining for Cy3-conjugated secondary antibody bound to the anti-phospho-histone H3 (Ser-10) primary antibody is yellow-pink.
FIGURE 2.

Maternal dietary DHA supplementation increases calretinin expression in E17 fetal mouse dentate gyrus. Wild type (+/+) and Pemt−/− mice dams were fed either an AIN-76A (control) or DHA-supplemented diet from days E11 to E17, and fetal brains were collected. Coronal sections were prepared and calretinin protein was stained by immunohistochemistry as described under “Experimental Procedures.” Integrated optical density (IOD) was then measured in primordial dentate gyrus (DG) of the E17 fetal hippocampus. Data are presented as mean ± S.E.; n = 5–9 per group. Bars with different letters differ significantly (p < 0.05); *, different from all other groups, p < 0.01. Representative images of calretinin expression are shown. The top panels show expression in E17 fetal mouse dentate gyrus and parafascicular nucleus at ×40 magnification. The remaining panels are representative images of calretinin expression in the dentate gyrus for the four experimental groups (×100 magnification). The DAPI nuclear DNA counterstaining is blue, whereas staining for Cy3-conjugated secondary antibody bound to the anti-calretinin primary antibody is yellow-pink.
Pemt−/− fetal hippocampi, from dams fed the control diet, had 1.6–2.5-fold increased neural cell apoptosis (assessed by caspase 3 activation or by TUNEL assay, respectively) compared with WT fed the control diet (p < 0.01; Figs. 3 and 4). Maternal dietary DHA supplementation decreased the high rates of apoptosis in the fetal hippocampus of the Pemt−/− mice so that they were similar to levels observed in WT on control diet (p < 0.01 for caspase results, p < 0.05 for TUNEL assay results; Figs. 3 and 4).
FIGURE 3.
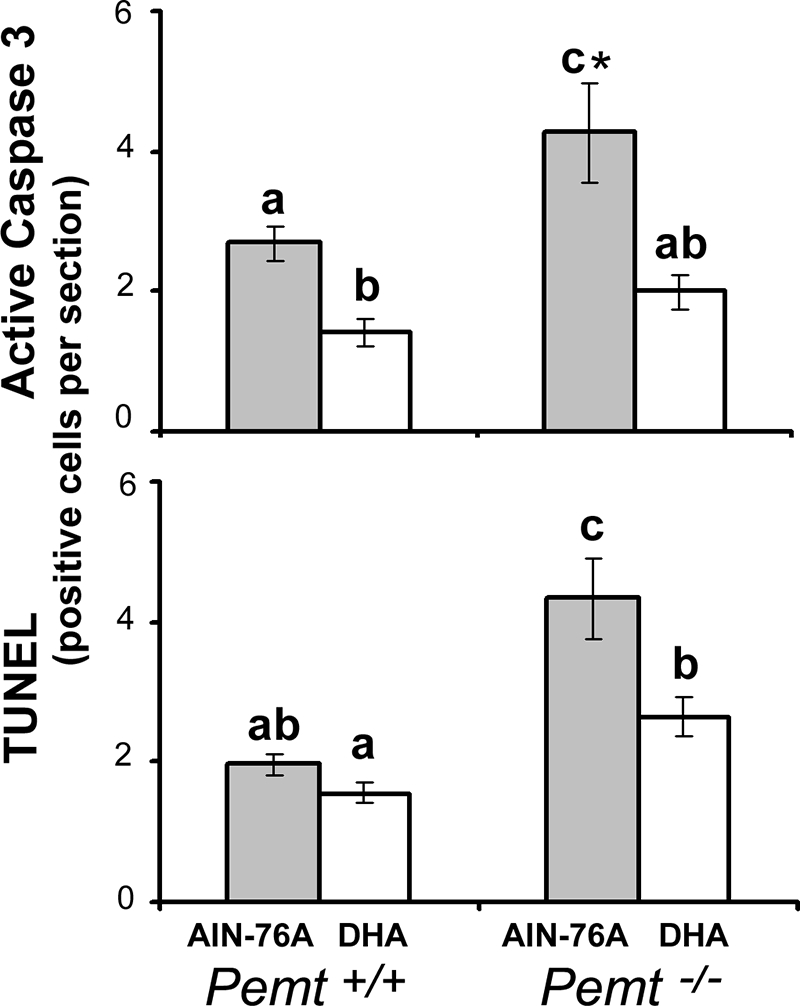
Maternal dietary DHA supplementation decreases apoptosis in the hippocampus of the E17 Pemt−/− fetal mouse brain. Wild type (+/+) and Pemt−/− mice dams were fed either an AIN-76A (control) or DHA-supplemented diet from days E11 to E17, and fetal brains were collected. Coronal sections were prepared and apoptotic neurons in fetal hippocampus were stained by immunohistochemistry for active cleaved caspase 3 and TUNEL-positive nuclei as described under “Experimental Procedures.” Data are presented as mean ± S.E.; n = 5–7 per group. Bars with different letters differ significantly (p < 0.05); *, different from all other groups, p < 0.01.
FIGURE 4.

Representative images of E17 fetal mouse hippocampus analyzed for apoptosis. As described in the legend to Fig. 3, wild type (+/+) and Pemt−/− mice dams were fed either an AIN-76A (control) or DHA-supplemented diet from days E11 to E17, and fetal brains were collected. Coronal sections were prepared and apoptotic neurons in fetal hippocampus were stained by immunohistochemistry for active cleaved caspase 3 or for TUNEL-positive nuclei as described under “Experimental Procedures.” The inset in each panel is a ×40 image of the whole hippocampus with a box framing the region shown in the higher magnification (×400) image. The DAPI nuclear DNA counterstaining is blue. A representative apoptotic cell is indicated by an arrow in each panel; staining for the Cy3-conjugated secondary antibody bound to the anti-active caspase 3 is yellow-pink and the TUNEL positive cells stain green.
DISCUSSION
We confirmed our earlier observation (20) that there are more proliferating neural progenitor cells in the fetal brain of Pemt−/− mice compared with WT mice (Fig. 1), and for the first time show that numbers of apoptotic cells in fetal hippocampus are higher in Pemt−/− mice (Fig. 3). Apoptosis has a critical role in determining the size of neuronal subpopulations, and therefore affects morphogenesis in developing brain regions (31). Also, we confirmed our earlier observation (20) that calretinin expression, a marker of neuronal differentiation, was diminished in Pemt−/− fetal brains compared with WT (Fig. 2). We suggest that these changes in fetal brain of Pemt−/− mice are, in part, related to differences in DHA-containing phospholipids in membranes (Tables 1 and 2) because maternal supplementation with DHA corrected the abnormally low amounts of DHA-containing phospholipids in Pemt−/− brain (Table 1) and prevented the change in neural progenitor cell proliferation (Fig. 1), as well as the increase in apoptosis seen in Pemt−/− fetal brains (Figs. 3 and 4). Moreover, DHA supplementation increased calretinin expression by 2-fold in both knock-out and WT brains (Fig. 2).
In a previous report (20), we suggested that the changes in fetal brain development seen in the Pemt−/− mouse were the result of changes in DNA methylation, which altered the gene expression required for neurogenesis and differentiation. However, there is a second possible mechanism for changes in fetal brain development seen in the Pemt−/− mouse. We had previously observed that these mice have substantially lower concentrations of DHA in plasma and liver PtdCho (19), and we now report that this also is the case in fetal brain (Tables 1 and 2). In addition, these mice have lower PtdEtn-DHA and PtdSer-DHA concentrations in brain (Tables 1 and 2). We hypothesized that diminished phospholipid-DHA, with resulting changes in membrane function and signaling, is an alternative mechanism for the changes in progenitor cell proliferation, differentiation, and apoptosis seen in the Pemt−/− mouse. If this is correct, then manipulations that correct phospholipid-DHA concentrations in the fetal brain would prevent the observed changes. Indeed, maternal supplementation with DHA abrogated the increase in neural progenitor cell proliferation seen in Pemt−/− fetal brains compared with WT (Fig. 1). This could be due to changes in membrane phospholipid-DHA concentrations, or to DHA interfering with a proliferation-signaling molecule (32). In human prostate cancer cell lines and in vascular endothelial cells, DHA treatment inhibited cell proliferation (33–35). Our supplemented diet contained 0.3% DHA, which was just enough to normalize the fetal brain phospholipid DHA in the knock-out mice, but was far less than the 1–5% DHA given in the above studies on cell proliferation. The dose used in published human clinical studies is 3 g/day in the diet (35). As cells differentiate, they decrease cell proliferation, and we found that DHA increased neuronal differentiation (as measured by expression of the protein calretinin in GABAergic neurons) 2-fold (Fig. 2). Other investigators reported that DHA is important for neuronal differentiation (8). However, we caution that the regions we examined in fetal dentate gyrus have very low basal calretinin expression (36), unlike the parafascicular nucleus (Fig. 2, top right panel), and small changes in this expression may not have physiological relevance.
Accumulation of PtdSer-DHA facilitates Raf-1 and Akt translocation/activation, thereby reducing neuronal apoptosis (37). DHA is preferentially taken up by neurons and incorporated into PtdSer-DHA, particularly as the 1-stearoly-2-docosahexaenoyl (18:0, 22:6) species (38); we found that the PtdSer that accumulated in the DHA-supplemented fetal brains had more 18:0 and DHA fatty acid species (supplemental Table S6), and suggest that this contributed to the decrease in apoptosis seen in DHA-treated Pemt−/− and WT fetal brains compared with those from dams fed the control diet (Figs. 3 and 4). Neuroprotectin, which is formed in glial cells from DHA and induces expression of neuroprotective and anti-apoptotic genes (8), also could mediate decreased apoptosis after DHA treatment, but is unlikely to play a role here because we found no expression of the mature glial cell marker glial fibrillary acidic protein in our fetal brains (data not shown).
Studies in humans report that DHA needed for fetal brain growth is derived from transplacental transfer of these fatty acids from the parent (39–41). Thus, feeding the pregnant dam more DHA should increase PtdCho-DHA concentrations in fetal brain. Indeed, PtdCho-DHA concentrations in fetal brain were increased by feeding DHA to pregnant dams of both genotypes (Tables 1 and 2). Increased availability of DHA increases PtdCho synthesis in fetal lung explants by a direct stimulatory effect of DHA on the rate-limiting enzyme in the pathway, CTP:choline cytidylyltransferase (42), and if the same effect occurs in fetal brain, it may contribute to the changes in PtdCho-DHA that we report. Other studies reported that increasing maternal dietary DHA increased DHA content of PtdEtn and PtdSer of whole brain glial cells in rat pups (43). We found this to be true, along with similar effects on PtdIns-DHA, in fetal brains from the Pemt−/− pups whose dams were fed a diet supplemented with DHA (Tables 1 and 2). PtdCho-DHA made in maternal liver is secreted as lipoproteins by liver and eventually delivered to the fetal brain, and is a major source of the DHA incorporated into the phospholipids of the fetal brain. In Pemt−/− dams this PtdCho-DHA is not formed in the liver and is not delivered to the fetus; thus, we find that docosapentaenoic acid (22:5) accumulates in PtdEtn and PtdSer of Pemt−/− but not in the WT fetal brain (Table 1); docosapentaenoic acid is incorporated in brain phospholipids when there is insufficient DHA available (8).
In the fetal brain from Pemt−/− mice, we observed a decrease in PtdCho-DHA concentrations without a concomitant increase in PtdEtn-DHA concentrations (Table 2). In liver this would be surprising, as PtdEtn-DHA is three times methylated by PEMT to form PtdCho (44). However, in brain, PEMT activity is low, and much of the PtdCho-DHA in the fetal brain is derived from uptake of phospholipids originally synthesized in the maternal liver. Once in the brain, the DHA in PtdCho is fungible, and can distribute among many phospholipids. PtdCho can be converted to PtdSer by phosphatidylserine synthase 1 (18) and PtdEtn can be converted to PtdSer by another serine base exchange enzyme, phosphatidylserine synthase 2 (18). PtdSer can be decarboxylated to form PtdEtn (8, 18). This could account for the observed increase in PtdSer pools in the Pemt−/− fetal brains (Table 2) despite no accumulation of PtdEtn, nor appreciable change in PtdCho concentration, in the absence of PEMT.
These observations suggest a potential common mechanism whereby the metabolic pathways for two nutrients interact to modify brain development. The activity of PEMT produces a membrane phospholipid that contains both choline and DHA. Varying maternal dietary choline intake in rats and mice during pregnancy causes significant and irreversible changes in hippocampal progenitor cell proliferation, neuronal apoptosis, and neuronal differentiation (11, 45, 46), as well as hippocampal function in the adult rodent, including altered long term potentiation (47–49) and altered memory (50–55). DHA is important as well for normal brain and retinal development; reduced DHA is associated with impairments in cognitive and behavioral performance (39). These studies in mice have relevance to humans. There are a number of common single nucleotide polymorphisms (SNPs) in the PEMT gene in humans (56), and at least one that diminishes PEMT activity (57). We observed that women who are homozygous for a SNP in the promoter region of PEMT (rs12325817; 74% of people in Chapel Hill have one variant allele for this SNP and 14% are homozygous variant (56, 58)) are much more susceptible to dietary choline deficiency (odds ratio 25, p = 0.002) than are those without the SNP (56, 58). This gene is induced by estrogen (59) and the SNP occurs in the estrogen response element of the gene.3 Individuals with this PEMT SNP have diminished plasma PtdCho-DHA concentrations,4 as would be predicted from our current studies in mice. We do not know whether pregnant women with PEMT SNPs are more likely to have babies with abnormal brain development, or whether DHA supplementation would alter that development. It is interesting that women in the lowest quartile of dietary choline intake have 4-fold the risk of having a baby with a neural tube defect (12).
In conclusion, our study demonstrates that maternal supplementation with DHA can modulate some aspects of abnormal hippocampal development in the Pemt−/− mouse fetus. Our study suggests a novel mechanism whereby choline and DHA metabolism are intertwined, and this mechanism could underlie some of the observed effects of choline on brain development. We are reporting an interesting association between loss of PEMT activity and diminished brain phospholipid-DHA concentrations and changes in neurogenesis and apoptosis. These observations could be important in humans because a large portion of the population have functional SNPs in the PEMT gene.
Supplementary Material
Acknowledgments
We thank Alyssa Gulledge, Meng Hong, and Joseph Galanko for assistance in this study.
This work was supported, in whole or in part, by National Institutes of Health Grants AG09525, DK55865, and DK56350 (to S. H. Z.) and Grant DK034987 to the University of North Carolina Histology Core.

The on-line version of this article (available at http://www.jbc.org) contains supplemental Tables S1–S8.
M. E. Resseguie, K. da Costa, J. A. Galanko, J. J. Davis, and S. H. Zeisel, manuscript in preparation.
K. da Costa, L. M. Sanders, L. M. Fischer, and S. H. Zeisel, unpublished data.
- DHA
- docosahexaenoic acid
- PtdEtn
- phosphatidylethanolamine
- PtdSer
- phosphatidylserine
- PEMT
- phosphatidylethanolamine-N-methyltransferase
- PtdCho
- phosphatidylcholine
- PtdIns
- phosphatidylinositol
- DAPI
- 4′,6-diamidino-2-phenylindole
- TUNEL
- terminal deoxynucleotidyl transferase dUTP nick end labeling
- SNP
- single nucleotide polymorphism
- WT
- wild type
- E
- embryonic day
- PBS
- phosphate-buffered saline.
REFERENCES
- 1.Institute of Medicine Food and Nutrition Board (1998) in Dietary Reference Intakes for Thiamin, Riboflavin, Niacin, Vitamin B6, Folate, Vitamin B12, Panthothenic Acid, Biotin, and Choline, pp. 390–422, National Academy Press, Washington, D. C. [PubMed] [Google Scholar]
- 2.Innis S. M. (2007) J. Nutr. 137, 855–859 [DOI] [PubMed] [Google Scholar]
- 3.Zeisel S. H. (2006) Annu. Rev. Nutr. 26, 229–250 [DOI] [PMC free article] [PubMed] [Google Scholar]
- 4.Bazan N. G., Scott B. L. (1990) Upsala J. Med. Sci. Suppl. 48, 97–107 [PubMed] [Google Scholar]
- 5.Cherian G., Sim J. (1992) Poult. Sci. 71, 1658–1668 [DOI] [PubMed] [Google Scholar]
- 6.Green P., Yavin E. (1996) Lipids 31, (suppl.) S235–S238 [DOI] [PubMed] [Google Scholar]
- 7.Tam O., Innis S. M. (2006) Dev. Neurosci. 28, 222–229 [DOI] [PubMed] [Google Scholar]
- 8.Kim H. Y. (2007) J. Biol. Chem. 282, 18661–18665 [DOI] [PubMed] [Google Scholar]
- 9.Albright C. D., Mar M. H., Craciunescu C. N., Song J., Zeisel S. H. (2005) Brain Res. Dev. Brain Res. 159, 149–154 [DOI] [PMC free article] [PubMed] [Google Scholar]
- 10.Albright C. D., Siwek D. F., Craciunescu C. N., Mar M. H., Kowall N. W., Williams C. L., Zeisel S. H. (2003) Nutr. Neurosci. 6, 129–134 [DOI] [PubMed] [Google Scholar]
- 11.Craciunescu C. N., Albright C. D., Mar M. H., Song J., Zeisel S. H. (2003) J. Nutr. 133, 3614–3618 [DOI] [PMC free article] [PubMed] [Google Scholar]
- 12.Shaw G. M., Carmichael S. L., Yang W., Selvin S., Schaffer D. M. (2004) Am. J. Epidemiol. 160, 102–109 [DOI] [PubMed] [Google Scholar]
- 13.Shaw G. M., Carmichael S. L., Laurent C., Rasmussen S. A. (2006) Epidemiology 17, 285–291 [DOI] [PubMed] [Google Scholar]
- 14.Niculescu M. D., Craciunescu C. N., Zeisel S. H. (2005) Brain Res. Mol. Brain Res. 134, 309–322 [DOI] [PubMed] [Google Scholar]
- 15.Niculescu M. D., Craciunescu C. N., Zeisel S. H. (2006) FASEB J. 20, 43–49 [DOI] [PMC free article] [PubMed] [Google Scholar]
- 16.Ridgway N. D., Vance D. E. (1992) Methods Enzymol. 209, 366–374 [DOI] [PubMed] [Google Scholar]
- 17.DeLong C. J., Shen Y. J., Thomas M. J., Cui Z. (1999) J. Biol. Chem. 274, 29683–29688 [DOI] [PubMed] [Google Scholar]
- 18.Vance J. E. (2008) J. Lipid Res. 49, 1377–1387 [DOI] [PubMed] [Google Scholar]
- 19.Watkins S. M., Zhu X., Zeisel S. H. (2003) J. Nutr. 133, 3386–3391 [DOI] [PubMed] [Google Scholar]
- 20.Zhu X., Mar M. H., Song J., Zeisel S. H. (2004) Brain Res. Dev. Brain Res. 149, 121–129 [DOI] [PubMed] [Google Scholar]
- 21.Stead L. M., Brosnan J. T., Brosnan M. E., Vance D. E., Jacobs R. L. (2006) Am. J. Clin. Nutr. 83, 5–10 [DOI] [PubMed] [Google Scholar]
- 22.Zhu X., Zeisel S. H. (2005) Brain Res. Mol. Brain Res. 134, 239–255 [DOI] [PubMed] [Google Scholar]
- 23.Baur F. J., Jr., Brown J. B. (1945) J. Am. Chem. Soc. 67, 1899–1900 [Google Scholar]
- 24.Park J. J., Baum M. J., Paredes R. G., Tobet S. A. (1996) J. Neurobiol. 30, 315–328 [DOI] [PubMed] [Google Scholar]
- 25.Miyama S., Takahashi T., Nowakowski R. S., Caviness V. S., Jr. (1997) Cereb. Cortex 7, 678–689 [DOI] [PubMed] [Google Scholar]
- 26.Jacobowitz D., Abbott L. (1998) Chemoarchitectonic Atlas of the Developing Mouse Brain, CRC Press, Boca Raton, FL [Google Scholar]
- 27.Bligh E. G., Dyer W. J. (1959) Can J. Biochem. Physiol. 37, 911–917 [DOI] [PubMed] [Google Scholar]
- 28.Chen C. T., Ma D. W., Kim J. H., Mount H. T., Bazinet R. P. (2008) J. Lipid Res. 49, 147–152 [DOI] [PubMed] [Google Scholar]
- 29.Tacconi M., Wurtman R. J. (1985) J. Neurochem. 45, 805–809 [DOI] [PubMed] [Google Scholar]
- 30.Shibata K., Inagaki M., Ajiro K. (1990) Eur. J. Biochem. 192, 87–93 [DOI] [PubMed] [Google Scholar]
- 31.Kuan C. Y., Roth K. A., Flavell R. A., Rakic P. (2000) Trends Neurosci. 23, 291–297 [DOI] [PubMed] [Google Scholar]
- 32.Denkins Y., Kempf D., Ferniz M., Nileshwar S., Marchetti D. (2005) J. Lipid Res. 46, 1278–1284 [DOI] [PubMed] [Google Scholar]
- 33.Tang X. H., Suh M. J., Li R., Gudas L. J. (2007) J. Lipid Res. 48, 165–176 [DOI] [PubMed] [Google Scholar]
- 34.Narayanan N. K., Narayanan B. A., Reddy B. S. (2005) Inl. J. Oncology 26, 785–792 [PubMed] [Google Scholar]
- 35.Harris W. S., Mozaffarian D., Lefevre M., Toner C. D., Colombo J., Cunnane S. C., Holden J. M., Klurfeld D. M., Morris M. C., Whelan J. (2009) J. Nutr. 139, 804S–819S [DOI] [PMC free article] [PubMed] [Google Scholar]
- 36.Fan X., Warner M., Gustafsson J. A. (2006) Proc. Natl. Acad. Sci. U.S.A. 103, 19338–19343 [DOI] [PMC free article] [PubMed] [Google Scholar]
- 37.Akbar M., Calderon F., Wen Z., Kim H. Y. (2005) Proc. Natl. Acad. Sci. U.S.A. 102, 10858–10863 [DOI] [PMC free article] [PubMed] [Google Scholar]
- 38.Guo M., Stockert L., Akbar M., Kim H. Y. (2007) J. Mol. Neurosci. 33, 67–73 [DOI] [PubMed] [Google Scholar]
- 39.Innis S. M. (2007) Early Hum. Dev. 83, 761–766 [DOI] [PubMed] [Google Scholar]
- 40.Muthayya S., Dwarkanath P., Thomas T., Ramprakash S., Mehra R., Mhaskar A., Mhaskar R., Thomas A., Bhat S., Vaz M., Kurpad A. V. (2009) Eur. J. Clin. Nutr. 63, 340–346 [DOI] [PubMed] [Google Scholar]
- 41.Lucia Bergmann R., Bergmann K. E., Haschke-Becher E., Richter R., Dudenhausen J. W., Barclay D., Haschke F. (2007) J. Perinat. Med. 35, 295–300 [DOI] [PubMed] [Google Scholar]
- 42.Mallampalli R. K., Salome R. G., Spector A. A. (1994) Am. J. Physiol. 267, L641–L648 [DOI] [PubMed] [Google Scholar]
- 43.Bowen R. A., Clandinin M. T. (2005) Br. J. Nutr. 93, 601–611 [DOI] [PubMed] [Google Scholar]
- 44.Ridgway N. D., Vance D. E. (1988) J. Biol. Chem. 263, 16856–16863 [PubMed] [Google Scholar]
- 45.Albright C. D., Friedrich C. B., Brown E. C., Mar M. H., Zeisel S. H. (1999) Brain Res. Dev. Brain Res. 115, 123–129 [DOI] [PubMed] [Google Scholar]
- 46.Albright C. D., Tsai A. Y., Friedrich C. B., Mar M. H., Zeisel S. H. (1999) Brain Res. Dev. Brain Res. 113, 13–20 [DOI] [PubMed] [Google Scholar]
- 47.Pyapali G. K., Turner D. A., Williams C. L., Meck W. H., Swartzwelder H. S. (1998) J. Neurophysiol. 79, 1790–1796 [DOI] [PubMed] [Google Scholar]
- 48.Montoya D. A., White A. M., Williams C. L., Blusztajn J. K., Meck W. H., Swartzwelder H. S. (2000) Brain Res. Dev. Brain Res. 123, 25–32 [DOI] [PubMed] [Google Scholar]
- 49.Jones J. P., Meck W. H., Williams C. L., Wilson W. A., Swartzwelder H. S. (1999) Brain Res. Dev. Brain Res. 118, 159–167 [DOI] [PubMed] [Google Scholar]
- 50.Meck W. H., Williams C. L. (1997) Neuroreport 8, 3053–3059 [DOI] [PubMed] [Google Scholar]
- 51.Meck W. H., Williams C. L. (1997) Neuroreport 8, 2831–2835 [DOI] [PubMed] [Google Scholar]
- 52.Meck W. H., Williams C. L. (1997) Neuroreport 8, 3045–3051 [DOI] [PubMed] [Google Scholar]
- 53.Meck W. H., Smith R. A., Williams C. L. (1989) Behav. Neurosci. 103, 1234–1241 [DOI] [PubMed] [Google Scholar]
- 54.Meck W. H., Smith R. A., Williams C. L. (1988) Dev. Psychobiol. 21, 339–353 [DOI] [PubMed] [Google Scholar]
- 55.Meck W. H., Williams C. L. (1999) Brain Res. Dev. Brain Res. 118, 51–59 [DOI] [PubMed] [Google Scholar]
- 56.da Costa K. A., Kozyreva O. G., Song J., Galanko J. A., Fischer L. M., Zeisel S. H. (2006) FASEB J. 20, 1336–1344 [DOI] [PMC free article] [PubMed] [Google Scholar]
- 57.Song J., da Costa K. A., Fischer L. M., Kohlmeier M., Kwock L., Wang S., Zeisel S. H. (2005) FASEB J. 19, 1266–1271 [DOI] [PMC free article] [PubMed] [Google Scholar]
- 58.Fischer L. M., daCosta K. A., Kwock L., Stewart P. W., Lu T. S., Stabler S. P., Allen R. H., Zeisel S. H. (2007) Am. J. Clin. Nutr. 85, 1275–1285 [DOI] [PMC free article] [PubMed] [Google Scholar]
- 59.Resseguie M., Song J., Niculescu M. D., da Costa K. A., Randall T. A., Zeisel S. H. (2007) FASEB J. 21, 2622–2632 [DOI] [PMC free article] [PubMed] [Google Scholar]
Associated Data
This section collects any data citations, data availability statements, or supplementary materials included in this article.