

Abstract
Factor H (FH) regulates the activation of C3b in the alternative complement pathway, both in serum and at host cell surfaces. It is composed of 20 short complement regulator (SCR) domains. The Y402H polymorphism in FH is a risk factor for age-related macular degeneration. C-reactive protein (CRP) is an acute phase protein that binds Ca2+. We established the FH-CRP interaction using improved analytical ultracentrifugation (AUC), surface plasmon resonance (SPR), and synchrotron x-ray scattering methods. Physiological FH and CRP concentrations were used in 137 mm NaCl and 2 mm Ca2+, in which the occurrence of denatured CRP was avoided. In solution, AUC revealed FH-CRP binding. The FH-CRP interaction inhibited the formation of higher FH oligomers, indicating that CRP blocked FH dimerization sites at both SCR-6/8 and SCR-16/20. SPR confirmed the FH-CRP interaction and its NaCl concentration dependence upon using either immobilized FH or CRP. The SCR-1/5 fragment of FH did not bind to CRP. In order of increasing affinity, SCR-16/20, SCR-6/8 (His-402), and SCR-6/8 (Tyr-402) fragments bound to CRP. X-ray scattering showed that FH became more compact when binding to CRP, which is consistent with CRP binding at two different FH sites. We concluded that FH and CRP bind at elevated acute phase concentrations of CRP in physiological buffer. The SCR-16/20 site is novel and indicates the importance of the FH-CRP interaction for both age-related macular degeneration and atypical hemolytic uremic syndrome.
Introduction
Factor H (FH)5 is a 154-kDa plasma glycoprotein composed of 20 short complement regulator (SCR) domains that protects the host during complement activation (Fig. 1). Its primary role is to regulate the alternative pathway C3 convertase C3bBb and its C3b component both in plasma and at host cell surfaces. FH binds to C3b and acts as a cofactor for the factor I-mediated proteolytic inactivation of C3b to iC3b (1, 2). FH also competes with factor B in binding to C3b to form the alternative pathway C3 convertase C3bBb (3) and accelerates the decay of the C3 convertase C3bBb (2, 4). FH makes the initial contact with host cells through the C-terminal SCR-20 domain; this is followed by N-terminal regulatory activity (5, 6). Polymorphisms and mutations in FH are associated with age-related macular degeneration (AMD) and atypical hemolytic uremic syndrome (aHUS), suggesting that impaired control of complement activation in the retina and the kidney endothelium, respectively, is involved in these diseases. The distribution of over 100 genetic alterations in FH leading to AMD or aHUS is summarized elsewhere (7). Although a common Y402H FH polymorphism is an established risk factor for AMD, the molecular mechanism of this polymorphism in causing AMD remains unclear. In physiological buffer, FH is principally monomeric and co-exists with as much as 15% dimeric FH in a rapid equilibrium that is NaCl-concentration dependent. In addition, FH forms a less reversible series of larger oligomers at high FH concentrations (8, 9).
FIGURE 1.

Electrostatic views of FH and CRP. Red denotes acidic regions, and blue denotes basic regions. Both FH and CRP are drawn to the same scale. The solution structural model for FH in 137 mm NaCl (Protein Data Bank code 3gav) is shown as three fragments that are each rotated individually to display the large basic surfaces at SCR-7, SCR-13, and SCR-20 more clearly. No specific proximity arrangement between nonadjacent SCR domains in FH is implied by this view, only that the SCR domains are generally folded back. All 20 SCR domains are numbered. The front and back views of the crystal structure of pentameric CRP (Protein Data Bank code 1b09) are shown as the A-face and B-face. The locations of calcium on the B-face are shown in yellow in a ribbon view of CRP. The basic surfaces of FH may interact with a preponderance of acidic surfaces on CRP when this is bound to cell surfaces.
C-reactive protein (CRP) is a 115-kDa acute phase protein (Fig. 1). Native CRP is unglycosylated and is a stable pentamer formed by noncovalently linked protomers in which assembly is stabilized by 2.5 mm Ca2+ present in plasma (10–13). In physiological buffer, CRP exists in rapid pentamer-decamer equilibrium (see accompanying article (13)). CRP binds to phosphocholine at its Ca2+ binding site (11) and to phosphoethanolamine, microbial surface proteins, chromatin, histones, fibronectin, small nuclear ribonucleoproteins, laminin, and polycations (14). These CRP-ligand interactions recognize damaged or apoptotic cells and bacterial pathogens (11, 14). CRP activates complement by the classical pathway (15). Even though CRP is also reported to bind inhibitory complement regulators such as FH (16, 17), the basis of such an interaction is less clear and appears to contradict CRP activation of complement by the classical pathway. Interestingly, individuals who are homozygous for the AMD risk His-402 FH allotype show a 2.5-fold higher level of CRP in the retinal pigmental epithelium (18).
FH possesses a partially folded back SCR domain arrangement in solution (9). A typical FH structure is represented in Fig. 1, which should not be used to predict specific inter-SC orientations within FH. A FH-CRP interaction is suggested by large basic surfaces at SCR-7, SCR-13, and SCR-20 of FH, which are visible in views when its structure is orientated to show these (Fig. 1). These basic surfaces may interact with acidic surfaces on CRP. However, experimental studies with CRP are complicated by the ease with which CRP becomes denatured, for example, by the removal of Ca2+, given that Ca2+ binds to CRP with a moderate dissociation constant (KD) of 60 μm (13, 19). The abnormally modified forms of CRP created by Ca2+ removal have functional properties that are very different from the highly stable CRP pentamer. The first evidence for a FH-CRP interaction came from ELISAs using plastic-immobilized CRP and surface plasmon resonance (SPR) analyses showing that FH SCR-7 and SCR-8/11 bind to immobilized CRP (16, 17). Since that time, FH binding to immobilized CRP has been demonstrated repeatedly in ELISAs in which the wild-type FH (Tyr-402) allotype binds more strongly than the His-402 allotype (20–25). If these findings were true, this difference would represent a molecular mechanism that leads to AMD. However recent ELISAs and analytical ultracentrifugation (AUC) analyses suggest that no FH-CRP interaction occurred and that those earlier observations of the FH-CRP interaction resulted from the use of denatured CRP (26, 27).
To clarify whether the FH-CRP interaction exists, we have studied this interaction in solution and on surfaces using the combination of AUC, SPR, x-ray scattering, and molecular modeling established in our previous studies (28–30). The study of CRP alone showed the importance of exploring a full CRP concentration range in 140 mm NaCl and 2 mm Ca2+ (13). In several earlier studies of the FH-CRP interaction using immobilized CRP (Table 1), Ca2+ was either omitted or not specified, or it was present at a low concentration. In addition, FH concentrations were close to either 1 or 0.01 μm, indicating two very different FH-CRP affinities. Here, we worked under conditions at which CRP forms native stable pentamers (13). We show that FH binds to native CRP at acute phase concentration levels in both the solution and surface phases with Ca2+ present and in a NaCl concentration-dependent manner. We report a large difference between the native SCR-6/8 (Tyr-402) and mutant SCR-6/8 (His-402) allotypes of FH in binding to native CRP on surfaces, as well as a previously unknown second CRP binding site at the C terminus of FH. The importance of using the correct buffers and concentrations to study FH-CRP interactions is emphasized. Our results provide a novel insight into the involvement of FH and CRP in both AMD and aHUS and into the role of the newly identified CRP site in SCR-16/20.
TABLE 1.
Comparison of buffer conditions used in 11 studies of the FH-CRP interaction
NA, not available, i.e. either the calcium concentration or the buffer was not stated; NR, not relevant, i.e. the technique is solution phase, or FH is being immobilized; SEC, size exclusion chromatography; PBS, phosphate-buffered saline; VBS, veronal-buffered saline; PC-KLH, phosphorylcholine conjugated to keyhole limpet hemocyanin.
| Study no. | Technique | Immobilized phase | Ca2+ | Fluid phase | Concentration | Concentration | [Ca2+] | Buffer | Ref. |
|---|---|---|---|---|---|---|---|---|---|
| mg/ml | μm | mm | |||||||
| 1 | ELISA | CRP | NA | FH | 0.00–0.01 | 0.0–0.06 | NA | NA | Ref. 16 |
| 2 | SPR | CRP | No | FH | 0.25 | 1.6 | 0.67 | 1/3 VBS (49 mm NaCl) | Ref. 17 |
| SPR | CRP | No | SCR-1/5 | 0.027 | 0.8 | 0.67 | 1/3 VBS (49 mm NaCl) | Ref. 17 | |
| SPR | CRP | No | SCR-1/6 | 0.105 | 1.1 | 0.67 | 1/3 VBS (49 mm NaCl) | Ref. 17 | |
| SPR | CRP | No | SCR-1/7 | 0.05 | 0.9 | 0.67 | 1/3 VBS (49 mm NaCl) | Ref. 17 | |
| SPR | CRP | No | SCR-8/11 | 0.05 | 1.6 | 0.67 | 1/3 VBS (49 mm NaCl) | Ref. 17 | |
| SPR | CRP | No | SCR-8/20 | 0.045 | 0.4 | 0.67 | 1/3 VBS (49 mm NaCl) | Ref. 17 | |
| SPR | CRP | No | SCR-15/20 | 0.045 | 1.0 | 0.67 | 1/3 VBS (49 mm NaCl) | Ref. 17 | |
| SPR | FH | NR | CRP | 0.037 | 0.3 | 0.67 | 1/3 VBS (49 mm NaCl) | Ref. 17 | |
| ELISA | CRP | No | FH | 0.001 | 0.01 | 1 | VBS (147 mm NaCl) | Ref. 17 | |
| 3 | SPR | CRP | No | SCR-6/8 Tyr-402 | 0.1–0.5 | 6–20 | NA | 10 mm HEPES, 150 mm NaCl | Ref. 20 |
| SCR-6/8 His-402 | 0.1–0.5 | 5–21 | |||||||
| 4 | ELISA | CRP | NA | FH | 0.00006–0.0015 | 0.00–0.01 | NA | VBS (147 mm NaCl) | Ref. 21 |
| ELISA | CRP | NA | SCR-5/7 | 0.0002–0.005 | 0.01–0.2 | NA | VBS (147 mm NaCl) | Ref. 21 | |
| 5 | ELISA | CRP | No | FH | 0–0.001 | 0.00–0.01 | 2 | 50 mm HEPES, 100 mm NaCl | Ref. 22 |
| ELISA | CRP | No | SCR-6/8 | 0–0.001 | 0.0–0.01 | 2 | 50 mm HEPES, 100 mm NaCl | Ref. 22 | |
| SPR | CRP | No | SCR-6/8 Tyr-402 | 0.0–0.05 | 0.0–2.3 | 2.5 | 10 mm HEPES-KOH, 150 mm NaCl | Ref. 22 | |
| SCR-6/8 His-402 | 0.0–0.05 | 0.0–2.3 | |||||||
| 6 | ELISA | CRP | NA | FH | 0.001 | 0.01 | NA | PBS (137 mm NaCl) | Ref. 23 |
| 7 | ELISA | CRP | No | FH | 0.00–0.01 | 0–0.05 | 2 | 20 mm HEPES, 140 mm NaCl | Ref. 24 |
| 8 | ELISA | CRP | No | FH | 0–0.1 | 0–0.6 | NA | NA | Ref. 25 |
| 9 | ELISA | CRP | No | FH | 0.0005–0.001 | 0.003–0.01 | 5 | 25 mm Tris (154 mm NaCl) | Ref. 26 |
| ELISA | PC-KLH-CRP | Yes | FH | 0.0005–0.001 | 0.003–0.01 | 5 | 25 mm Tris (154 mm NaCl) | Ref. 26 | |
| ELISA | FH | NR | CRP | 0.01 | 0.1 | 5 | 25 mm Tris (154 mm NaCl) | Ref. 26 | |
| 10 | AUC | NR | NR | CRP, FH | 0.4 (0.2, 0.2)a | 1.7, 1.3a | 0.3 | VBS (146 mm NaCl) | Ref. 27 |
| SEC | NR | NR | CRP, FH | 2 (1, 1)a | 8.7, 6.5a | 0.3 | VBS (146 mm NaCl) | Ref. 27 | |
| ELISA | CRP | Yes | FH | 0.005–0.1 | 0.03–0.6 | 0.3 | VBS (146 mm NaCl) | Ref. 27 | |
| ELISA | FH | NR | CRP | 0.001–0.1 | 0.01–0.9 | 0.3 | VBS (146 mm NaCl) | Ref. 27 | |
| 11 | AUC | NR | NR | CRP, FH | 0.3–2.5 (0.2–1.4, 0.1–1.1)a | 1.7–12.2, 0.6–7.1a | 2 | 10 mm Tris (137 mm NaCl); 10 mm Tris (50 mm NaCl) | This study |
| SPR | FH | NR | CRP | 0.01–3.5 | 0.1–30 | 2 | 10 mm Tris (137 mm NaCl); 10 mm HEPES (50 mm NaCl) | This study | |
| SPR | CRP | Yes | FH | 0.02–2.3 | 0.1–15 | 2 | 10 mm Tris (137 mm NaCl); 10 mm HEPES (50 mm NaCl) | This study | |
| SPR | CRP | Yes | SCR-16/20 | 0.2–2.1 | 5–50 | 2 | 10 mm HEPES (137 mm NaCl); 10 mm HEPES (50 mm NaCl) | This study | |
| SPR | CRP | Yes | SCR-6/8 | 0.1–0.4 | 5–20 | 2 | 10 mm HEPES (137 mm NaCl); 10 mm HEPES (50 mm NaCl) | This study | |
| X-ray scattering | NR | NR | CRP, FH | 0.7–1.8 (0.3–0.8, 0.4–1.0)a | 2.6–7.0, 2.6–6.5a | 2 | 10 mm HEPES (137 mm NaCl) | This study | |
a The first set of values is for CRP, and the second is for FH.
EXPERIMENTAL PROCEDURES
Purification of FH and CRP
Native FH was purified and concentrated from a pool of recently outdated anonymized human plasma using monoclonal MRC-OX23 Sepharose affinity column; its activity was demonstrated by C3u cleavage (8, 31, 32). SCR-1/5 and SCR-16/20 were expressed as a His6-tagged product in Pichia pastoris and purified using nickel affinity and size exclusion chromatography (33). SCR-1/5 is not glycosylated, whereas SCR-16/20 has at least one glycosylation site (33). Functional activity of SCR-16/20 was shown by its involvement in FH dimerization and its interactions with C3d (30). SCR-6/8 was expressed and purified following previously established procedures (34).6 Human CRP was isolated, purified, and characterized as described previously (27, 35). For AUC, samples were extensively dialyzed into TBS buffers (Tris-buffered saline; 10 mm Tris, 2 mm CaCl2, pH 8.0) containing 50 mm NaCl or 137 mm NaCl. For SPR, HBS buffers were used (HEPES-buffered saline; 10 mm HEPES, 2 mm CaCl2, pH 8.0) with 50 mm NaCl or 137 mm NaCl. Proteins were routinely analyzed by SDS-PAGE before and after experiments to confirm their integrity. The FH amino acid composition was taken from its sequence (Swiss-Prot accession code P08603). The glycosylation of FH was taken to be eight biantennary oligosaccharides located at SCR-9, SCR-12, SCR-13, SCR-14, SCR-15 (two sites), SCR-17, and SCR-18; note that SCR-4 is not glycosylated (36). This composition resulted in a calculated FH molecular mass of 154.4 kDa, an unhydrated volume of 193.1 nm3, a hydrated volume of 256.2 nm3 (based on a hydration of 0.3 g of H2O/g of glycoprotein and an electrostricted volume of 0.0245 nm3/bound water molecule), a partial specific volume (v̄) of 0.715 ml/g, and an absorption coefficient at 280 nm (1%, 1-cm path length) of 16.2 (13, 37). The CRP amino acid composition was taken from its sequence (Swiss-Prot accession number P02741). The CRP concentration was determined using an absorption coefficient of 17.5 (1%, 280 nm, 1 cm-path length) (38). CRP is unglycosylated and has a calculated molecular mass of 115.0 kDa, an unhydrated volume of 150.3 nm3, a hydrated volume of 197.3 nm3 and a partial specific volume ν̄ of 0.741 ml/g (37). Compositional data for SCR-1/5, SCR-6/8, and SCR-16/20 are reported elsewhere (33, 34). For this study, SCR-16/20 was taken to be glycosylated at two sites, with a calculated molecular mass of 41.9 kDa and absorption coefficient of 14.8 (1%, 280 nm, 1-cm path length). Buffer densities for AUC were measured at 20 °C to be 1.00096 g/ml (TBS, 50 mm NaCl) and 1.00482 g/ml (TBS, 137 mm NaCl) using an Anton-Paar DMA5000 density meter.
AUC Data for FH-CRP
AUC data for mixtures of FH and CRP were obtained on two Beckman XL-I instruments equipped with AnTi50 and AnTi60 rotors. Sedimentation velocity data were acquired at 20 °C at a rotor speed of 50,000 rpm in two-sector cells with column heights of 12 mm. The sedimentation boundaries were analyzed using direct boundary Lamm fits of up to 300 scans using SEDFIT (version 11.7) (39, 40). SEDFIT resulted in size distribution analyses (c(s)) in which the fit algorithm assumes that all species have the same frictional ratio (f/o). The final SEDFIT analyses used a fixed resolution of 200 and optimized the c(s) fit by floating f/fo and the base line until the overall root mean square deviations and visual appearance of the fits were satisfactory (Fig. 2).
FIGURE 2.

Analytical ultracentrifugation analysis of FH-CRP mixtures in A (50 mm NaCl) and B (137 mm NaCl). The c(s) size distribution analyses correspond to sedimentation velocity experiments performed at a rotor speed of 50,000 rpm in which CRP was titrated against 1.0 mg/ml FH at CRP:FH molar ratios of 1:0.5, 1:1, and 1:2 (total concentrations of 1.5, 1.8, and 2.5 mg/ml from bottom to top). Representative boundary fits showing every tenth scan are shown in the two upper panels for the 1:1 mixtures in 50 mm NaCl and 137 mm NaCl. The plots are displaced vertically on the c(s) axis, and the peak intensities are normalized for clarity. For comparison, the c(s) analyses for unbound FH (dashed lines) and CRP (dotted lines) are shown at the bottom. The insets at the bottom show the peaks at larger s values in more detail. For FH, peaks 1, 2, and 3–8 have been assigned to monomeric, dimeric, and oligomeric FH species in order of increasing s value. For CRP, peak P corresponds to pentameric CRP and peak D corresponds to the reaction boundary of decameric CRP. In the FH-CRP mixtures, peaks A, B, and C correspond to peaks observed at different positions from those seen for unbound FH and CRP, which correspond to either FH·CRP complexes or their reaction boundaries.
SPR Data for FH-CRP
The binding of FH and CRP was analyzed by SPR using a Biacore X100 instrument and version 1.1 of its evaluation software (GE Healthcare). FH or CRP was coupled to flow cell 2 of a carboxylated dextran (CM5) research grade sensor chip via a standard amine coupling procedure according to the manufacturer's protocol. FH (20 μg/ml) or CRP (10 μg/ml) in 10 mm acetate buffer, pH 5.5 (FH) or pH 4.3 (CRP), was injected over flow cell 2 until 150 response units (RU) were attained. The CRP sample was maintained in at least 20 μm CaCl2 during immobilization. A control surface was prepared identically on flow cell 1 but without protein immobilization. Binding and equilibrium analyses were performed at 25 °C using the appropriate Biacore X100 wizards at flow rates of 10–30 μl/min. Regeneration after each run was achieved by pulsing 10 mm acetate buffer, 2 m NaCl, pH 4.6, across both flow cells once for 30 s. The running buffer was HBS containing 50 or 137 mm NaCl. The kinetic fit for a single set of experiments in 50 mm NaCl (Fig. 3E, inset) was performed using the heterogeneous ligand model implemented in the Biacore evaluation software. In this model, the ka and kd on-rate and off-rate parameters were fitted globally, and two maximum signal response values, Rmax1 and Rmax2, as well as the bulk refractive index (RI), were fitted locally to give an overall χ2 value of 1.503 RU2.
FIGURE 3.

Surface plasmon resonance analysis of the FH-CRP interaction. In plots A–D, FH was immobilized on the chip surface. In plots E and F, CRP was immobilized. A and B, equilibrium KD analyses for CRP binding to immobilized FH in 50 and 137 mm NaCl. In 50 mm NaCl, the binding response increased exponentially to well above the theoretical maximum response of 112 RU at CRP concentrations between 0 and 15 μm. In 137 mm NaCl, saturation was not attained at CRP concentrations between 0 and 30 μm. C and D, sensorgrams for the equilibrium studies reported in A and B. The individual responses correspond incrementally to the individual data points shown in A and B. E and F, equilibrium KD analyses for FH binding to immobilized CRP in 50 mm and 137 mm NaCl. In 50 mm NaCl buffer, the binding response approaches the theoretical maximum response of 200 RU at FH concentrations between 0 and 15 μm. The apparent KD value was estimated by fitting to a heterogeneous ligand kinetic model (insets). In 137 mm NaCl, the KD value was determined at CRP concentrations between 0 and 15 μm (inset).
X-ray Scattering Data for FH-CRP
X-ray scattering data were obtained in one beam session in four-bunch mode at the European Synchrotron Radiation Facility, Grenoble, France, operating with a ring energy of 6.0 GeV on Beamline ID02 (41). Storage ring currents ranged from 29 to 43 mA. Data were acquired using a recently installed fiber optic-coupled high sensitivity and dynamic range charge-coupled device detector (FReLoN) and a sample-to-detector distance of 3.0 m (42). FH and CRP were mixed in a molar ratio of 1:1 and studied at total protein concentrations of 1.78 mg/ml (1.00 mg/ml FH and 0.78 mg/ml CRP) and 0.71 mg/ml (0.40 mg/ml FH and 0.31 mg/ml CRP). 100-μl (vol) samples were measured in flow cells in which radiation damage was reduced by moving the sample continuously during beam exposure. Sets of 10 time frames, each of duration 0.1, 0.15, or 0.2 s, were acquired. Buffers were measured using the same exposure times in alternation with the samples to eliminate background subtraction errors. On-line checks during data acquisition confirmed the absence of radiation damage, after which the 10 frames were averaged. Sample temperature corresponded to ambient conditions at 20 °C. Other details including the data reduction procedure are described elsewhere (43).
In a given solute-solvent contrast, the radius of gyration RG is a measure of structural elongation if the internal inhomogeneity of scattering densities within the protein has no effect. Guinier analyses at low Q (Q = 4 π sin θ/λ; 2θ = scattering angle; λ = wavelength) give the RG and the forward scattering at zero angle I(0) (44).
This expression is valid in a Q·RG range up to 1.5. The RG analyses were performed using an interactive PERL script program SCTPL77 on Silicon Graphics O2 Workstations. The RG value of a mixture of two proteins, A and B, is given by the expression (45)
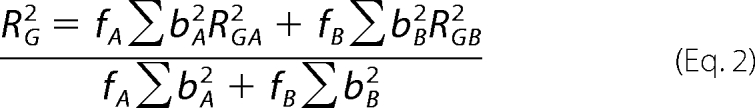 |
where fA and fB are the fractional proportions of A and B, bA and bB are the total of electrons in A and B, and RGA and RGB are the RG values of A and B. Indirect transformation of the scattering data I(Q) in reciprocal space into real space to give the distance distribution function, P(r), was carried out using the program GNOM (46).
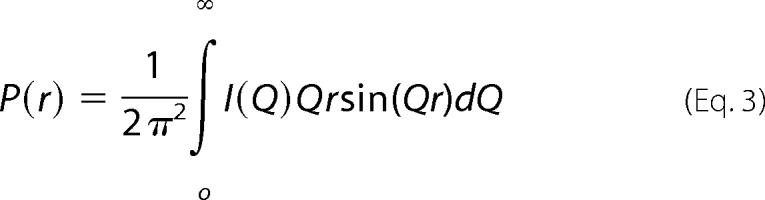 |
P(r) corresponds to the distribution of distances r between volume elements. For this calculation, the x-ray I(Q) curve utilized up to 392 data points in the Q range between 0.09 and 1.8 nm−1.
RESULTS
Sedimentation Velocity Studies of the FH·CRP Complex
AUC studies macromolecular structures in solution by following their sedimentation behavior under high centrifugal force (47). The observed sedimentation boundaries were fitted to yield a sedimentation coefficient size distribution c(s) according to the Lamm equation using SEDFIT (see “Experimental Procedures”). This takes into account all of the species present in the sample, although the algorithm assumes that the same frictional ratio f/fo applies for all sedimenting species (where fo is the frictional coefficient of the sphere with the same volume as the hydrated glycoprotein). Macromolecular elongation is monitored through the sedimentation coefficient s20,w0 values. For a noninteracting system, sample polydispersity is determined from the number of peaks observed in the c(s) plot. For an interacting system, the c(s) peaks may correspond instead to reaction boundaries and not to discrete species if rapid exchange occurs during sedimentation. Size exclusion chromatography and AUC sedimentation equilibrium in 146 mm NaCl buffer have shown that FH does not interact with CRP in solution (Table 1) (27). However, FH and CRP have been reported to interact in 49 mm NaCl buffer as determined by SPR (17). To investigate this discrepancy, sedimentation velocity experiments were performed with FH and CRP mixed in molar ratios of 1:0.5, 1:1, and 1:2 in both 50 mm NaCl and 137 mm NaCl buffers. These correspond to concentrations of 0.1 to 1.1 mg/ml (FH) and 0.1 to 1.4 mg/ml (CRP). The c(s) analyses of interference optics data resulted in good boundary fits (Fig. 2).
AUC velocity experiments on FH and CRP show that the individual proteins form multimers (8, 9, 13, 34). Unbound FH forms dimers in a concentration-dependent manner through interactions in at least two different sites within SCR-6/8 and SCR-16/20, and the combination of both interactions leads to FH dimers and higher oligomers in both 50 mm NaCl and 137 mm NaCl. In the c(s) plot, these correspond, respectively, to peaks 2 and 3–8 at the bottom of Fig. 2, A and B. CRP in the presence of 2 mm Ca2+ forms pentamers and decamers in a concentration-dependent manner, and these correspond to peaks P and D at the bottom of Fig. 2, A and B.
AUC studies of nine FH-CRP mixtures revealed complex formation in 50 mm NaCl and 2 mm Ca2+. The boundary fits for c(s) plots for FH and CRP mixtures correspond to concentrations of 0.3–1.1 mg/ml FH (three concentrations) and 0.1–1.4 mg/ml CRP (nine concentrations). These maintained three FH:CRP ratios of 1:0.5, 1:1, and 1:2. The three representative c(s) plots shown in Fig. 2A consistently showed at least two major peaks, denoted as A and B in all nine mixtures, together with a weak peak C. Peak A has an average s20,w0 value of 5.7 ± 0.1 S, which is similar to that of 5.7 ± 0.1 S for peak 1 for unbound FH in 50 mm NaCl buffer (13). Compared with peak 1 for the FH monomer, the width of peak A broadened and its intensity increased with an increase in the CRP concentration at a fixed FH concentration. No separate peak P for pentameric CRP at a s20,w0 value of 6.4 ± 0.1 S was observed. Both features are consistent with an association between two reacting components (48). Thus peak A is attributed to an average of monomeric FH and pentameric CRP that interact in a rapid equilibrium (Fig. 2A). Peak B showed s values that varied in a range between 6.7 and 7.3 S, in which the s value increased with increasing CRP concentration. Its behavior indicated a reaction boundary formed by an interaction between FH and CRP (49), which is consistent with the lack of base-line resolution between peaks A and B (13). The s value of peak B is greater than that for the CRP pentamer at 6.4 S, indicating that this peak corresponds to a stoichiometric 1:1 complex between FH and CRP of increased mass. Peak C corresponded to another sedimentation species that was observed at the highest CRP concentrations (Fig. 2A). The intensity of peak C depends on the CRP concentration. The mean s value of peak C at 9.2 ± 0.4 S was higher than the experimentally observed range of s values of 7.7 to 8.4 S for decameric CRP. This increase in s value is consistent with the formation of a larger complex; thus, this most likely corresponds to a FH·CRP2 stoichiometry.
In the c(s) analyses above, the assignments of peaks A, B, and C for 50 mm NaCl buffer containing 2 mm Ca2+ correspond to the simplest interpretation in terms of two interacting components. This is in terms of unbound FH monomer and CRP pentamer (peak A) and reaction boundaries for the FH·CRP and FH·CRP2 complexes (peaks B and C). Other interpretations, such as the formation of a FH2·CRP complex, cannot be ruled out. To investigate peaks A, B, and C further, the c(s) distributions were first converted to molecular mass distributions, c(M). The c(M) distributions provide mass information, provided that the c(s) peaks correspond to noninteracting sedimentation species and the individual components have similar frictional ratios (f/fo). Using a mean f/fo ratio of 1.5 ± 0.2, the c(M) plots show that peaks A, B, and C correspond to apparent molecular masses of 122 ± 16, 169 ± 20, and 239 ± 22 kDa, respectively. The mass for peak A is comparable with a mean value of 136 kDa for an equimolar mixture of unbound monomeric FH and pentameric CRP. The masses for peaks B and C are lower than those predicted for a FH·CRP complex (269 kDa) and a FH·CRP2 complex (384 kDa), supporting the deduction that peaks B and C correspond to reaction boundaries. As expected from the reaction boundaries and the very different f/fo values of 1.75 for monomeric FH and 1.12 for CRP (8, 9, 13), the c(M) distribution resulted in erroneous calculations of molecular mass, although good estimates could be obtained for the most abundant species represented by peak A (48, 49). The existence of rapid exchange between FH and CRP indicates that complex formation would not be detectable by size exclusion chromatography (27). Second, the c(s) peak intensities were examined in order to assess FH oligomer and CRP decamer formation. The insets at the bottom of Fig. 2A show that the intensities of FH oligomer peaks 3–8 were much reduced in the mixtures. This shows that the interaction between FH and CRP has clearly suppressed the formation of higher FH oligomers. For reasons of peak overlap, it is not clear whether FH dimers (peak 2) or CRP decamers (peak D) are still present. A comparison of the ratio of the sizes of peaks B and C with the ratio of the sizes of peaks P and D for CRP and peaks 1 and 2 for FH suggests that peak C is relatively small and is more similar in size to peak 2 than to peak D. This suggests that peak C may correspond to a FH·CRP2 or a FH2·CRP complex, although this assignment is not unequivocal.
AUC experiments in 137 mm NaCl buffers showed that the interaction between native FH and CRP is dependent on ionic strength. For 137 mm NaCl buffer containing 2 mm Ca2+, the AUC c(s) analyses again revealed the existence of three peaks A, B, and C, together with evidence that the FH-CRP interaction displayed an NaCl concentration dependence in accord with the ionic interactions predicted from Fig. 1. Here, 10 experiments were performed using FH:CRP molar ratios of 1:0.5, 1:1, and 1:2 for FH concentrations between 0.1 and 1.1 mg/ml and CRP concentrations between 0.2 and 1.3 mg/ml, of which three experiments are shown in Fig. 2B. Peak A with an s20,w0 value of 5.8 ± 0.1 S corresponds closely to peak A in 50 mm NaCl buffer with a s20,w0 value of 5.7 ± 0.1 S (Fig. 2A). This is again attributed as being the average of unbound monomeric FH and pentameric CRP interacting with each other. Peak A was less broad compared with peak A observed in 50 mm NaCl. The c(M) plot yielded a molecular mass of 127 ± 17 kDa, which is similar to that of 122 ± 16 kDa in 50 mm NaCl buffer. Peak B ranged in s values between 6.8 and 7.5 S in a concentration-dependent manner, which is similar to the s values of 6.7–7.3 S for peak B in 50 mm NaCl buffer. Peak B in 137 mm NaCl exhibits two important differences from peak B in 50 mm NaCl. First, the base-line resolution between peaks A and B is improved, indicating a reduced association between FH and CRP. Second, the widths of peaks B and A are also reduced compared with those in 137 mm NaCl. Both features show that complex formation between FH and CRP is reduced in 137 mm NaCl buffer. Peak C in 137 mm NaCl appears at a higher s value at all concentrations and shows no concentration dependence, unlike peak C in 50 mm NaCl. Its mean s value of 8.8 ± 0.2 S was lower than that of 9.2 ± 0.4 S for peak C in 50 mm NaCl. At low CRP concentration, peak C is most likely to correspond to peak 3 of unbound FH (and is labeled “C” for this reason in Fig. 2B). At higher CRP concentrations, peak C is attributed to the FH·CRP2 complex that was seen in 50 mm NaCl. In summary, FH and CRP were observed to interact with each other, but this interaction was weaker in 137 mm NaCl than in 50 mm NaCl.
SPR Studies of the FH·CRP Complex
SPR monitors the interaction between a binding partner in solution (analyte) and an immobilized partner (ligand) attached to the surface of a sensor chip (50). Three previous SPR studies of the CRP interaction with FH fragments employed 1 μm FH in 49 mm NaCl, 2 μm FH in 150 mm NaCl, and 5–21 μm FH in 150 mm NaCl, with no mention of Ca2+ during CRP immobilization (Table 1) (17, 20, 22). These SPR studies were questioned on the grounds of the possible denaturation of CRP when immobilized in the absence of Ca2+ (27). CRP that was covalently linked to a CM5 chip according to the manufacturer's protocol (i.e. in the absence of Ca2+) lost its reactivity (26). Based on knowledge gained from AUC and size exclusion chromatography showing that CRP inactivation is slow when Ca2+ is removed (13), CRP was immobilized in the presence of at least 20 μm Ca2+ for 45 min and stored in 2 mm Ca2+. This approach resulted in immobilized CRP that remained active. This is shown from the similar KD value of 22 μm for its pentamer-decamer self-association when studied either in solution or by SPR (13). Here, the FH-CRP interaction was studied by SPR using either immobilized FH or immobilized CRP in duplicate runs using 50 mm NaCl and 137 mm NaCl buffers containing 2 mm Ca2+ (“Experimental Procedures”).
Native CRP in solution binds to immobilized FH in both 50 mm NaCl and 137 mm NaCl in the presence of 2 mm Ca2+ (Fig. 3, A–D). This is in agreement with the AUC data. CRP was flowed over a CM5 sensor chip onto which 150 RU of FH had been immobilized (“Experimental Procedures”). The sensorgrams show that the on- and off-rates are rapid (Fig. 3, C and D). In 50 mm NaCl, the SPR equilibrium studies using 0.1–15 μm CRP show that CRP aggregated onto immobilized FH (Fig. 3A). This was evidenced by the exponential increase in binding response up to 500 RU, which is five times the predicted maximum binding response (Rmax) of 112 RU if the stoichiometry is 1:1. This large increase resembles the aggregation of CRP in the same buffer binding to immobilized CRP (13). It is likely that CRP first binds to immobilized FH, and then the FH-bound CRP recruits more CRP. On progressing from 50 to 137 mm NaCl, CRP binding was greatly weakened. The binding response of 10 μm CRP decreased 25-fold from 221 RU in 50 mm NaCl to 9 RU in 137 mm NaCl (Fig. 3B). An equilibrium KD value could not be determined for 0.1–30 μm CRP in 137 mm NaCl because of the nonsaturation of CRP binding. It is likely that these observations correspond to a combination of the CRP interaction with immobilized FH and the pentamer-decamer equilibrium of CRP.
In the reversed SPR equilibrium experiment, native FH in solution binds to immobilized CRP (Fig. 3, E and F). 150 RU of CRP was immobilized on the sensor chip (13). In 50 mm NaCl, a much higher response of up to 160 RU was observed compared with 23 RU in 137 mm NaCl. In 50 mm NaCl, steady state binding equilibria were not achieved for the majority of runs because of slower association-dissociation rates (Fig. 3E). Hence affinity analyses could not be carried out. In such cases, a KD value is determined from the kinetic rate constants for association and dissociation, provided the fitted model describes the experimental data. A simple 1:1 kinetic model did not give a good fit to the experimental data. A much improved fit was obtained with alternative models, such as for a heterogeneous ligand model (Fig. 3E, inset, and “Experimental Procedures”). However, this good-fit model did not completely describe the experimental data, and the resulting KD values are estimates only. Two apparent equilibrium constants, KD1-app and KD2-app, of 3.4 and 0.4 μm, respectively, were obtained. The complexity of this analysis in 50 mm NaCl may result from FH binding at either one of two different sites to one immobilized CRP molecule, from two different sites on one FH molecule interacting with two immobilized CRP molecules, or from differences in the binding of the Tyr-402 and His-402 FH allotypes to CRP. In 137 mm NaCl, the FH-CRP interaction was weaker and proceeded to steady state equilibrium (Fig. 3F), from which an equilibrium KD value of 4.2 μm was determined (Fig. 3E, inset). This analysis was well represented by a 1:1 interaction. Thus CRP binds to FH in a NaCl concentration-dependent manner in agreement with the AUC data.
SCR-7 has the second highest basic charge density in FH (pI = 6.1–6.3), surpassed only by SCR-20 (Fig. 1). AUC showed that one or both FH dimerization sites at SCR-6/8 and SCR-16/20 were blocked by the interaction with CRP (Fig. 2). Accordingly, either SCR-7 or SCR-20 or both may interact with the anionic CRP molecule (pI = 5.28) (Fig. 1) (13). As shown previously by SPR, the binding of CRP to FH in 49–150 mm NaCl was localized to SCR-7 and SCR-8/11 (Table 1) (17, 20, 22). To investigate the FH binding sites on CRP, SPR binding analyses in the presence of Ca2+ were carried out using three FH fragments that represent the main functions of FH, namely SCR-1/5, SCR-6/8, and SCR-16/20. Each was flowed over immobilized CRP at concentrations between 5 and 50 μm in 50 and 137 mm NaCl buffers containing 2 mm Ca2+. In 50 mm NaCl, binding of SCR-16/20 to CRP was observed at all three concentrations (10, 20, and 50 μm), whereas 8 μm C3u used as a nonbinding control protein showed no binding to CRP (Fig. 4, A and B). In 137 mm NaCl, the binding of SCR-16/20 at four concentrations (5, 10, 15, and 20 μm) was consistently weaker, indicating that this interaction was electrostatic. This shows that a previously unknown CRP binding site exists within SCR-16/20. The Tyr-402 and His-402 allotypes of SCR-6/8 bound differentially to immobilized CRP (Fig. 4, C and D). Between concentrations of 5 and 20 μm, the Tyr-402 allotype was bound more strongly than the His-402 allotype in both 50 and 137 mm NaCl. The use of SCR-1/5 as a control showed no binding. Interestingly, the Tyr-402 allotype was bound in similar amounts in 50 and 137 mm NaCl, whereas His-402 allotype binding was mostly absent in 50 mm NaCl. This shows that this interaction is driven by hydrophobic forces in which the presence of the positive charge on His-402 in low salt is sufficient to abolish CRP binding. The KD value for SCR-16/20 was determined to be 15.3 μm, and those for SCR-6/8 (Tyr-402) and SCR-6/8 (His-402) were determined to be 3.9 and 11.9 μm (Fig. 4, E and F, insets). These KD values show that the strongest interaction occurs with SCR-6/8 (Tyr-402), for which the KD value resembles the 4.2 μm for intact FH with CRP (Fig. 3F, inset).
FIGURE 4.

Surface plasmon resonance analyses of FH fragments with immobilized CRP. A and B, SCR-16/20 binding in 50 mm and 137 mm NaCl buffer. Here, 10, 20, and 50 μm SCR-16/20 bind to CRP, and 8 μm C3u was used as a nonbinding control. C and D, the Tyr-402 and His-402 allotypes of SCR-6/8 binding in 50 mm and 137 mm NaCl buffer. Here, 5, 10, 15, and 20 μm SCR-6/8 allotypes bind differentially to CRP, and 5 μm SCR-1/5 was used as a nonbinding control. E and F, equilibrium KD analyses for SCR-16/20 and the SCR-6/8 allotypes binding to immobilized CRP in 137 mm NaCl. The SCR-16/20 concentration ranged between 0 and 15 μm, and that for SCR-6/8 ranged between 0 and 20 μm. The KD values were determined using an affinity 1:1 model (insets in E and F).
The FH-CRP interaction was assessed using stoichiometric ratios (SR). These were estimated from the intensity of the binding signals at the highest protein concentrations. The SR is the ratio between the observed maximum binding response and the calculated maximum binding response (Rmax). Rmax is given by the molecular mass ratio of FH analyte to CRP ligand, multiplied by the stoichiometry of 1, and the amount of immobilized CRP ligand (150 RU). Hence the values of Rmax were 201, 55, and 28 RU for FH, SCR-16/20, and both allotypes of SCR-6/8 respectively. For FH in 50 mm NaCl, the binding response of 160 RU (Fig. 3E) gave a SR value of 0.8 and indicated a 1:1 stoichiometry of FH:CRP. For FH in 137 mm NaCl, the binding response of 22 RU (Fig. 3F) gave a SR value of 0.1 and corresponded to a weakened FH-CRP interaction. For SCR-16/20, the binding responses of 91 RU (50 mm NaCl) and 53 RU (137 mm NaCl) (Fig. 4, A and B) gave SR values of 1.7 and 1.0, respectively, indicating 2:1 and 1:1 stoichiometries, respectively. SCR-6/8 in 137 mm NaCl buffer exhibited a marked difference between the Tyr-402 and His-402 allotypes, with maximum binding responses of 152 and 55 RU, respectively (Fig. 4D). The SR values were 5.5 and 2.0 leading to stoichiometries of 5:1 and 2:1, respectively. The interpretation is necessarily qualitative, but these SR values suggest that although as many as five SCR-6/8 molecules may bind to CRP, only one SCR-16/20 molecule can bind to CRP, and overall a 1:1 stoichiometry is favored in its physiologically relevant interaction with FH.
X-ray Scattering Studies of the FH·CRP Complex
X-ray scattering is a diffraction technique performed in solution in order to study the overall structure of biological macromolecules in random orientations (51). FH-CRP mixtures were studied in both 50 mm and 137 mm NaCl buffers. X-ray data collection in 50 mm NaCl was not successful by reason of sufficient minor protein aggregation that precluded linear Guinier RG analyses. Data collection in 137 mm NaCl in the presence of 2 mm Ca2+ was successful. A 1:1 mixture of FH and CRP was studied in two dilutions with total protein concentrations of 1.78 mg/ml (6.6 μm) and 0.71 mg/ml (2.6 μm) in each (“Experimental Procedures”). These concentrations correspond to 46 and 30% complex formation according to the KD value of 4.2 μm. Guinier analyses of the scattering data I(Q) at low Q values gave linear RG fits within appropriate Q·RG limits (“Experimental Procedures”), showing good monodispersity (Fig. 5A). The mean RG value from three measurements was unchanged at both concentrations, with values of 7.6 ± 0.1 nm (1.78 mg/ml total protein) and 7.9 ± 0.3 nm (0.71 mg/ml total protein). If no complex formation occurs, the RG value of the mixture is estimated to be 7.5 ± 0.3 nm (“Experimental Procedures”). This RG value is the weighted mean of assumed RG values of 8.9 nm for FH and 3.7 and 4.2 nm for the CRP pentamer (80%) and decamer (20%), respectively (8, 9, 13, 45). The observed and estimated RG values are therefore similar in the solution conditions where 30–46% of the FH·CRP complex has formed in 137 mm NaCl.
FIGURE 5.

X-ray scattering analyses for FH-CRP interaction in 137 mm NaCl. The data correspond to two 1:1 mixtures of FH and CRP. A, Guinier RG analyses for a total protein concentration of 1.78 mg/ml (upper line) and 0.71 mg/ml (lower line). The filled circles correspond to the data points that were fitted to obtain RG values, and the straight lines correspond to the best fit through these points using a Q range of 0.09 to 0.14 nm−1. The Q·RG fit range is indicated by arrows. B, the corresponding distance distribution P(r) analyses are shown for the two 1:1 mixtures. The total protein concentrations were 1.78 mg/ml (upper trace) and 0.71 mg/ml (lower trace). The peak maximum M is arrowed, and the maximum length is denoted as L1. For comparison, the P(r) curve is compared with the sum of those for unbound FH and CRP (dashed-dotted line). C, the P(r) curves for unbound FH at 0.71 mg/ml and CRP at 0.31 mg/ml are shown for comparison. The sum of the P(r) curves corresponds to a total concentration of 0.71 mg/ml and is shown as the dashed-dotted line for the comparisons shown in B.
The distance distribution P(r) curve, calculated from the full I(Q) curve, represents all of the distances between pairs of atoms within the macromolecule of interest. The P(r) curve provides an independent verification of Guinier RG values and leads to maximum lengths (L) following an assumption of the maximum dimension (Dmax). The P(r) curves from Fig. 5B yielded a mean RG value of 8.0 ± 0.2 nm. Because this agrees well with the Guinier RG value, it shows that the P(r) curves refer to the macromolecules being studied. The maximum length L was determined from the value of r when P(r) = 0. Although the L1 value could attain 32 nm, the optimal L1 value for both P(r) curves of FH·CRP was determined to be 27 nm to attain good agreement of the Guinier and P(r) RG values. This L1 value is reduced compared with the L3 value of 32 nm for unbound FH in 137 mm NaCl, whereas it remains greater than the L2 value of 12 nm for unbound CRP pentamer and decamer (Fig. 5C) (8, 9, 13). This reduction in the L value of the FH-CRP mixture is consistent with the presence of more compact structures in this mixture, even though the RG value is similar or slightly increased, i.e. the length of the FH domain structure is reduced in the presence of CRP. The maximum (M) corresponds to the most frequently occurring interatomic distance within the protein structure. A pronounced maximum was observed at r = 5.6 nm for the FH-CRP mixture (Fig. 4B). The corresponding M values were 4.9 nm for unbound FH and 3.1 and 5.7 nm for unbound pentameric and decameric CRP, respectively (Fig. 4C). Thus M for the FH-CRP mixture is close to the mean M values of unbound FH and CRP. In contrast, the comparison of the two observed P(r) curves for the FH-CRP mixture with the sum of the P(r) curves for unbound FH and CRP mixture showed increased intensities between r values of 10 and 25 nm (Fig. 4B). This intensity difference indicates the presence of more compact structures in the mixture of unbound FH and CRP and the FH·CRP complex. In conclusion, the P(r) curves indicate structural change during FH·CRP complex formation, in which the complex may possess a more compact structure compared with unbound FH and CRP.
DISCUSSION
The combination of AUC, SPR, and x-ray scattering analyses has established more rigorously than before that wild-type FH interacts with native CRP in both the fluid and surface phases. This occurs in physiological conditions corresponding to acute phase concentrations of CRP but not to normal plasma levels of CRP. FH exists in plasma at concentrations between 0.235 and 0.810 mg/ml (1.6 to 5.4 μm) (7). CRP concentrations increase from as low as 50 ng/ml under normal plasma conditions up to 0.5 mg/ml (0.4 nm to 4.4 μm) during the acute phase response (12). Our studies were carried out at FH concentrations of 0.1–1.1 mg/ml and CRP concentrations of 0.2–1.4 mg/ml in physiological buffer containing 137 mm NaCl and including 2 mm Ca2+, given that 2.5 mm Ca 2+ is present in plasma (10). Thus our results are of physiological relevance. The overall interaction is dependent on ionic strength, being stronger with the decrease in the NaCl concentration to 50 mm. The binding of FH to CRP suppresses both the self-association of FH to form dimers and higher oligomers and the formation of CRP decamers. Because FH self-associates in at least two sites localized within SCR-6/8 and SCR-16/20 (Fig. 6A), it was concluded that CRP has two different FH binding sites in SCR-6/8 and SCR-16/20. This deduction was verified by SPR experiments.
FIGURE 6.

Schematic summarizing the observed interactions between FH and CRP. A, unbound FH exists as 5–15% dimer in equilibrium with monomeric FH with a monomer-dimer KD of 28 μm and with higher oligomers of FH formed by contacts between successive pairs of SCR-7 and SCR-20 domains. B, pentameric CRP binds to FH at either SCR-7 or SCR-20 with a reduced KD of 4.2 μm. The interaction blocks the formation of FH dimers and CRP decamers. Two molecules of CRP can bind simultaneously to one FH molecule. One molecule of CRP may be able to bind one molecule of FH at SCR-7 and SCR-20 at two different sites, in which case FH adopts a compact conformation. C, schematic illustration of how CRP can recruit FH (Tyr-402) onto damaged host cells at both SCR-7 (with a KD value of 4 μm) and SCR-20. This positions SCR-1/4 appropriately to regulate the degradation of surface-bound C3b, limiting complement activation at the host cell surface. In contrast, SCR-7 in FH (His-402) and SCR-20 interact less well with CRP, with similar KD values of 12 and 15 μm, respectively. The schematic arbitrarily shows SCR-20 bound to CRP, whereas SCR-7 is not bound; accordingly FH (His-402) is less able to regulate C3b degradation.
Comparisons of Buffer, Calcium, and Protein Concentrations
Appropriate buffer conditions are essential to observe the FH-CRP interaction experimentally. Ten previous FH-CRP studies employed a range of buffers (Table 1). CRP is slowly denatured by the removal of Ca2+, which binds with a KD of 60 μm; thus Ca2+ should be present in at least a 10-fold excess of 60 μm to ensure CRP stability and correct folding, and 2 mm has proved to be satisfactory (13, 19). A recent study reported a slightly lower KD of 30 μm using SPR (52). In addition, CRP aggregates under conditions of 50 mm NaCl instead of the more physiological 140 mm NaCl (13). Previous ELISA studies of the FH-CRP interaction do not meet these two criteria. In relation to Ca2+ levels, column 4 of Table 1 shows that eight of nine ELISA studies were apparently performed with CRP immobilization in the absence of Ca2+. Column 8 of Table 1 shows that four of the nine ELISA studies were apparently performed with insufficient Ca2+ in the buffer. In relation to NaCl levels, six ELISA studies utilized 140–154 mm NaCl, one utilized 100 mm NaCl, and two did not specify the NaCl concentration. Three previous SPR studies likewise may not meet these two criteria (Table 1). The use of Ca2+ during the CRP immobilization stage on the chip was not specified in any of the three studies. In addition, Ca2+ in the buffer was not specified in one SPR study, and Ca2+ was not in excess in another SPR study. In relation to NaCl levels, this was 49 mm in one SPR study and 150 mm in two others. The outcome of earlier ELISA and SPR experiments is not therefore definitive, and it required reconfirmation as performed in this study. The likelihood that denatured CRP with a high affinity for FH had been used for many of these studies has been discussed together with the possibility that the plastic wells used for ELISA may also have denatured the CRP (26, 27).
Appropriate protein concentrations are also essential in observing the FH-CRP interaction. Physiological FH and CRP concentration ranges are 1.6 to 5.4 μm and 0.4 nm to 4.4 μm, respectively. Because our KD value for the FH-CRP interaction is 4.2 μm in 137 mm NaCl (Fig. 3, E and F), no FH-CRP binding would be observed if the FH or CRP concentrations are significantly below 4 μm. In contrast, in the ELISAs, column 7 of Table 1 shows that the maximum FH concentrations in the ELISAs ranged between 0.01 and 0.6 μm. The observation of FH-CRP binding in these studies indicated a much reduced KD value for the FH-CRP interaction when insufficient Ca2+ or NaCl was present. This is explained by the occurrence of denatured CRP, which binds strongly to FH. In the SPR studies, column 7 of Table 1 shows that maximum FH concentrations of 1.6, 21, and 2.3 μm were used. Although these SPR observations of FH-CRP binding correspond to more appropriate protein concentrations, concerns remain in relation to insufficient Ca2+ or NaCl levels, which suggest that denatured or aggregated CRP may contribute to the observed interactions.
We observed that the FH-CRP interaction demonstrates sufficient affinity to be physiologically meaningful. In solution, the KD value of 4.2 μm in physiological 137 mm NaCl shows that this will occur only when CRP levels are sufficiently high during the acute phase response. In the absence of other factors, the physiological range of FH of 0.235 to 0.81 mg/ml will lead to 24–40% complex formation in the presence of 0.5 mg/ml CRP. This is reduced to 0% complex formation in the presence of normal levels of 50 ng/ml CRP. At CRP-decorated surfaces, the effective local concentration of CRP will be higher than in solution. Provided that there is a sufficient density of CRP bound to the surface, our results indicate that FH-CRP binding will also occur at surfaces. This was evidenced by the SPR data. A similar argument can be made for the binding of C3d to complement receptor type 2 at surfaces, where this well characterized interaction was observed in physiological buffer using multivalent ligands but was not observed when monomeric C3d and complement receptor type 2 were used (42).
A reviewer asked whether our present study could be reconciled with an earlier study that concluded that FH and CRP do not interact (27). In the earlier study, AUC sedimentation equilibrium was used to study 1.3–1.7 μm native proteins in 0.3 mm Ca2+ (27). Allowing for an absorption coefficient of 19.5 used in that study to determine the FH concentration, in place of the value of 16.2 used here (9), it is deduced that the earlier study employed 1.5–2.1 μm FH. The lack of observed interaction by AUC is thus partly attributable to the use of too low protein concentrations below our FH-CRP KD value of 4.2 μm. In addition, the Ca2+ concentration used in the earlier study was 0.3 mm as compared with 2 mm used in the present study. The CRP-Ca2+ KD values of 30–60 μm would lead to an 84–91% occupancy with Ca2+ in the earlier study but 97–99% occupancy in the present study. Hence the lack of observed complex formation by AUC is also attributable to insufficient Ca2+. Furthermore, the use of sedimentation equilibrium is a less sensitive method of detecting complex formation than the use of c(s) analyses in sedimentation velocity. In the earlier study, 6.5–8.7 μm protein was used in size exclusion chromatography. There, the lack of observed FH·CRP complex is attributable to the rapid FH-CRP equilibrium detected in the present study and the dilution of proteins during chromatography. In our study, we used up to 12.2 μm proteins for AUC solution experiments and up to 30 μm CRP and 50 μm FH and FH fragments for SPR surface experiments. We consistently observed the FH-CRP interaction in at least 5 μm FH and CRP concentrations in 137 mm NaCl and 2 mm Ca2+. Therefore, the present study can be reconciled with the earlier study in the sense that the earlier study did not utilize sufficiently high protein and Ca2+ concentrations to detect complex formation.
In addition to the importance of appropriate buffer and protein concentrations, previous studies of the FH·CRP complex (Table 1) appeared to be unaware of earlier work on FH and CRP. The dimerization of FH was first reported in 1991 (53) and reconfirmed in 2008 (8), and two dimerization sites were located within SCR-6/8 and SCR-16/20 (33, 34). The self-association of CRP was first reported in 1986 (54) and now has been shown to be a pentamer-decamer equilibrium (13, 55). Both self-associations are relevant to the FH-CRP interaction. Experimental studies are needed to distinguish FH and CRP self-association from the formation of a FH·CRP complex. As exemplified by this study, controls would have been required to show that FH or CRP aggregation events have not been observed.
Involvement of Denatured CRP
In our present study, using well characterized functionally active proteins, both the AUC solution data and the SPR surface data show that the FH-CRP interaction takes place. As AUC is a solution method, our observation of the FH-CRP interaction by AUC was not dependent on CRP protein immobilization, which may cause artifacts (26, 27). Our parallel SPR studies of the FH-CRP interaction confirm that this occurs in 137 mm NaCl and 2 mm Ca2+ (Fig. 3, A–D). It has been suggested that CRP becomes denatured during its immobilization on the SPR sensor chip (26, 27). Our AUC and size exclusion chromatography solution studies showed that CRP dissociation in the absence of Ca2+ is slow and is visible only after several days' exposure to such conditions (13). Our immobilization of CRP for SPR was performed in 20 μm Ca2+ from a CRP stock stored in 2 mm Ca2+ (“Experimental Procedures”) and lasted less than 45 min. This resulted in immobilized CRP, which formed decamers with the same KD value of 22 μm found by AUC for CRP in solution (13). Reversed SPR experiments with immobilized FH also confirmed the FH-CRP interaction. Given the consistency of the AUC and SPR data on FH-CRP, it appears unlikely that CRP denaturation occurred on the sensor chip in our study, although other modifications of CRP activity on the chip cannot be ruled out.
Evidence that FH binds strongly to denatured CRP but weakly to native CRP is provided by the much reduced KD values in Table 1 in the ELISAs, when the existence of denatured CRP was inferred (27). Evidence that FH binds differently to denatured CRP and not native to CRP is provided from the identification of the CRP peptide 86SWESASGIVEFWVD99 as the major linear epitope that binds to FH-like protein-1 (24). The FH-like protein-1 domains correspond to SCR-1/7 of FH. In the CRP crystal structure, this CRP peptide corresponds mostly to β-strand I of the double β-sheet structure and part of β-strand H (56). β-Strand I is almost completely buried at the interfaces between the five protomers in CRP. It is not clear how this CRP peptide can interact with FH-like protein-1 unless CRP is first denatured into monomers.
Interaction between FH and CRP
In this present study, the FH-CRP interaction is best represented by the formation of FH·CRP and FH·CRP2 complexes in which CRP binds to either or both of two different sites on FH (Fig. 6B). This stoichiometry in solution and on surfaces was characterized by both AUC and SPR. The AUC data revealed two distinct FH·CRP complexes in solution (Fig. 2). The suppression of higher FH oligomers by the CRP interaction indicated that CRP binding sites are located at separate FH dimerization sites within SCR-6/8 and SCR-16/20. Previously, SCR-7 in three studies and SCR-8/11 in one study were proposed to be CRP interaction sites by SPR (17, 20, 22). Here, using our improved understanding of CRP stability, our SPR studies show that both SCR-6/8 and SCR-16/20 bind to CRP. These findings are consistent with the FH-CRP KD value of 4.2 μm from SPR. Given that this KD is smaller, this shows that the FH-CRP interaction takes precedence over the formation of the FH dimer (KD of 28 μm), the SCR-6/8 dimer (KD of 40 μm), the SCR-16/20 dimer (KD of 16 μm), and the CRP decamer (KD of 22 μm). Although the AUC data in Fig. 2 do not make it clear whether CRP decamers or FH dimers are inhibited by the FH-CRP interaction, this result appears likely from these KD values. The KD of 4.2 μm for FH-CRP is also consistent with KD values of 3.9 to 15.3 μm for the separate interactions between CRP-SCR-6/8 and between CRP-SCR-16/20 (Fig. 4). The P(r) changes by x-ray scattering showed that complex formation resulted in a more compact structure for FH and CRP in 137 mm NaCl. This is consistent with the SPR results showing that SCR-6/8 and SCR-16/20 bind to CRP, meaning that one FH molecule may interact bivalently with CRP (Fig. 6B).
Micromolar affinities and ionic strength-dependent binding are common features of FH-ligand interactions and other complement-ligand interactions such as those between FH and C3d and between complement receptor type 2 and C3d (30, 42). In general, the joint use of low ionic strength buffers and high sample concentrations facilitates the observation of interactions in solution. However artifacts can result from working in low salt. For example, C3d forms oligomers in 50 mm NaCl but not in 137 mm NaCl (42). Nonetheless, the NaCl concentration dependence data show that the CRP interaction involving SCR-6/8 is principally hydrophobic, whereas that for SCR-16/20 is principally electrostatic (Fig. 4). The overall FH-CRP interaction is dependent on NaCl concentration, indicating the dominance of electrostatic forces. Electrostatic maps of CRP show different charge distributions between the A-face and the phosphocholine- and Ca2+-binding B-face (Fig. 1). The A-face is generally acidic except for basic charges clustered in the contact region between two adjacent protomers. The B-face, which binds to lipid surfaces, exhibits more basic charges. FH shows the most basic surfaces at SCR-7, SCR-13, and SCR-20; it is likely that those at SCR-7 and SCR-20 are involved with CRP binding at the A-face (Fig. 1). The C1q binding site in CRP is also at the A-face (57).
Functional Implications of FH-CRP Interaction
FH down-regulates complement activation by the alternative pathway. This regulatory activity becomes essential during uncontrolled complement activation, which may lead to host cell damage. The apparent contradiction between the activation of the classical pathway by CRP·C1q complexes and the inhibition of the alternative pathway by CRP·FH complexes is clarified by our results showing that the FH-CRP interaction occurs at acute phase levels of CRP and not at normal plasma levels of CRP. The effective local concentration of surface-bound CRP will be increased compared with CRP in solution, and FH will bind more readily to an accumulation of surface-bound CRP. The FH·CRP complexes at damaged host cell surfaces will inhibit complement activation by interacting with bound C3b to regulate its activity (Fig. 6C). The location of two separate CRP binding sites in SCR-6/8 and SCR-16/20 leads to an intriguing explanation for the molecular mechanism of AMD (Fig. 6B). CRP occurs at elevated levels in the retinal layers and drusen deposits of homozygous FH His-402 individuals who are at greater risk of AMD (18). FH-CRP interactions at host cell surfaces will be strengthened by the bivalent binding of FH at SCR-6/8 and SCR-16/20 to two adjacent CRP molecules. Our SPR data showing the much weaker binding of the His-402 variant to CRP than the Tyr-402 variant suggest that bivalent FH binding to CRP occurs less readily under inflammatory conditions in individuals who are homozygous for FH His-402. Their host cells will be less protected by CRP and more prone to damage (Fig. 4). This explains the increased level of CRP in homozygous His-402 individuals (18). Given that the majority of aHUS mutations are localized within SCR-16/20, the binding of SCR-16/20 to CRP is of great interest. It is possible that aHUS mutations may affect FH-CRP binding at host renal epithelial cells, thus making these more susceptible to inflammatory attack. Further studies are currently in progress to characterize more details of the FH-CRP binding sites and their relationships to AMD and aHUS.
Supplementary Material
Acknowledgments
We thank Prof. M. B. Pepys and Dr. Patrizia Mangione for kindly providing purified CRP samples for this study and Dr. T. Sadlon and Prof. D. L. Gordon for kindly providing the SCR-1/5 and SCR-16/20 expression systems. We thank the Biotechnology and Biological Sciences Research Council and the Henry Smith Charity for equipment support and K. Li for providing the C3u protein.
This work was awarded a poster prize at the 18th International Analytical Ultracentrifugation Conference, Uppsala University, Sweden (September 13–18, 2009).
This article was selected as a Paper of the Week.
A. Miller and S. J. Perkins, unpublished data.
J. T. Eaton and S. J. Perkins, unpublished software.
- FH
- factor H
- SCR
- short complement regulator
- AMD
- age-related macular degeneration
- aHUS
- atypical hemolytic uremic syndrome
- CRP
- C-reactive protein
- AUC
- analytical ultracentrifugation
- ELISA
- enzyme-linked immunosorbent assay
- RU
- response unit
- SPR
- surface plasmon resonance
- SR
- stoichiometric ratio.
REFERENCES
- 1.Pangburn M. K., Schreiber R. D., Müller-Eberhard H. J. (1977) J. Exp. Med. 146, 257–270 [DOI] [PMC free article] [PubMed] [Google Scholar]
- 2.Weiler J. M., Daha M. R., Austen K. F., Fearon D. T. (1976) Proc. Natl. Acad. Sci. U.S.A. 73, 3268–3272 [DOI] [PMC free article] [PubMed] [Google Scholar]
- 3.Farries T. C., Seya T., Harrison R. A., Atkinson J. P. (1990) Complement Inflamm. 7, 30–41 [DOI] [PubMed] [Google Scholar]
- 4.Whaley K., Ruddy S. (1976) J. Exp. Med. 144, 1147–1163 [DOI] [PMC free article] [PubMed] [Google Scholar]
- 5.Oppermann M., Manuelian T., Józsi M., Brandt E., Jokiranta T. S., Heinen S., Meri S., Skerka C., Götze O., Zipfel P. F. (2006) Clin. Exp. Immunol. 144, 342–352 [DOI] [PMC free article] [PubMed] [Google Scholar]
- 6.Ferreira V. P., Herbert A. P., Hocking H. G., Barlow P. N., Pangburn M. K. (2006) J. Immunol. 177, 6308–6316 [DOI] [PubMed] [Google Scholar]
- 7.Saunders R. E., Abarrategui-Garrido C., Frémeaux-Bacchi V., Goicoechea de Jorge E., Goodship T. H., López Trascasa M., Noris M., Ponce Castro I. M., Remuzzi G., Rodríguez de Córdoba S., Sánchez-Corral P., Skerka C., Zipfel P. F., Perkins S. J. (2007) Hum. Mutat. 28, 222–234 [DOI] [PubMed] [Google Scholar]
- 8.Nan R., Gor J., Perkins S. J. (2008) J. Mol. Biol. 375, 891–900 [DOI] [PubMed] [Google Scholar]
- 9.Okemefuna A. I., Nan R., Gor J., Perkins S. J. (2009) J. Mol. Biol. 391, 98–118 [DOI] [PubMed] [Google Scholar]
- 10.Hurwitz S. (1996) Crit. Rev. Biochem. Mol. Biol. 31, 41–100 [DOI] [PubMed] [Google Scholar]
- 11.Thompson D., Pepys M. B., Wood S. P. (1999) Structure 7, 169–177 [DOI] [PubMed] [Google Scholar]
- 12.Pepys M. B., Hirschfield G. M. (2003) J. Clin. Investig. 111, 1805–1812 [DOI] [PMC free article] [PubMed] [Google Scholar]
- 13.Okemefuna A. I., Stach L., Rana S., Ziai Buetas A. J., Gor J., Perkins S. J. (2010) J. Biol. Chem. 285, 1041–1052 [DOI] [PMC free article] [PubMed] [Google Scholar]
- 14.Black S., Kushner I., Samols D. (2004) J. Biol. Chem. 279, 48487–48490 [DOI] [PubMed] [Google Scholar]
- 15.Kaplan M. H., Volanakis J. E. (1974) J. Immunol. 112, 2135–2147 [PubMed] [Google Scholar]
- 16.Mold C., Gewurz H., Du Clos T. W. (1999) Immunopharmacology 42, 23–30 [DOI] [PubMed] [Google Scholar]
- 17.Jarva H., Jokiranta T. S., Hellwage J., Zipfel P. F., Meri S. (1999) J. Immunol. 163, 3957–3962 [PubMed] [Google Scholar]
- 18.Johnson P. T., Betts K. E., Radeke M. J., Hageman G. S., Anderson D. H., Johnson L. V. (2006) Proc. Natl. Acad. Sci. U.S.A. 103, 17456–17461 [DOI] [PMC free article] [PubMed] [Google Scholar]
- 19.Kinoshita C. M., Ying S. C., Hugli T. E., Siegel J. N., Potempa L. A., Jiang H., Houghten R. A., Gewurz H. (1989) Biochemistry 28, 9840–9848 [DOI] [PubMed] [Google Scholar]
- 20.Herbert A. P., Deakin J. A., Schmidt C. Q., Blaum B. S., Egan C., Ferreira V. P., Pangburn M. K., Lyon M., Uhrín D., Barlow P. N. (2007) J. Biol. Chem. 282, 18960–18968 [DOI] [PubMed] [Google Scholar]
- 21.Laine M., Jarva H., Seitsonen S., Haapasalo K., Lehtinen M. J., Lindeman N., Anderson D. H., Johnson P. T., Järvelä I., Jokiranta T. S., Hageman G. S., Immonen I., Meri S. (2007) J. Immunol. 178, 3831–3836 [DOI] [PMC free article] [PubMed] [Google Scholar]
- 22.Sjöberg A. P., Trouw L. A., Clark S. J., Sjölander J., Heinegård D., Sim R. B., Day A. J., Blom A. M. (2007) J. Biol. Chem. 282, 10894–10900 [DOI] [PubMed] [Google Scholar]
- 23.Skerka C., Lauer N., Weinberger A. A., Keilhauer C. N., Sühnel J., Smith R., Schlötzer-Schrehardt U., Fritsche L., Heinen S., Hartmann A., Weber B. H., Zipfel P. F. (2007) Mol. Immunol. 44, 3398–3406 [DOI] [PubMed] [Google Scholar]
- 24.Yu J., Wiita P., Kawaguchi R., Honda J., Jorgensen A., Zhang K., Fischetti V. A., Sun H. (2007) Biochemistry 46, 8451–8461 [DOI] [PubMed] [Google Scholar]
- 25.Ormsby R. J., Ranganathan S., Tong J. C., Griggs K. M., Dimasi D. P., Hewitt A. W., Burdon K. P., Craig J. E., Hoh J., Gordon D. L. (2008) Investig. Ophthalmol. Vis. Sci. 49, 1763–1770 [DOI] [PubMed] [Google Scholar]
- 26.Bíró A., Rovó Z., Papp D., Cervenak L., Varga L., Füst G., Thielens N. M., Arlaud G. J., Prohászka Z. (2007) Immunology 121, 40–50 [DOI] [PMC free article] [PubMed] [Google Scholar]
- 27.Hakobyan S., Harris C. L., Van den Berg C. W., Fernandez-Alonso M. C., Goicoechea de Jorge E., Rodriguez de Cordoba S., Rivas G., Mangione P., Pepys M. B., Morgan B. P. (2008) J. Biol. Chem. 283, 30451–30460 [DOI] [PMC free article] [PubMed] [Google Scholar]
- 28.Bonner A., Perrier C., Corthésy B., Perkins S. J. (2007) J. Biol. Chem. 282, 16969–16980 [DOI] [PubMed] [Google Scholar]
- 29.Bonner A., Almogren A., Furtado P. B., Kerr M. A., Perkins S. J. (2009) J. Biol. Chem. 284, 5077–5087 [DOI] [PMC free article] [PubMed] [Google Scholar]
- 30.Okemefuna A. I., Li K., Nan R., Ormsby R. J., Sadlon T., Gordon D. L., Perkins S. J. (2009) J. Mol. Biol. 391, 119–135 [DOI] [PubMed] [Google Scholar]
- 31.Sim R. B., Day A. J., Moffatt B. E., Fontaine M. (1993) Meths. Enzymol. 223, 13–35 [DOI] [PubMed] [Google Scholar]
- 32.Nan R., Gor J., Lengyel I., Perkins S. J. (2008) J. Mol. Biol. 384, 1341–1352 [DOI] [PubMed] [Google Scholar]
- 33.Okemefuna A. I., Gilbert H. E., Griggs K. M., Ormsby R. J., Gordon D. L., Perkins S. J. (2008) J. Mol. Biol. 375, 80–101 [DOI] [PubMed] [Google Scholar]
- 34.Fernando A. N., Furtado P. B., Clark S. J., Gilbert H. E., Day A. J., Sim R. B., Perkins S. J. (2007) J. Mol. Biol. 368, 564–581 [DOI] [PubMed] [Google Scholar]
- 35.De Beer F. C., Pepys M. B. (1982) J. Immunol. Methods 50, 17–31 [DOI] [PubMed] [Google Scholar]
- 36.Fenaille F., Le Mignon M., Groseil C., Ramon C., Riandé S., Siret L., Bihoreau N. (2007) Glycobiology 17, 932–944 [DOI] [PubMed] [Google Scholar]
- 37.Perkins S. J. (1986) Eur. J. Biochem. 157, 169–180 [DOI] [PubMed] [Google Scholar]
- 38.Nelson S. R., Tennent G. A., Sethi D., Gower P. E., Ballardie F. W., Amatayakul-Chantler S., Pepys M. B. (1991) Clin. Chim. Acta 200, 191–199 [DOI] [PubMed] [Google Scholar]
- 39.Schuck P. (1998) Biophys. J. 75, 1503–1512 [DOI] [PMC free article] [PubMed] [Google Scholar]
- 40.Schuck P. (2000) Biophys. J. 78, 1606–1619 [DOI] [PMC free article] [PubMed] [Google Scholar]
- 41.Narayanan T., Diat O., Bosecke P. (2001) Nucl. Instrum. Methods Phys. Res. A 467–468, 1005–1009 [Google Scholar]
- 42.Li K., Okemefuna A. I., Gor J., Hannan J. P., Asokan R., Holers V. M., Perkins S. J. (2008) J. Mol. Biol. 384, 137–150 [DOI] [PubMed] [Google Scholar]
- 43.Gilbert H. E., Eaton J. T., Hannan J. P., Holers V. M., Perkins S. J. (2005) J. Mol. Biol. 346, 859–873 [DOI] [PubMed] [Google Scholar]
- 44.Glatter O., Kratky O. (eds) (1982) Small Angle X-ray Scattering, Academic Press, New York [Google Scholar]
- 45.Perkins S. J., Kerckaert J. P., Loucheux-Lefebvre M. H. (1985) Eur. J. Biochem. 147, 525–531 [DOI] [PubMed] [Google Scholar]
- 46.Semenyuk A. V., Svergun D. I. (1991) J. Appl. Crystallogr. 24, 537–540 [Google Scholar]
- 47.Cole J. L., Lary J. W., Moody T. P., Laue T. M. (2008) Methods Cell Biol. 84, 143–179 [DOI] [PMC free article] [PubMed] [Google Scholar]
- 48.Brown P. H., Schuck P. (2006) Biophys. J. 90, 4651–4661 [DOI] [PMC free article] [PubMed] [Google Scholar]
- 49.Dam J., Schuck P. (2005) Biophys. J. 89, 651–666 [DOI] [PMC free article] [PubMed] [Google Scholar]
- 50.Tanious F. A., Nguyen B., Wilson W. D. (2008) Methods Cell Biol. 84, 53–77 [DOI] [PubMed] [Google Scholar]
- 51.Perkins S. J., Okemefuna A. I., Fernando A. N., Bonner A., Gilbert H. E., Furtado P. B. (2008) Methods Cell Biol. 84, 375–423 [DOI] [PubMed] [Google Scholar]
- 52.Christopeit T., Gossas T., Danielson U. H. (2009) Anal. Biochem. 391, 39–44 [DOI] [PubMed] [Google Scholar]
- 53.Perkins S. J., Nealis A. S., Sim R. B. (1991) Biochemistry, 30, 2847–2857 [DOI] [PubMed] [Google Scholar]
- 54.Perkins S. J., Pepys M. B. (1986) Protides Biol. Fluids Proc. Colloq. 34, 323–326 [Google Scholar]
- 55.Blizniukov O. P., Kozmin L. D., Falikova V. V., Martynov A. I., Tischenko V. M. (2003) J. Mol. Biol. 37, 912–918 [PubMed] [Google Scholar]
- 56.Shrive A. K., Cheetham G. M., Holden D., Myles D. A., Turnell W. G., Volanakis J. E., Pepys M. B., Bloomer A. C., Greenhough T. J. (1996) Nat. Struct. Biol. 3, 346–354 [DOI] [PubMed] [Google Scholar]
- 57.Gaboriaud C., Thielens N. M., Gregory L. A., Rossi V., Fontecilla-Camps J. C., Arlaud G. J. (2004) Trends Immunol. 25, 368–373 [DOI] [PubMed] [Google Scholar]
Associated Data
This section collects any data citations, data availability statements, or supplementary materials included in this article.