Abstract
Atomic force microscopy (AFM) is used to characterize the structure and interactions of clathrin triskelia. Time sequence images of individual, wet triskelia resting on mica surfaces clearly demonstrate conformational fluctuations of the triskelia. AFM of dried samples yields images having nanometric resolution comparable to that obtainable by electron microscopy of shadowed samples. Increased numbers of triskelion dimers and assembly intermediates, as well as structures having dimensions similar to those of clathrin cages, are observed when the triskelia were immersed in a low salt, low pH buffer. These entities have been quantified by AFM protein volume computation.
Keywords: Endocytosis, Clathrin Triskelion, Biological AFM, Macromolecular Assembly, Molecular Flexibility
I. Introduction
Clathrin mediated endocytosis (‘CME’) is implicated in the uptake of essential molecules and cell signaling complexes at the plasma membrane [1–3], and in the cellular invasion of many viruses and bacteria [4]. Central to this process, as well as to intracellular trafficking at trans-Golgi membranes, are clathrin and various adaptor proteins which assemble on cargo-containing membrane patches to form precursors of ca. 100nm diameter “clathrin-coated vesicles” (CCVs) [1,2,5,6]. Many protein-protein and protein-lipid interactions, some being cell and tissue specific [7–11], are involved in CCV biogenesis, which depends on several factors including the presence of membrane micro-domains (“rafts”) [12,13], coupling between membrane curvature and structurally-adaptable coat proteins [14–18], and interactions with the actin cortex [19–21]. Defects in CME correlate with a number of human diseases [2,10].
Conditions have been found whereby purified clathrin triskelia will assemble in vitro into closed polyhedral lattices (“cages” or “baskets”) whose geometry and topology is like that found in the coats of CCVs. There is clear evidence that clathrin triskelia have an intrinsic non-zero curvature and a mesoscopic elastic modulus comparable to the mechanical bending modulus of the plasma membrane [22,23]. We recently used AFM to visualize clathrin lattice polygons on the surfaces of native CCVs in aqueous buffers and developed methods to quantify CCV coat rigidity [22]. Here we advance the use of atomic force microscopy (AFM) to examine the properties of single triskelia, their dimers, and higher order structures, both with dry samples and in aqueous environments particularly appropriate for biological investigations. We show that high-resolution AFM imaging can provide new information about the macromolecular structure, molecular flexibility, in vitro oligomerization and self-assembly of clathrin triskelia.
II. Materials and Methods
AFM Imaging, Clathrin, and Buffers
Gentle tapping mode AFM studies were performed using a Nanoscope V controller, PicoForce Multimode platform, and a type E scanner head (Veeco, Santa Barbara, CA). Procedures optimized for biological samples are described elsewhere [22] and in the online Supplement. Bovine brain triskelia were purified and biochemically characterized [24,25], (see online Supplement), and suspended in “storage buffer” (0.5 M Tris, pH 7.0) at a concentration of 2.0 mg/ml. A few AFM measurements were done on unfrozen samples (see Supplement), but most were performed on material that had been flash frozen into liquid nitrogen and stored at −80 °C. Generally, aliquots of freshly thawed clathrin samples were diluted (ca. 1000 fold) into either storage buffer or into an “assembly buffer” (0.1 M MES, 3mM CaCl2, 0.5 mM MgCl2, 1mM EDTA, pH 6.2), then deposited onto atomically flat mica and imaged either in air or under fluid. Images were analyzed as described in the online Supplement.
III. Results
Flexibility of Triskelia in a Fluid
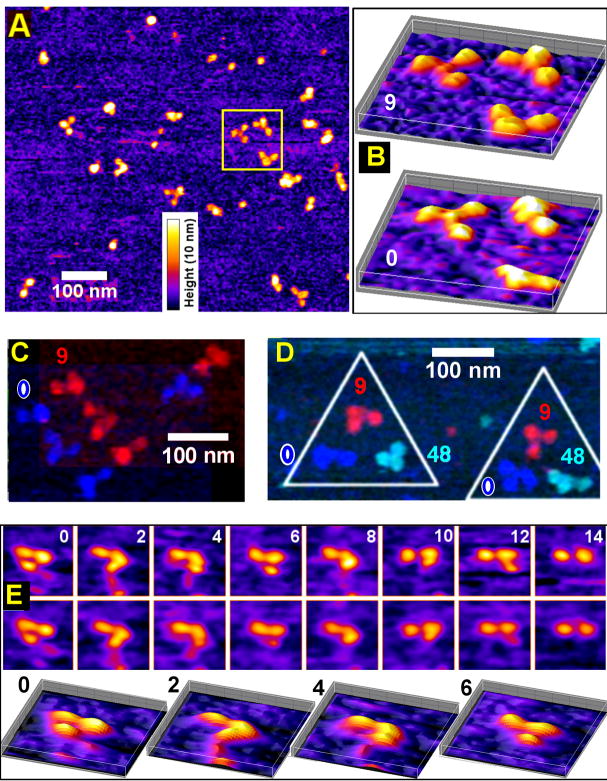
We adapted AFM tapping mode imaging under fluid and were able to directly observe temporal changes of triskelion shapes, visualizing conformation fluctuations of triskelia while immersed in “storage buffer” in which polymerization is strongly disfavored. The triskelia displayed a range of shapes in topographic height traces, many showing distinct three-legged profiles of varying morphology (Fig. 1). Successive AFM image frames indicate that a triskelion typically stays within the same general area but assumes different configurations, each spreading out to about 50 nm over the mica plane but remaining within 10 nm above the mica surface (see color intensity scales, Figs. 1B–E). Triskelion intra-molecular movements are clearly evident in time-lapse images of several different triskelia (3 in 1B, 4 in 1C, 2 in 1D, and 1 in 1E). In Fig. 1E, where the same triskelion is shown at two minute intervals, we see that successive scan and rescan images--taken 0.5 sec apart with scan rate of one line per second--are near perfect matches (Fig. 1E, first/second row). Hence, we can infer that the AFM tip-triskelion interaction is too weak to cause the observed triskelion shape changes. Because the triskelia lie within 10 nm above the mica surface, it is clear that the changing images do not simply reflect rigid body rotations but, rather, indicate true internal shape fluctuations (see, also, online Supplemental video). Intra-triskelion flexibility dynamics is sufficiently slow that blurring of the AFM images is small.
Fig.1.
AFM images of triskelia under “storage buffer” (0.5M Tris, pH 7.0) on a mica surface show conformation fluctuations. (A) An AFM topological image of clathrin triskelia, where the fire-color scale represents the height from 0 to 10 nm (shared by B and E). (B) Three-dimensional representations of triskelia within the marked square in (A), shown in two sequential frames at 9 min apart. (C) Four additional triskelia seen in two AFM image frames at 0 (mono-color blue) and 9 min (mono-color red), displayed in a composite with a diagonal offset. (D) Two more triskelia, each visualized three times at 0 (mono-color blue), 9 (mono-color red), and 48 (mono-color navy) min, displayed with frame centers offset by approx. 100 nm in a triangle, revealing internal movement and shape changes. (E) A single triskelion viewed every two minutes. Trace and retrace scans taken 0.5 sec apart (top and middle rows; 150 nm × 150 nm panels), and 3D plots of the first 4 trace frames (bottom row) show that the triskelion is not perturbed by the AFM tip between trace and retrace, but changed conformation between frames.
Triskelion Dimerization Detected by AFM Imaging under Fluid
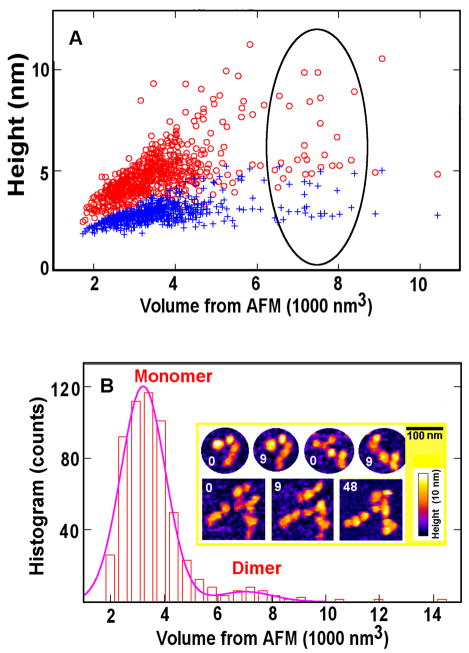
In Fig. 2A we show the distribution of triskelion topological heights and particle volumes obtained from multiple AFM images of many triskelia maintained in fluid (storage buffer) under constant conditions. In addition to individual triskelia (herein referred to as “triskelion monomers”), some triskelion dimers are seen. Upon repeated imaging of the same particles, we observed examples of dimers undergoing significant shape changes (Fig. 2B, insert, top row) and/or switching interaction partners (Fig. 2B, insert, bottom row). The protein volume for each entity was inferred from its detected shape, using a given height threshold. As seen in Fig. 2B, we can identify a discrete population of triskelion monomers centered around a volume of 3500 nm3, the dispersion resulting from varying triskelion shape presentation and AFM tip-size-induced image broadening. The apex heights of these monomers are about 5 nm, with overall height averaging approximately 2 to 3 nm. The dimers are associated with the second peak in the volume histogram, centered near 7000 nm3, i.e., twice the monomer volume. The relative triskelion dimer to monomer mass ratio is 1: 8.5, which reflects the presence of triskelion dimers, and not merely random overlap [26] of non-interacting triskelia (see online Supplement and Table S1).
Fig.2.
Analyses of wet triskelia shown in Fig. 1 indicate particles mostly corresponding to individual triskelia and a few dimers. (A) Height/volume analysis: the red and blue symbols indicate the maximum and mean heights, respectively, detected within each protein particle of a given volume (abscissa). Dimers correspond to points inside the oval. (B) Histogram distribution of protein volumes calculated from the data set in (A). Insert: Triskelion dimers demonstrate structural changes in sequential AFM frames taken at 0, 9, and 48 min, the top row showing two dimers and the bottom row showing four triskelia that switch interaction partners.
Triskelion Dimers and Assemblies Quantified by AFM Imaging in Air
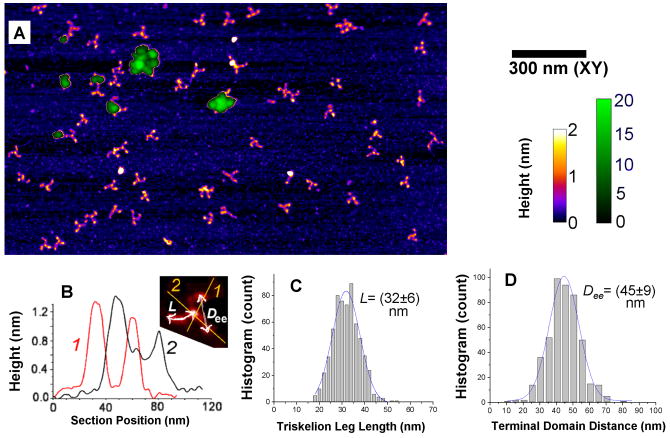
To visualize clathrin at higher resolution, similar to that of electron microscopy [27,28], triskelial movements and AFM tip-size broadening must be suppressed. We thus used sharper probes along with a particularly gentle, in-air, dry-sample AFM tapping mode scheme, and studied samples prepared using either storage or assembly-favorable buffer (see online Supplement). Images like those in Figs. 3A–B show individual triskelia, having characteristic pin-wheel shapes, and numerous closely-associated dimers (visible on a 2 nm height, fire-color scale – see, also, Fig. 4C). Several large assemblies also are visible (see 20 nm, mono-green height scale, Fig. 3A). Compared with fluid images, the profiles of individual triskelia in these dry specimens are flatter, but the heights of the larger cages approach 20 nm (Fig. 4A). The variable shape of the triskelia is consistent with mesoscopic flexibility that is essentially uniform over the entire structure [29]. Distributions of shape parameters (such as the apparent contour length, L, of a triskelion leg and the apparent inter-leg spread, Dee) are correspondingly broad (Fig. 1B–D; see also Table S1), again reflecting inherent flexibility.
Fig.3.
Triskelion dimerization and cage formation occurring in “assembly buffer” (0.1 M MES, 3mM CaCl2, 0.5 mM MgCl2, 1mM EDTA, pH 6.2.), imaged in air following drying on mica (see Methods). (A) Topographs (two height scales and the XY scale to the right) reveal individual triskelia, dimers and small oligomeric profiles (2 nm fire-color scale), and larger assemblies of varying sizes (20 nm mono-green scale, within masked patches). (B) Sections through individual triskelia show hub and terminal domains measuring between 1 nm and 2 nm in height. (C),(D) Histograms of triskelion arm contour length, L, and the distance between terminal domains, Dee, as defined in (B) (see, also, Supplemental Table 1).
Fig.4.
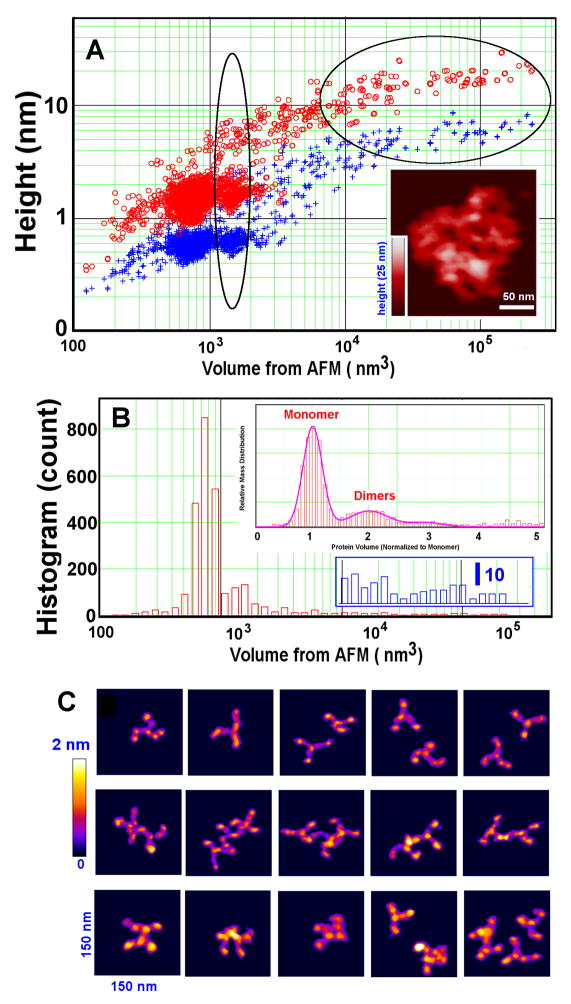
Additional quantification of clathrin in Fig. 3. (A) AFM height/volume analysis reveals discrete populations of i) triskelion monomers with maximum volume ca. 760 nm3, ii) dimers (vertical oval region), and iii) a distribution of larger particles consistent with flattened cage structures (horizontal oval region). Red and blue symbols are the maximum and average apparent heights, respectively. (Insert shows an example of large flattened cages; see, also, Fig. 3A). (B) Histogram distribution obtained from 2724 particles, showing that triskelia and dimers dominate the topological profiles (top insert, relative protein mass distribution) and that larger assemblies are also present (lower insert, particle counts on an enlarged scale; identical abscissa). About 46% of the protein mass is found in a few large cage assemblies containing 100 to 300 triskelia (insert in (A)). (C) Examples of triskelion monomers (top row), non-compact dimers (middle row), and compact dimers (bottom row), viewed on a 2 nm color height scale.
Despite some inherent limitations, AFM topographic imaging can be used to obtain quantitative measures of molecular shape and size (see online Supplement). Volume analysis reveals discrete populations of triskelion monomers (near 760 nm3), dimers (vertical Oval region), some small oligomers, and larger particles (horizontal Oval region) consistent with flattened cage structures (in Fig. 4A, note log-scale for the x-axis). For all structures, the average height (crosses) is about a third of the apex height (circles), the latter being nominally about 1 nm for monomers (Fig. 3B and Fig. 4A), rising to 20 nm for large assemblies (Fig. 4A). The volume histogram, computed for 2724 measured particles, more clearly shows that individual triskelia and dimers dominate (Fig. 4B & top insert), and that the larger assemblies have a wide size distribution. Assuming linear proportionality between AFM volume and protein mass, the relative mass weighting is approximately: monomers at 17.5 %, triskelion dimers at 5.5 %, structures containing three and four triskelia at 3%, and all triskelion structures containing up to a few hundred triskelia for the remaining mass of 74%. While very large assemblies that contain between 100 and 300 triskelia are only about 1% in number, they comprise about 46% of the protein mass.
The relative number of dimers is greater in the samples deposited from assembly buffer. About 14% of the small particles are observed to be dimers, indicating that the dimers and oligomers most likely are true, intermediate assembly products (see online Supplement). Furthermore, our AFM imaging clearly detects two classes of triskelion dimers, viz., non-compact dimers (Fig. 4C, middle row) and compact dimers (Fig. 4C, lower row). The loose dimers have apex heights similar to those of the monomers (Fig. 4C, top row). The compact dimers, however, are flatter and feature overlapping triskelion legs, perhaps representing structures further along the clathrin assembly pathway. Clathrin assembly is known to be regulated by adaptor proteins and the presence and identities of the clathrin light chains [24,25,30,31]. Our purified triskelia are fully saturated with one light chain of either type ‘a’ or type ‘b’ tightly bound to each heavy chain. Under traditional assembly protocols, they form characteristic clathrin cages whose size distributions depend on the presence or absence of AP180 (see online Supplement, Fig. S1).
IV. Summary and Discussion
Our AFM imaging agrees with prior understanding of the static structure of clathrin triskelia [27,28,32], and reveals the dynamic behavior of triskelia moving in fluid, allowing us to directly visualize conformation fluctuations within each three-legged triskelion. Our high-resolution AFM imaging confirms that the legs are more or less equally flexible along their entire length, which is consistent with earlier electron microscopy studies [27,28]. We detected mostly monomers when triskelia were suspended in a neutral pH buffer that inhibits clathrin lattice assembly, but also found evidence of a small number of triskelion dimers. When the triskelia were prepared in a buffer (low salt, pH 6.2) that promotes triskelion-triskelion associations, a greater than two-fold increase in triskelion dimer formation, as well as appreciable cage assembly, was observed. The triskelion monomer/dimer balance and the distribution pattern of larger assemblies under these buffer conditions were quantified. Sequential AFM images also demonstrated structural changes and exchange of interaction partners in triskelion dimers.
We previously suggested that mechanical factors such as leg flexibility can affect the formation of clathrin cages and the creation and recycling of coated vesicles [22]. Our AFM imaging under fluid, and higher resolution AFM imaging in air, support the notion that triskelia can assume many configurations and engage in transient associations that lead to clathrin cage formation. This report also shows the utility of AFM for studying conformational fluctuations of nanoscopic biological assemblies.
Supplementary Material
Acknowledgments
We thank Dr. Dan Sackett (NICHD/NIH) for advice, Suping Jin (Univ. Texas HSC) for technical assistance, and Dr. Maria Aronova (NIBIB/NIH) for helpful comments. This work was supported in part by an extramural grant (EML, NS029051) and by the intramural research programs of the Eunice Kennedy Shriver National Institute of Child Health and Human Development (NICHD) and the National Institute of Biomedical Imaging and Bioengineering (NIBIB).
Footnotes
Structured summary:
MINT-7299119, MINT-7299136:
Clathrin (uniprotkb:P49951) and Clathrin (uniprotkb:P49951) bind (MI:0407) by atomic force microscopy (MI:0872)
Publisher's Disclaimer: This is a PDF file of an unedited manuscript that has been accepted for publication. As a service to our customers we are providing this early version of the manuscript. The manuscript will undergo copyediting, typesetting, and review of the resulting proof before it is published in its final citable form. Please note that during the production process errors may be discovered which could affect the content, and all legal disclaimers that apply to the journal pertain.
References
- 1.Conner SD, Schmid SL. Regulated portals of entry into the cell. Nature. 2003;422:37–44. doi: 10.1038/nature01451. [DOI] [PubMed] [Google Scholar]
- 2.Brodsky FM, Chen CY, Knuehl C, Towler MC, Wakeham DE. Biological basket weaving: Formation and function of clathrin- coated vesicles. Ann Rev Cell Dev Biol. 2001;17:517–568. doi: 10.1146/annurev.cellbio.17.1.517. [DOI] [PubMed] [Google Scholar]
- 3.Valeria C, Michela C, Jean G. Endocytosis and signaling cascades: a close encounter. FEBS Lett. 2001;498:190–196. doi: 10.1016/s0014-5793(01)02484-x. [DOI] [PubMed] [Google Scholar]
- 4.Bonazzi M, Cossart P. Bacterial entry into cells: A role for the endocytic machinery. FEBS Lett. 2006;580:2962–2967. doi: 10.1016/j.febslet.2006.04.010. [DOI] [PubMed] [Google Scholar]
- 5.Mousavi SA, Malerod L, Berg T, Kjeken R. Clathrin-dependent endocytosis. Biochem J. 2004;377:1–16. doi: 10.1042/BJ20031000. [DOI] [PMC free article] [PubMed] [Google Scholar]
- 6.Takamori S, et al. Molecular anatomy of a trafficking organelle. Cell. 2006;127:831–846. doi: 10.1016/j.cell.2006.10.030. [DOI] [PubMed] [Google Scholar]
- 7.Lafer EM. Clathrin-protein interactions. Traffic. 2002;3:513–520. doi: 10.1034/j.1600-0854.2002.30801.x. [DOI] [PubMed] [Google Scholar]
- 8.Chen YJ, Zhang PJ, Egelman EH, Hinshaw JE. The stalk region of dynamin drives the constriction of dynamin tubes. Nat Struct Mol Biol. 2004;11:574–575. doi: 10.1038/nsmb762. [DOI] [PubMed] [Google Scholar]
- 9.Wenk MR, De Camilli P. Protein-lipid interactions and phosphoinositide metabolism in membrane traffic: Insights from vesicle recycling in nerve terminals. Proc Natl Acad Sci USA. 2004;101:8262–8269. doi: 10.1073/pnas.0401874101. [DOI] [PMC free article] [PubMed] [Google Scholar]
- 10.Blondeau F, et al. Tandem MS analysis of brain clathrin-coated vesicles reveals their critical involvement in synaptic vesicle recycling. Proc Natl Acad Sci USA. 2004;101:3833–3838. doi: 10.1073/pnas.0308186101. [DOI] [PMC free article] [PubMed] [Google Scholar]
- 11.Yamashita T, Hige T, Takahashi T. Vesicle endocytosis requires dynamin-dependent GTP hydrolysis at a fast CNS synapse. Science. 2005;307:124–127. doi: 10.1126/science.1103631. [DOI] [PubMed] [Google Scholar]
- 12.Stoddart A, Dykstra ML, Brown BK, Song WX, Pierce SK, Brodsky FM. Lipid rafts unite signaling cascades with clathrin to regulate BCR internalization. Immunity. 2002;17:451–462. doi: 10.1016/s1074-7613(02)00416-8. [DOI] [PubMed] [Google Scholar]
- 13.Abrami L, Liu SH, Cosson P, Leppla SH, van der Goot FG. Anthrax toxin triggers endocytosis of its receptor via a lipid raft-mediated clathrin-dependent process. J Cell Biol. 2003;160:321–328. doi: 10.1083/jcb.200211018. [DOI] [PMC free article] [PubMed] [Google Scholar]
- 14.Ford MGJ, Mills IG, Peter BJ, Vallis Y, Praefcke GJK, Evans PR, McMahon HT. Curvature of clathrin-coated pits driven by epsin. Nature. 2002;419:361–366. doi: 10.1038/nature01020. [DOI] [PubMed] [Google Scholar]
- 15.De Camilli P, Chen H, Hyman J, Panepucci E, Bateman A, Brunger AT. The ENTH domain. FEBS Lett. 2002;513:11–18. doi: 10.1016/s0014-5793(01)03306-3. [DOI] [PubMed] [Google Scholar]
- 16.Habermann B. The BAR-domain family of proteins: a case of bending and binding? The membrane bending and GTPase-binding functions of proteins from the BAR-domain family. EMBO Reports. 2004;5:250–255. doi: 10.1038/sj.embor.7400105. [DOI] [PMC free article] [PubMed] [Google Scholar]
- 17.Bauer M, Pelkmans L. A new paradigm for membrane-organizing and -shaping scaffolds. FEBS Lett. 2006;580:5559–5564. doi: 10.1016/j.febslet.2006.08.077. [DOI] [PubMed] [Google Scholar]
- 18.Langer JD, Stoops EH, Bethune J, Wieland FT. Conformational changes of coat proteins during vesicle formation. FEBS Lett. 2007;581:2083–2088. doi: 10.1016/j.febslet.2007.03.020. [DOI] [PubMed] [Google Scholar]
- 19.Merrifield CJ, Feldman ME, Wan L, Almers W. Imaging actin and dynamin recruitment during invagination of single clathrin-coated pits. Nature Cell Biol. 2002;4:691–698. doi: 10.1038/ncb837. [DOI] [PubMed] [Google Scholar]
- 20.Cao H, Weller S, Orth JD, Chen J, Huang B, Chen JL, Stamnes M, McNiven MA. Actin and Arf1-dependent recruitment of a cortactin-dynamin complex to the Golgi regulates post-Golgi transport. Nature Cell Biol. 2005;7:483–492. doi: 10.1038/ncb1246. [DOI] [PubMed] [Google Scholar]
- 21.Tsujita K, Suetsugu S, Sasaki N, Furutani M, Oikawa T, Takenawa T. Coordination between the actin cytoskeleton and membrane deformation by a novel membrane tubulation domain of PCH proteins is involved in endocytosis. J Cell Biol. 2006;172:269–279. doi: 10.1083/jcb.200508091. [DOI] [PMC free article] [PubMed] [Google Scholar]
- 22.Jin AJ, Prasad K, Smith PD, Lafer EM, Nossal RJ. Measuring the elasticity of clathrin coated vesicles via atomic force microscopy. Biophys J. 2006;90:3333–3344. doi: 10.1529/biophysj.105.068742. [DOI] [PMC free article] [PubMed] [Google Scholar]
- 23.Ferguson ML, Prasad K, Boukari H, Sackett DL, Krueger S, Lafer EM, Nossal R. Clathrin triskelia show evidence of molecular flexibility. Biophys J. 2008;95:1945–1955. doi: 10.1529/biophysj.107.126342. [DOI] [PMC free article] [PubMed] [Google Scholar]
- 24.Ye W, Lafer EM. Bacterially expressed F1-20/AP-3 assembles clathrin into cages with a narrow size distribution: Implications for the regulation of quantal size during neurotransmission. J Neurosci Res. 1995;41:15–26. doi: 10.1002/jnr.490410104. [DOI] [PMC free article] [PubMed] [Google Scholar]
- 25.Morgan JR, Prasad K, Jin S, Augustine GJ, Lafer EM. Eps15 homology domain-NPF motif interactions regulate clathrin aoat assembly during synaptic vesicle recycling. J Biol Chem. 2003;278:33583–33592. doi: 10.1074/jbc.M304346200. [DOI] [PubMed] [Google Scholar]
- 26.Roach SA. The Theory of Random Clumping. Methuen and Co; London: 1968. [Google Scholar]
- 27.Kocsis E, Trus BL, Steer CJ, Bisher ME, Steven AC. Image averaging of flexible fibrous macromolecules: The clathrin triskelion has an elastic proximal segment. J Struct Biol. 1991;107:6–14. doi: 10.1016/1047-8477(91)90025-r. [DOI] [PubMed] [Google Scholar]
- 28.Kirchhausen T, Harrison SC, Heuser J. Configuration of clathrin trimers - evidence from electron-microscopy. J Ultrastruct Mol Struct Res. 1986;94:199–208. doi: 10.1016/0889-1605(86)90067-4. [DOI] [PubMed] [Google Scholar]
- 29.Jin AJ, Nossal R. Rigidity of triskelion arms and clathrin nets. Biophys J. 2000;78:1183–1194. doi: 10.1016/S0006-3495(00)76676-8. [DOI] [PMC free article] [PubMed] [Google Scholar]
- 30.Slepnev VI, De Camilli P. Accessory factors in clathrin-dependent synaptic vesicle endocytosis. Nat Rev Neurosci. 2000;1:161–172. doi: 10.1038/35044540. [DOI] [PubMed] [Google Scholar]
- 31.Ybe JA, Perez-Miller S, Niu Q, Coates DA, Drazer MW, Clegg ME. Light chain C-terminal region reinforces the stability of clathrin heavy chain trimers. Traffic. 2007;8:1101–1110. doi: 10.1111/j.1600-0854.2007.00597.x. [DOI] [PubMed] [Google Scholar]
- 32.Ybe JA, et al. Clathrin self-assembly is mediated by a tandemly repeated superhelix. Nature. 1999;399:371–375. doi: 10.1038/20708. [DOI] [PubMed] [Google Scholar]
Associated Data
This section collects any data citations, data availability statements, or supplementary materials included in this article.


