Abstract
The present study explored the bioavailability and brain deposition of a Grape Seed Polyphenolic Extract (GSPE) previously found to attenuate cognitive deterioration in a mouse model of Alzheimer’s disease (AD). Plasma pharmacokinetic response of major GSPE phenolic components was measured following intragastric gavage of 50, 100 and 150 mg GSPE per kg BW. LC-MS analysis identified gallic acid (GA), catechin (C), epicatechin (EC) in plasma of rats gavaged acutely with GSPE. Additionally, 4-methylgallic acid (4-OMeGA), 3′-methytlcatechin (3′-OMeC) and 3′-methylepicatechin (3′-OMeEC) were identified as circulating metabolites of GSPE phenolic constituents. Cmax for individual GSPE constituents and their metabolites increased in a dose-dependent fashion (with increasing GSPE oral dose). Repeated daily exposure to GSPE was found to significantly increase bioavailability (defined as plasma AUC0-8h) of GA, C and EC by 198, 253 and 282% relative to animals receiving only a single acute GSPE dose. EC and C were not detectable in brain tissues of rats receiving a single GSPE dose but reached levels of 290.7±45.9 and 576.7±227.7 pg/g in brain tissues from rats administered GSPE for 10 days. This study suggests that brain deposition of GA, C and EC is affected by repeated dosing of GSPE.
Keywords: Grape seed extract, bioavailability, catechins, gallic acid, brain, pharmacokinetics
INTRODUCTION
Alzheimer Disease (AD) is a progressive brain disease affecting greater than 5.0 million Americans with approximately 11 to 16 million people projected to be afflicted with AD by the year 2050 [1, 2]. A hallmark of AD pathology is deposition of amyloid neuritic plaques comprised primarily of β-amyloid (Aβ) peptides in the brain. Accumulation of high molecular weight (HMW) soluble oligomeric Aβ species is hypothesized to initiate a cascade of cellular events resulting in synaptic failure, neuronal injury, apoptotic neuronal death, and ultimately, cognitive and functional decline including deficits in spatial memory [3–9]. Accumulation of soluble HMW oligomeric Aβ peptides in brain may accelerate early-onset behavioral impairment and synaptic deficits [9, 10]. Strategies to reduce accumulation of soluble oligomeric Aβ peptides species in the brain may provide productive approaches for preventing and/or treating AD.
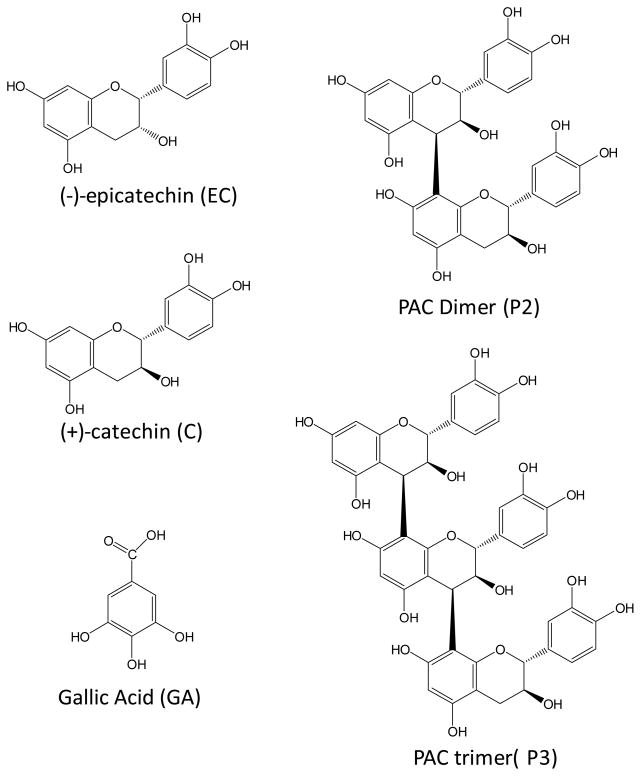
Of the many potential dietary and supplemental approaches, grape and grape derived supplements have demonstrated biological activities consistent with prevention and/or amelioration of AD [11–13]. Long-term administration of a polyphenol rich grape seed extract (GSPE), namely Meganatural-AZ® GSPE in particular has demonstrated the ability to exert potent anti-Aβ-oligomerization activity [14] and to attenuate the oligomerization of Aβ peptides into HMW soluble species in the brain of a mouse model of AD [15]. This bioactive GSPE preparation is comprised of proanthocyanidins (PAC), which is the most abundant and complex class of polyphenol found in grapes. PAC’s are composed of flavan-3-ols units known as catechins (Figure 1). The most abundant in grape include catechin (C), epicatechin (EC), catechin gallate (CG) and epicatechin gallate (ECG). Along with this complex monomer fraction over 25 PAC dimers, trimers and oligomers have been identified in grape seed extracts such as Meganatural-AZ®.
Figure 1.
Chemical structure of gallic acid (GA), catechin (C), epicatechin (EC) and a basic proanthocyanidin (PAC) dimer (P2) and PAC trimer (P3). GSPE PAC’s are composed of individual units including C and EC linked to each other by either C4–C8 or C4–C6 linkages. Gallate is generally substituted to position 3 in the monmeric units but most have been hydrolyzed in the GSPE extract (MegaNatural-AZ) used in this study.
With evidence from animal models suggesting a potential role for orally supplemented GSPE in prevention and/or amelioration of AD-type amyloid neuropathology and cognitive dysfunction [15], defining the specific biologically active and bioavailable component(s) present in this crude bioactive preparation has become central to understanding the role GSPE and other dietary polyphenol preparations may play in modifying specific disease endpoints. Acute and single dose studies have demonstrated that bioavailability of GSPE phenolics including gallic acid and PAC’s monomers such as C and EC is poor (<2% of oral dose) with intestinal absorption of PAC dimers, timers and complex oligomers observed to be extremely limited [16–18]. Several factors are believed to impact PAC intestinal absorption including the extent of oligmerization, trans-epithelial transport efficiency, rapid metabolism and clearance from the body [19–22]. While providing important insight, many of these acute studies do not resemble the longer-term treatments utilized in biological assessments with GSPE in animal models of AD [15]. Understanding how bioavailability and metabolism of GSPE components may be altered during repeated exposure is critical to defining active principles and determining the extent to which animals and eventually humans may adapt to chronic treatments. The overall objective of this study was to characterize plasma pharmacokinetics and brain deposition of phenolics from increasing doses of Meganatural-AZ® GSPE and to determine if repeated exposure to GSPE impacts subsequent absorption and deposition of phenolic constituents in Sprague Dawley rats.
MATERIALS AND METHODS
Chemicals and materials
Gallic acid (GA), (+)-catechin (C) and (−)-epicatechin (EC) and β-glucuronidase (with sulfatase contamination) were purchased from Sigma Chemical Co. (St. Louis, MO). All extraction and LC solvents were of certified HPLC and ACS and were obtained from J.T. Baker (Phillipsburn, NJ). Isoflurane was obtained from Baxter Healthcare Center (Deerfield, IL). GSPE (Meganatural-AZ®) powder was obtained from Polyphenolics (Madera, CA) and was specially processed to contain minimal amounts of gallated PAC’s (<12% by wt). Consistent with our previous studies establishing the efficacy of a specific GSPE preparation (Meganatural-AZ® GSPE) in modulating the development of Aβ neuropathology and cognitive impairment in an AD mouse model [15], the same bioactive GSPE preparation was used in the present study.
Meganatural-AZ® GSPE Pharmacokinetics
Bioavailability of Meganatural-AZ® GSPE phenolic constituents was assessed using male Sprague Dawley rats. All animal studies were conducted under guidance and with protocols reviewed and approved by the Purdue University Animal Care and Use Committee. Thirty two Sprague Dawley rats weighing between 275 and 300g were obtained from Harlan Sprague Dawley, Inc. (Indianapolis, IN). Upon arrival Rats (~295 g) and were placed on a polyphenol free AIN-93M diet (Dyets, Bethleham, PA) and given deionized water ad lib and allowed to acclimate for three days. Following acclimation, anesthesia was induced with isoflurane (3–5%) in an anesthesia chamber and maintained with a mask (1.5–3% isoflurane). A polyethylene catheter was implanted into the jugular vein. Burenorphine (0.01–0.5mg/kg) was administered prior to animals regaining consciousness to alleviate pain. Catheters were kept patent by flushing with heparinized saline containing 100 units of heparin per mL every 12 h. Animals were allowed 24 h of recovery time post surgery.
Prior to initiation of pharmacokinetic studies food was removed for 7 h prior to experiments and was offered 2 h after administration of GSPE. For single-dose acute pharmacokinetic studies GSPE was solubilized in 1.0 mL distilled water to deliver 50, 100 or 150 mg GSPE per kg BW and administered by intragastric gavage. These levels of GSPE represent human equivalent doses of 483, 967 and 1451 mg in a 60 kg human as described by the FDA Guidance for Industry and Reviewers on conversion to Human Equivalent Doses [23]. For the repeated exposure study a dose-escalation design was implemented with daily gavage treatments of GSPE administered to rats as follows: Day 1–2 (50 mg/kg BW); Day 3–4 (100 mg/kg BW); Day 5–10 (150 mg/kg BW). On day 10, pharmacokinetics were assessed following administration of the last GSPE dose (150 mg per kg BW) by collecting approximately 400 μL of blood at 0, 0.5, 1, 2, 4, 6 and 8 h post-gavage from the jugular catheter into heprinized tubes and centrifuged at 4,000 rpm for 10 minutes. Two hundred μL of resulting plasma was collected and combined with 50 μL acidified saline (1% ascorbic acid wt/wt), purged with N2 and stored at −80° C until analysis. Brains were harvested and placed in 0.2% ascorbic acid in saline, and stored at −80 °C until analysis.
Phenolic Extraction
GA and PAC’s were extracted from homogenized plasma and brain tissue by incubating samples with 1 mL of enzyme solution (250 U β-glucuronidase with sulfatase activity in 0.4 M NaH2PO4 pH 4.5) for 45 minutes at 37°C. Following incubation, samples were extracted three times with ethyl acetate/0.01% BHT. Combined ethyl acetate fractions were vacuum dried, sonicated and resolublized in 200 μL mobile phase prior to analysis.
LC-UV-MS Analysis
Analysis of GSPE was accomplished by LC-UV-MS as described by Wu et al. [24]. This method was modified slightly for analysis of plasma and tissue extracts. Briefly, separations were performed on an Agilent 1100 system (Palo Alto, CA) using a Varian C18 Amide column (3 μm, 150 × 2.1 mm i.d). A binary mobile phase consisting of solvent systems A and B were used in gradient elution where A was 0.1% formic acid (v/v) in ddH2O and B was 0.1% formic acid (v/v) in acetonitrile. Mobile phase flow rate was 0.3 mL/min. Initial conditions were set at 90:10 A:B with a linear gradient to 80:20 from 0 to 12 min, conditions were held at 80:20 from 12 to 18 min, followed by a linear gradient to 50:50 from 18 to 24 min and held at 50:50 until 30 min. Gradient conditions were reset to 90:10 A:B from 30 to 32 min, and the column equilibrated for 10 minutes at initial conditions prior to the next run. Following separation the column effluent was introduced by negative mode electrospray ionization (ESI) into an Agilent MSD-TOF spectrometer. ESI capillary voltage was −3.5 kV, nebulizer gas pressure was set at 35 psig, gas temperature was 350 °C, drying gas flow rate was 9.0 L/min, fragmentor voltage was set to 165 V, skimmer 60 V and OCT RF V 250 V. Spectroscopic (UV at 280 nm) and mass data (from m/z 60–1000) were collected and analyzed using Analyst QS1.1 software (Applied Biosystems/MSD Sciex). GA, C and EC quantification was accomplished using a multi-level calibration curve constructed with authentic standards. Quantities of methylated derivatives, 4-OMeGA, 3′-OMeC and 3′-OMeEC, were estimated by using calibration curves from parent compounds GA, C and EC respectively.
Data Analysis
All data are presented as mean ± standard error of the mean (SEM). Plasma area under the curve values from 0 to 8h (AUC0-8h) were calculated using the trapezoidal rule. The maximum plasma concentration (Cmax) and time of maximum plasma concentration (Tmax) were obtained directly from the pharmacokinetic plot of plasma concentration versus time. Group differences were determined by analysis of variance using Tukey’s post-hoc test (α< 0.05, SAS, Cary, NC).
RESULTS & DISCUSSION
Phenolic composition of Meganatural-AZ® GSPE
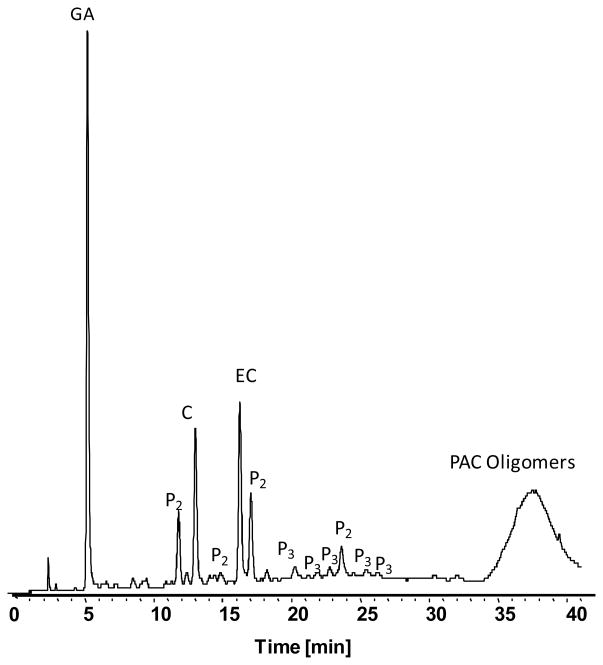
The 12 major PAC’s identified by LC-UV-MS analysis are illustrated in Figure 2. Resolution of GA, monomeric PAC’s (C and EC) as well as several PAC dimers (P2) and trimers (P3) was achieved in 40 min. Additionally, a broad peak containing poorly resolved PAC oligomers was observed between 35 and 40 minutes. Quantities of GA, C and EC in GSPE were found to be 91, 147 and 164 mg/g dry weight.
Figure 2.
LC-UV separation of major GSPE PAC’s demonstrates the presence of gallic acid (GA), monomeric PAC’s (C and EC) along with dimer (P2), trimer (P3) and oligomeric PAC’s. Compounds were identified based on in line MS spectra as described by Wu et al. [24]. UV signal at 280nm is shown.
Characterization of GSPE phenolic components in rat plasma
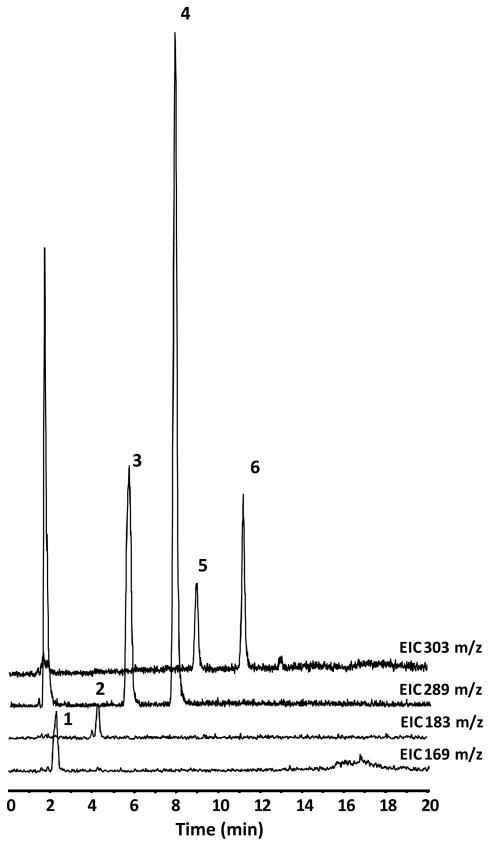
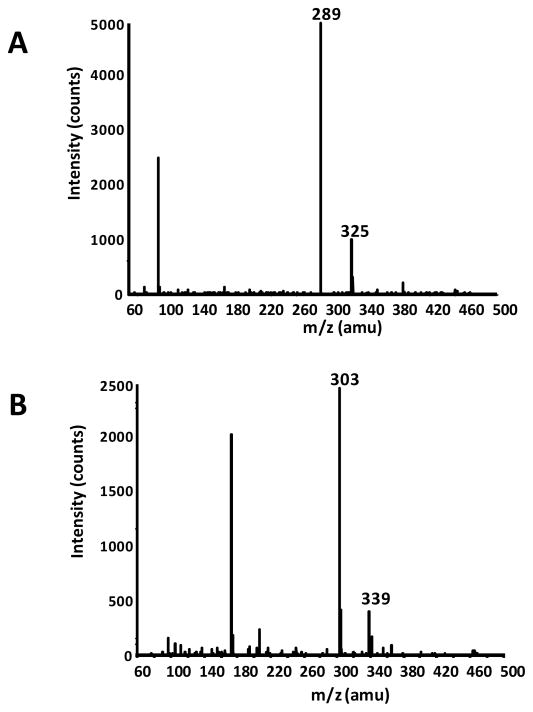
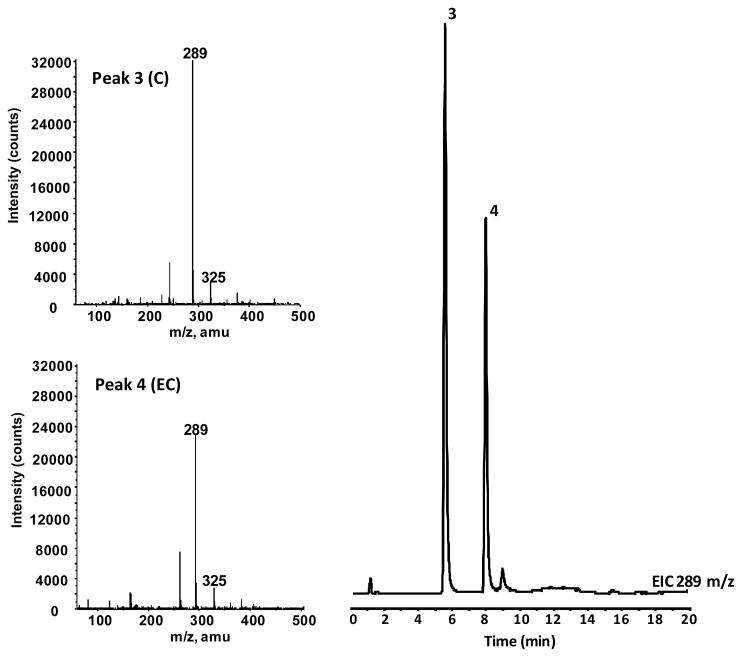
In vivo bioavailability of GSPE polyphenol components were investigated using a Sprague Dawley rat model. Studies were conducted measuring plasma pharmacokinetic response (0-8h) of GSPE polyphenols from a single oral gavage. Collected blood was processed to plasma and treated with β-glucouronidase and sulfatase enzymes prior to extraction with ethyl acetate allowing for assessment of free and methylated GSPE phenolic constituents. PAC monomers, C and EC, as well as GA were detected in rat plasma following acute oral administration of GSPE (Figure 3). These compounds were confirmed based on co-chromatography with authentic standards and from collected in line MS spectra for C and EC (Table 1; Figure 4). Dimer, trimer and larger oligomeric PAC’s present in GSPE (Figure 2) were not detected in plasma following acute administration, suggesting a reduced relative bioavailability of these more complex PAC’s compared to monomeric C and EC. The higher response of monomers catechins relative to more complex proanthocyanidins in an acute dosage study is consistent with previous observations in vivo [18, 20].
Figure 3.
LC-MS separation of major GSPE phenolic constituents from an extract of rat plasma. LC-MS conditions can be seen in Material and Methods. Extracted ion chromatograms at169, 183, 289, and 303 m/z are shown. Peak identifications can be seen in Table 1.
Table 1.
Phenolic compounds observed in plasma of rats administered GSE. LC-MS retention times (tr) and deprotonated molecule ([M-H]−) Mass-to-Charge ratios from negative mode ESI-MS.1,2,3
| Peak | Identification | LC tr (min) | [M-H]− (m/z) |
|---|---|---|---|
| 1 | GA | 2.3 | 169 |
| 2 | 4-OMeGA | 4.1 | 183 |
| 3 | C | 5.8 | 289 |
| 4 | EC | 7.9 | 289 |
| 5 | 3′-OMeC | 9.0 | 303 |
| 6 | 3′-OMeEC | 11.2 | 303 |
Refer to Materials and Methods section for HPLC--MS conditions
Abbreviations: GA=Gallic Acid; 4-OMeGA = 4-methylgallic acid; C = catechin; 3′-OMeC =3′methylcatechin; EC = epicatechin; 3′-OMeEC = 3′-methyepicatechin.
Figure 4.
Collected in-line MS spectrum of (A) peak 3 identified as EC and (B) peak 5 tentatively identified as 3′-OMeEC.
In addition to free GA and catechins, methylated metabolites were observed in rat plasma following acute oral GSPE administration (Figures 3 and 4) indicating a significant degree of metabolism for these phenolic compounds common to GSPE preparations. Based on previous reports [25–27] and in-line MS spectra these compounds were tentatively identified 4-O-methylgallic acid (4-OMeGA), 3′-O-methylcatechin (3′-OMeC) and 3′-O-methylepicatechin (3′-OMeEC). The percentage C and EC in methylated form was dependent on dose level. At the lowest acute dose (50 mg/kg BW) methylated derivatives represented approximately 8 and 10% of total C and EC in plasma of acutely treated rats (Table 2). The relative amount 3′-OMeC and 3′-OMeEC increased to 23 and 28% of the total C and EC respectively in rats receiving a single dose of 150 mg/kg BW. In rats receiving 10 days of repeated GSPE dosing prior to pharmacokinetic studies, 3′-OMeC and 3′-OMeEC content similar to high single dose (150 mg/kg BW) at 18 and 21% of the total C and EC present in rat plasma. Amount of 4-OMeGA was similar for all single acute GSPE treatments with methylated GA representing between 15 and 18% of the total GA. However, following repeated treatments, 4-OMeGA was found to increase to ~28% of the total plasma GA originating from GSPE.
Table 2.
Pharmacokinetic parameters from single GSE dose as influenced by dose level and pretreatment with repeated dosing (RD).4,5,6
| Parameter | ||||
|---|---|---|---|---|
| GSE Dose5 (mg/kg body wt) | AUC(0-8h) (ng/mL*h) | Cmax (ng/mL) | Tmax (h) | |
| GA | 50 | 512.7 ± 89.3 a | 309.8 ± 102.6 a | 0.9 ± 0.1 |
| 100 | 673.1 ± 54.5 a | 239.6 ± 39.2 a | 1.3 ± 0.2 | |
| 150 | 707.2 ± 95.9 a | 323.4 ± 76.9 a | 0.9 ± 0.2 | |
| 150 RD | 2111.9 ± 406.5 * | 968.4 ± 211.9 * | 0.9±0.1 | |
| C | 50 | 398.5 ± 80.5 a | 207.5 ± 34.8 a | 1.7 ± 0.7 |
| 100 | 606.1 ± 64.6 a | 289.9 ± 37.2 a | 1.8 ± 0.2 | |
| 150 | 1168.2 ± 143.6 b | 442.4 ± 49.1 b | 1.1 ± 0.2 | |
| 150 RD | 4131.5 ± 703.1 * | 1983.1 ± 417.6 * | 1.0 ± 0.0 | |
| EC | 50 | 682.7 ± 98.7 a | 318.8 ± 41.1 a | 1.0 ± 0.1 |
| 100 | 1197.9 ± 136.4 a | 552.1 ± 80.9 b | 1.5 ± 0.2 | |
| 150 | 2186.9 ± 274.9 b | 783.4 ± 90.4 c | 1.2 ± 0.2 | |
| 150 RD | 8364.9 ± 1631.9 * | 3859.7 ± 859.9* | 1.1±0.1 | |
| 4-OMeGA | 50 | 92.3 ± 12.6 a | 49.5 ± 5.9 a | 0.9 ± 0.1 |
| 100 | 148.0 ± 16.0 a,b | 68.4 ± 6.0 a | 0.8 ± 0.1 | |
| 150 | 162.4 ± 28.8 b | 73.7 ± 16.1 b | 0.9 ± 0.2 | |
| 150 RD | 805.0 ± 171.0 * | 379.0 ± 102.5 * | 1.1 ± 0.1 | |
| 3′-OMeC | 50 | 44.1 ± 4.9 a | 22.7 ± 3.5 a | 1.0 ± 0.0 |
| 100 | 184.8 ± 45.3 a | 75.5 ± 14.0 b | 1.4 ± 0.2 | |
| 150 | 465.1 ± 45.1 b | 129.3 ± 13.2 c | 1.3 ± 0.2 | |
| 150 RD | 1133.7 ± 261.4 * | 510.5 ± 131.4 * | 1.1 ± 0.1 | |
| 3′OMeEC | 50 | 60.5 ± 4.1 a | 36.8 ± 5.8 a | 1.0 ± 0.0 |
| 100 | 266.6 ± 61.4 b | 105.9 ± 22.0 a | 1.5 ± 0.2 | |
| 150 | 639.5 ± 67.0 c | 167.7 ± 19.6 a | 1.3 ± 0.2 | |
| 150 RD | 1977.8 ± 514.5 * | 815.5 ± 235.5 * | 1.8 ± 0.2 | |
Abbreviations: AUC(0-8h) = Plasma Area Under the Curve; Cmax = maximum plasma concentration; and Tmax = time of maximum plasma concentration
All GSE doses were administered as a single intragastric gavage. For 50, 100 and 150 mg/kg BW groups acute treatment was single and only exposure to GSE. For 150 RD group animals were pretreated with a repeated daily dose of GSE is dose escalation from 50 to150 mg/kg BW as described in Materials and Methods. Pharmacokinetic parameters were then assessed from an acute gavage of 150 mg/kg BW after dose escalation treatment.
Presence of different letter indicates a significant difference between single dose treatments (P <0.05). Presence of an asterisk (*) next to value indicates a significant difference (P < 0.05) between 150 and 150 RD treatments. No significant differences were observed in Tmax.
Detection of methylated GA, C, and EC metabolites confirms the metabolism of GSPE phenolic constituents following acute dosage. Previous reports demonstrated that catechin metabolites can represent as much as 50% of the total circulating catechin pool [28] and methylated C and EC have been identified in plasma and urine of rats treated with GSPE [18]. 4-O-methygallic acid has previously been identified as a primary metabolite of GA in human plasma and urine [25, 26]. Glucoronide and sulfate conjugates of C and EC were not assayed in these studies as samples were deconjugated with β-glucouronidase prior to LC-MS analysis. However, presence of these conjugated metabolites of C, EC and GA would be expected in plasma based on previously published reports [18, 25–28].
Plasma pharmacokinetic profiling of GSPE in Sprague Dawley rats
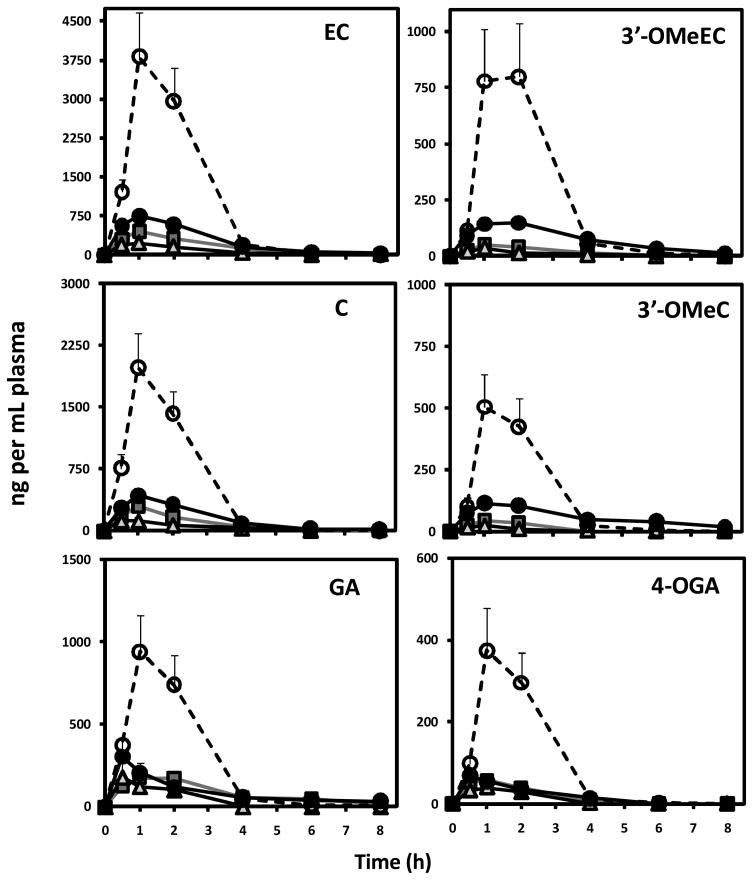
Eight hour plasma pharmacokinetic profile of GA, C, EC and corresponding methylated metabolites in rat plasma is presented in Figure 5. Following a single oral dose of 50 mg/kg BW of GSPE plasma levels of GA and monomeric C and EC peaked between 1 and 2h, reaching a Cmax of 309.8, 207.5 and 318.8 ng/mL plasma for GA, C and EC respectively (Table 2). This peak was followed by a significant drop between 2 and 4 h and returning to baseline levels by 8h post gavage for all GSPE phenolic constituents. With the exception of GA, increased acute dosage from 50 up to 150 mg/kg BW resulted in a corresponding increase in Cmax for individual phenolic species and their methylated derivatives reaching a high of 323.4, 442.2 and 783.4 ng/mL for GA, C and EC respectively (Figure 5; Table 2). 4-OMeGA, 3′-OMeC and 3′-OMe EC had similar plasma pharmacokinetic profiles to their free forms with peak plasma levels observed between 1 and 2 h with a Cmax of 73.7, 129.3 and 167.7 ng/ml plasma for 4-OMeGA and 3′-OMeC and 3′OMeEC respectively (Figure 5; Table 2).
Figure 5.
Plasma pharmacokinetic response of GA, C, EC and their corresponding methylated metabolites following intragastric gavage of ( ) 50, (
 ) 100 and 150 mg GSPE per kg BW (●) before and (○) after pre-treatment with dose-escalation of GSPE. Data represents mean ± SEM n=8 rats per group.
Bioavailability, assessed as area under the plasma pharmacokinetic curve (AUC0-8h), of catechins increased in dose-dependent fashion between 50 and 150 mg/kg BW (Table 2). In general plasma AUC0-8h for EC was higher than C pointing to the enhanced bioavailability of EC relative to C. This observation is consistent with previous reports of cocoa catechin bioavailability [28]. Total (free plus methylated) C AUC0-8h increased by 78% and 106% in 50 to 100 mg/kg BW and 100 to 150 mg/kg BW dose treatments respectively. Relative increase in 3′-OMeC AUC0-8h was more pronounced than for C. 3′-OMeC AUC0-8h increased from 44.1 to 184.8 and 465.1 ng/mL plasma*h when dose was increased from 50 to 150 mg/kg BW suggesting that as oral dose increased, metabolism of absorbed C was enhanced. Similarly, 3′-OMeEC AUC0-8h increased at a faster rate than free EC, but this increase was more modest in relative terms than for C. AUC0-8h for GA (512.7 to 673 ng/mL*h) and 4-OMeGA (92.3 to 1418.0 ng/mL*h) increased significantly (p<0.05) with GSPE dose up to 100mg/kg BW dose but did not increase further at 150mg//kg BW dose. These data suggest that while absorptions of catechins were not saturated under acute dosing conditions, GA absorption was saturable under these experimental conditions. Furthermore, intestinal uptake of GA from GSPE appears to be less efficient than catechins. Previous reports have indicated that GA absorption is lower than other phenolic acids and catechins [16, 29]. This is believed to be due, in part, to the reduce transport of GA by the monocarboxylic acid transporter relative to other phenolic compounds and may explain the observed absorption profile for GA following acute exposure.
Following a ten day exposure to GSPE in dose escalation from 50 to 150 mg/kg BW, plasma pharmacokinetic response was assessed from a single 150 mg/kg dose of GSPE. Plasma pharmacokinetic response of GSPE phenolic constituents was significantly impacted by the repeated daily GSPE treatment (Figure 5, Table 2). In rats pretreated with repeated daily doses of GSPE, absorption of GA, C and EC was observed to be significantly higher from a subsequent acute oral dose of 150 mg/kg BW GSPE. AUC and Cmax were significantly (P<0.01) higher for each phenolic constituent in these animals compared to single acute treatments with identical GSPE dose (Table 2). GA, C and EC AUC were found to increase by 198, 253, 282% respectively in animals given the GSPE exposure by dose escalation. The observed increase in plasma content for these phenolic constituents was not related to accumulation over the dose escalation as baseline levels were observed to be below the limit of quantification and in most cases below the limit of detection (data not shown). Trace but not quantifiable levels of dimer, trimer and oligomers were observed in plasma of rats receiving repeated doses of GSPE. This would suggest that enhancement of bioavailability was primarily limited to monomeric catechins and gallic acid components of GSPE. The bioavailability of epigallocatechin-gallate (EGCG), the primary flavan-3-ol in green tea, was observed to be improved by >60% following a four week multiple dose administration in humans [30]. The more modest improvement in EGCG bioavailability observed by Chow et al. [30] may be due, in part, to differences in catechin species and absorption between humans and rodents. With these differences in perspective, enhancement of bioavailability by repeated exposure to similar catechins provides evidence for potential adaptation to intestinal absorption of polyphenols.
Plasma AUC0-8h for catechin metabolites 3′-OMeC and 3′-OMe EC increased to a lesser extent (143 and 209% for 3′-OMeC and 3′-OMe EC respectively) than free catechins. On the other hand, 4-OMeGA AUC0-8h increased by 395% in animals receiving repeated dose treatments before assessing plasma pharmacokinetics. These data support the notion that repeated exposure to GSPE may not only enhance the bioavailability of specific GSPE phenolics but also alter proportion of methylated versus non methylated metabolites. High doses of EC have been shown to increase circulating levels of methylated EC [25, 31]. The full metabolite profile of C, EC and GA was not assayed in these experiments and therefore insight into how glucoronide and sulfate conjugation processes occur were not examined. The extent to which repeated GSPE exposure may alter circulating levels of these metabolites merits further investigation.
While the mechanisms responsible for these enhancements in bioavailability are not known, intestinal absorption of GA and monomer PAC’s such as C and EC are known to be dependent on active intestinal transporters including the monocarboxylic acid transporter [32, 33]. These transporters are primarily responsible for transferring polyphenols from the intestinal lumen into the enterocyte. Following intestinal uptake, phenolic constituents may be partially metabolized, secreted into circulation or effluxed back to the intestinal lumen by inducible ABC multidrug resistance transport proteins including P-glycoprotein and/or the Multi Drug Resistance Protein-2 (reviewed by [34]). It is therefore plausible that expression and/or activity of specific transport proteins may be modulated by repeated and even chronic exposure to high levels of phenolic constituents. Modulation of expression and/or activity would likely impact absorptive efficiency or bioavailability. Additionally, many phenolic constituents including PAC’s are metabolized by intestinal microflora resulting in degradation of the native structure and formation of additional metabolites of colonic origin [35, 36]. High concentrations of PAC polyphenols have also previously demonstrated the ability to alter the microbial ecology in the lower intestine through both prebiotic and antibiotic like activities [37–39]. Repeated dosing with high levels of GSPE may have altered the microbial ecology of the rat lower intestine and modified the capacity for colonic fermentation of dietary GSPE phenolics, thereby increasing the amount of native PAC’s available for absorption from subsequent doses.
Characterization of GSPE phenolic components in brain tissue
To gain preliminary insight on the deposition of specific GSPE polyphenols in brain, tissues from rats in the absence or in the presence of repeated pretreatment for 10 day with GSPE were perfused with cold saline, collected, extracted and analyzed for GA and PAC components by LC-MS. No detectable amounts of free GA, PAC’s or their methylated metabolites were found in brain extracts of rats acutely treated with 50, 100 or 150 mg GSPE/kg BW. Interestingly, detectable levels of GA and free C and EC were observed in brain tissues of animals subjected to pretreatment prior to pharmacokinetic dose. An extracted ion chromatogram (EIC) at 289 m/z of brain extract is illustrated in Figure 6. Detection of C and EC was achieved and tentatively identified based on in-line MS spectra and co-elution with authentic standards. Trace but not quantifiable levels of 3′-OMeC and 3′-OMeEC were observed but not confirmed due to limited concentrations (data not shown) making collection of confirmatory MS spectra difficult.
Figure 6.
LC-MS separation of major C and EC from extracts rat brain tissue collected after 10 day GSPE treatment in dose-escalation. LC-MS conditions can be seen in Material and Methods. Extracted ion chromatograms at 289 m/z is shown. Peak identifications can be seen in Table 1. Collected in-line MS spectrum of (A) peak 2 identified as C and (B) peak 3 identified EC is shown.
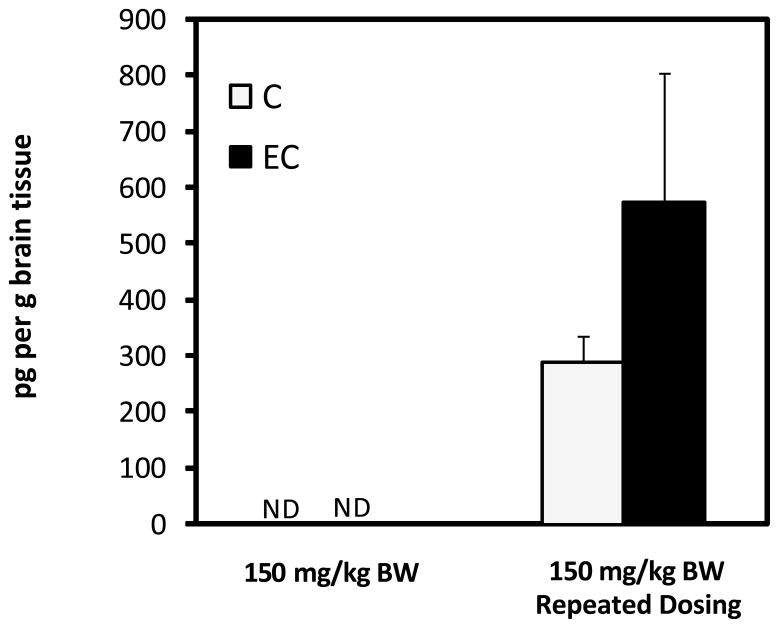
Abd El Mohsen et al. [25] have previously identified epicatechin glucuronide and glucuronide-methyl metabolites in perfused brain tissue of rats following oral ingestion of pure epicatechin (100 mg/kg BW) for 10 days with accumulation of approximately 0.4nmol/g or 116 ng/g in brain tissues. These levels were estimated as the concentration was determined by the investigators to be below the limit of accurate quantification. In the present study brain concentrations for EC and C were observed to be 290.7±45.9 and 576.7±227.7 pg/g respectively (Figure 7). Only trace levels of GA and methylated metabolites were observed to be present in brain tissue. The observed catechin concentration in brain tissues is lower than those reported previously from dosage of 100mg per kg BW of purified EC versus [25]. In both studies brain tissues were perfused with saline prior to dissection and extraction minimizing the potential for contaminating traces of blood known to contain these metabolites. Therefore, while accumulation appears to be lower in the present study, these data confirm that monomer catechins are available and deposited in brain tissues following oral consumption of crude GSPE at lower oral dosages (~46 mg C+EC in the 150 mg per kg BW dose) than those previously reported by Abd El Mohsen [25].
Figure 7.
Concentration (pg/g) of C and EC in brain tissue of following intragastric gavage of 150 mg GSPE per kg BW before and after pre-treatment with dose-escalation of GSPE. No detectable (ND) catechins or metabolites were found in brain tissues of rats receiving a single acute dose of GSPE. Data represents mean ± SEM n=8 rats per group.
Oral administration of GSPE has demonstrated the ability to alter endogenous antioxidant systems in brain tissues of Wistar rats [12], alter brain proteins associated with neurodegenerative diseases in amount and/or charge [11]. The Meganatural-AZ® GSPE analyzed in this study has demonstrated the ability to significantly attenuate cognitive deterioration and Aβ aggregation in the brain of Tg2576 mice, a model for AD [16]. However, the ability of specific GSPE components to be effectively absorbed and transported to the brain following oral administration has received little attention. The results of the present study indicate that GA, C and EC components in GSPE preparations are readily absorbed from acute doses and that plasma response of these constituents may be enhanced by repeated dosing. Furthermore, C and EC constituents were found to be present in brain tissues of animals receiving repeated dosing of GSPE for 10 days in agreement with previous experiments using purified EC [25]. While these data are promising, further experiments examining the differences in absorption, distribution and metabolism of GSPE polyphenols in AD relevant animal models are required to determine the extent to which these polyphenols may specifically attenuate cognitive deterioration and Aβ aggregation.
Concluding Remarks
The present study found that absorption and brain accumulation of small molecular weight GSPE constituents, namely GA and catechins is enhanced by repeated dosing. While this effect was observed following administration by oral gavage, the extent to which systemic bioavailability may be modulated from more complex food matrices merits further investigation. Also, the fate of more complex PAC dimers, trimers and oligomers merits further investigation. While not efficiently absorbed intact, these more complex polyphenolic compounds are believed to be fermented by intestinal microflora leading to the production of smaller molecular weight phenolic acids [34] and potentially other unknown metabolites of colonic origin. The extents to which these compounds are absorbed, distributed to brain tissue, are bioactive and may contribute to observed AD preventative or ameliorative activities is unknown and are currently being investigated in our laboratory.
Acknowledgments
Grape Seed Extract used in this study was generously provided by Polyphenolics (Madera, CA). The authors wish to thank Pamela Lachcik and Michael Grannan for technical assistance. Funding for these studies was provided by NIH-NCCAM grant P01AT004511-01 as part of the Mount Sinai School of Medicine Center of Excellence in Complimentary and Alternative Medicine for Alzheimer’s Disease.
ABBREVIATIONS
- Aβ
β-amyloid
- AD
Alzheimer’s disease
- AUC0-8h
area under the curve from 0 to 8h
- BW
body weight
- C
catechin
- Cmax
maximum plasma concentration
- CG
catechin gallate
- EC
epicatechin
- ECG
epicatechin gallate
- EGCG
epigallocatechin gallate
- GA
gallic acid
- GSPE
grape seed polyphenolic extract
- LC
liquid chromatography
- MS
mass spectrometry
- 3′-OMeC
3′-O-methylcatechin
- 3′-OMeEC
3′-O-methylepicatechin
- 4-OMeGA
4-O-methylgallic acid
- PAC
proanthocyanidin
- P2
proanthocyanidin dimer
- P3
proanthocyanidin trimer
- SEM
standard error of the mean
- Tmax
time of maximum plasma concentration
- UV
ultraviolet
References
- 1.Alzheimer’s disease facts and figures 2007 . Statistical abstract of US data on Alzheimer’s disease published by the Alzheimer’s Association. 2008 http://www.alz.org/national/documents/report_alzfactsfigures2007.pdf.
- 2.Hebert LE, Scherr PA, Bienias JL, Bennett DA, Evans DA. Alzheimer Disease in the US Population: Prevalence Estimates Using the 2000 Census. Arch Neurol. 2003;60:1119–22. doi: 10.1001/archneur.60.8.1119. [DOI] [PubMed] [Google Scholar]
- 3.Cleary J, Hittner JM, Semotuk M, Mantyh P, O’Hare E. Beta-amyloid(1–40) effects on behavior and memory. Brain Res. 1995;682:69–74. doi: 10.1016/0006-8993(95)00323-i. [DOI] [PubMed] [Google Scholar]
- 4.Cleary LM. Alzheimer’s disease and family caregivers. N C Med J. 2005;66:257. [PubMed] [Google Scholar]
- 5.Cole GM, Frautschy SA. Alzheimer’s amyloid story finds its star. Trends Mol Med. 2006;12:395–6. doi: 10.1016/j.molmed.2006.07.002. [DOI] [PubMed] [Google Scholar]
- 6.Lesne S, Koh MT, Kotilinek L, Kayed R, Glabe CG, Yang A, Gallagher M, Ashe KH. A specific amyloid-beta protein assembly in the brain impairs memory. Nature. 2006;440:352–7. doi: 10.1038/nature04533. [DOI] [PubMed] [Google Scholar]
- 7.Poling A, Morgan-Paisley K, Panos JJ, Kim EM, O’Hare E, Cleary JP, Lesne S, Ashe KH, Porritt M, Baker LE. Oligomers of the amyloid-beta protein disrupt working memory: Confirmation with two behavioral procedures. Behav Brain Res. 2008;193:230–4. doi: 10.1016/j.bbr.2008.06.001. [DOI] [PMC free article] [PubMed] [Google Scholar]
- 8.Selkoe DJ. Alzheimer’s disease: genes, proteins, and therapy. Physiol Rev. 2001;81:741–66. doi: 10.1152/physrev.2001.81.2.741. [DOI] [PubMed] [Google Scholar]
- 9.Cleary JP, Walsh DM, Hofmeister JJ, Shankar GM, Kuskowski MA, Selkoe DJ, Ashe KH. Natural oligomers of the amyloid-beta protein specifically disrupt cognitive function. Nature Neurosci. 2005;8:79–84. doi: 10.1038/nn1372. [DOI] [PubMed] [Google Scholar]
- 10.Jacobsen JS, Wu CC, Redwine JM, Comery TA, Arias R, Bowlby M, Martone R, Morrison JH, Pangalos MN, Reinhart PH, Bloom FE. Early-onset behavioral and synaptic deficits in a mouse model of Alzheimer’s disease. Proc Natl Acad Sci U S A. 2006;103:5161–6. doi: 10.1073/pnas.0600948103. [DOI] [PMC free article] [PubMed] [Google Scholar]
- 11.Deshane J, Chaves L, Sarikonda KV, Isbell S, Wilson L, Kirk M, Grubbs C, Barnes S, Meleth S, Kim H. Proteomics analysis of rat brain protein modulations by grape seed extract. J Agric Food Chem. 2004;52:7872–83. doi: 10.1021/jf040407d. [DOI] [PubMed] [Google Scholar]
- 12.Devi A, Jolitha AB, Ishii N. Grape seed proanthocyanidin extract (GSPE) and antioxidant defense in the brain of adult rats. Med Sci Monit. 2006;12:BR124–BR129. [PubMed] [Google Scholar]
- 13.Hwang IK, Yoo KY, Kim DS, Jeong YK, Kim JD, Shin HK, Lim SS, Yoo ID, Kang TC, Kim DW, Moon WK, Won MH. Neuroprotective effects of grape seed extract on neuronal injury by inhibiting DNA damage in the gerbil hippocampus after transient forebrain ischemia. Life Sci. 2004;75:1989–2001. doi: 10.1016/j.lfs.2004.05.013. [DOI] [PubMed] [Google Scholar]
- 14.Ono K, Condron MM, Ho G, Wang J, Zhao W, Pasinetti GM. Effects of Grape Seed-Derived Polyphenols on Amyloid β-Protein Self-Assembly and Cytotoxicity. J Biol Chem. 2008;283:32176–87. doi: 10.1074/jbc.M806154200. [DOI] [PMC free article] [PubMed] [Google Scholar]
- 15.Wang J, Ho L, Zhao W, Ono K, Rosensweig C, Chen L, Humala N, Teplow DB, Pasinetti GM. Grape-Derived Polyphenolics Prevent Aβ Oligomerization and Attenuate Cognitive Deterioration in a Mouse Model of Alzheimer’s Disease. J Neurosci. 2008;28:6388–92. doi: 10.1523/JNEUROSCI.0364-08.2008. [DOI] [PMC free article] [PubMed] [Google Scholar]
- 16.Konishi Y, Hitomi Y, Yoshioka E. Intestinal Absorption of p-Coumaric and Gallic Acids in Rats after Oral Administration. J Agric Food Chem. 2004;52:2527–32. doi: 10.1021/jf035366k. [DOI] [PubMed] [Google Scholar]
- 17.Sano A, Yamakoshi J, Tokutake S, Tobe K, Kubota Y, Kikuchi M. Procyanidin B1 is detected in human serum after intake of proanthocyanidin-rich grape seed extract. Biosci Biotechnol Biochem. 2003;67:1140–3. doi: 10.1271/bbb.67.1140. [DOI] [PubMed] [Google Scholar]
- 18.Tsang C, Auger C, Mullen W, Bornet A, Rouanet JM, Crozier A, Teissedre PL. The absorption, metabolism and excretion of flavan-3-ols and procyanidins following the ingestion of a grape seed extract by rats. Br J Nutr. 2005;94:170–81. doi: 10.1079/bjn20051480. [DOI] [PubMed] [Google Scholar]
- 19.Deprez S, Mila I, Huneau JF, Tome D, Scalbert A. Transport of proanthocyanidin dimer, trimer, and polymer across monolayers of human intestinal epithelial Caco-2 cells. Antioxid Redox Signal. 2001;3:957–67. doi: 10.1089/152308601317203503. [DOI] [PubMed] [Google Scholar]
- 20.Donovan JL, Manach C, Rios L, Morand C, Scalbert A, Remesy C. Procyanidins are not bioavailable in rats fed a single meal containing a grapeseed extract or the procyanidin dimer B3. Br J Nutr. 2002;87:299–306. doi: 10.1079/bjnbjn2001517. [DOI] [PubMed] [Google Scholar]
- 21.Manach C, Williamson G, Morand C, Scalbert A, Remesy C. Bioavailability and bioefficacy of polyphenols in humans. I. Review of 97 bioavailability studies. Am J Clin Nutr. 2005;81:230S–42S. doi: 10.1093/ajcn/81.1.230S. [DOI] [PubMed] [Google Scholar]
- 22.Scalbert A, Deprez S, Mila I, Albrecht AM, Huneau JF, Rabot S. Proanthocyanidins and human health: systemic effects and local effects in the gut. Biofactors. 2000;13:115–20. doi: 10.1002/biof.5520130119. [DOI] [PubMed] [Google Scholar]
- 23.FDA Guidance for Industry and Reviewers: Estimating the safe starting dose in clinical trials for theaputics in Adult Healthy Volunteers. December 2002.
- 24.Wu I, Wang M, Simon JE. Liquid chromatographic/mass spectrometric determination of proanthocyanidins in fresh grape and grape produces. Rapid Commun Mass Sp. 2005;19:2062–68. doi: 10.1002/rcm.2029. [DOI] [PubMed] [Google Scholar]
- 25.Abd El Mohsen MM, Kuhnle G, Rechner AR, Schroeter H, Rose S, Jenner P, Rice-Evans CA. Uptake and metabolism of epicatechin and its access to the brain after oral ingestion. Free Radic Biol Med. 2002;33:1693–702. doi: 10.1016/s0891-5849(02)01137-1. [DOI] [PubMed] [Google Scholar]
- 26.Shahrzad S, Bitsch I. Determination of gallic acid and its metabolites in human plasma and urine by high-performance liquid chromatography. J Chromatogr B. 1998;705:87–95. doi: 10.1016/s0378-4347(97)00487-8. [DOI] [PubMed] [Google Scholar]
- 27.Yasuda T, Inaba A, Ohmori M, Endo T, Kubo S, Ohsawa K. Urinary Metabolites of Gallic Acid in Rats and Their Radical-Scavenging Effects on 1,1-Diphenyl-2-picrylhydrazyl Radical. J Nat Prod. 2000;63:1444–6. doi: 10.1021/np0000421. [DOI] [PubMed] [Google Scholar]
- 28.Baba S, Osakabe N, Natsume M, Muto Y, Takizawa T, Terao J. In vivo comparison of the bioavailability of (+)-catechin, (−)-epicatechin and their mixture in orally administered rats. J Nutr. 2001;131:2885–91. doi: 10.1093/jn/131.11.2885. [DOI] [PubMed] [Google Scholar]
- 29.Konishi Y, Zhao Z, Shimizu M. Phenolic Acids Are Absorbed from the Rat Stomach with Different Absorption Rates. J Agric Food Chem. 2006;54:7539–43. doi: 10.1021/jf061554+. [DOI] [PubMed] [Google Scholar]
- 30.Chow HH, Cai Y, Hakim IA, Crowell JA, Shahi F, Brooks CA, Dorr RT, Hara Y, Alberts DS. Pharmacokinetics and safety of green tea polyphenols after multiple-dose administration of epigallocatechin gallate and polyphenon E in healthy individuals. Clin Cancer Res. 2003;9:3312–9. [PubMed] [Google Scholar]
- 31.Baba S, Osakabe N, Natsume M, Muto Y, Takizawa T, Terao J. Absorption and urinary excretion of (−)-epicatechin after administration of different levels of cocoa powder or (−)-epicatechin in rats. J Agric Food Chem. 2001;49:6050–6. doi: 10.1021/jf010965h. [DOI] [PubMed] [Google Scholar]
- 32.Vaidyanathan JB, Walle T. Transport and metabolism of the tea flavonoid (−)-epicatechin by the human intestinal cell line Caco-2. Pharm Res. 2001;18:1420–5. doi: 10.1023/a:1012200805593. [DOI] [PubMed] [Google Scholar]
- 33.Vaidyanathan JB, Walle T. Cellular uptake and efflux of the tea flavonoid (−)epicatechin-3-gallate in the human intestinal cell line Caco-2. J Pharmacol Exp Ther. 2003;307:745–52. doi: 10.1124/jpet.103.054296. [DOI] [PubMed] [Google Scholar]
- 34.Feng WY. Metabolism of green tea catechins: an overview. Curr Drug Metab. 2006;7:755–809. doi: 10.2174/138920006778520552. [DOI] [PubMed] [Google Scholar]
- 35.Gonthier MP, Cheynier V, Donovan JL, Manach C, Morand C, Mila I, Lapierre C, Remesy C, Scalbert A. Microbial Aromatic Acid Metabolites Formed in the Gut Account for a Major Fraction of the Polyphenols Excreted in Urine of Rats Fed Red Wine Polyphenols. J Nutr. 2003;133:461–7. doi: 10.1093/jn/133.2.461. [DOI] [PubMed] [Google Scholar]
- 36.Meng X, Sang S, Zhu N, Lu H, Sheng S, Lee MJ, Ho CT, Yang CS. Identification and Characterization of Methylated and Ring-Fission Metabolites of Tea Catechins Formed in Humans, Mice, and Rats. Chem Res Toxicol. 2002;15:1042–50. doi: 10.1021/tx010184a. [DOI] [PubMed] [Google Scholar]
- 37.Lee HC, Jenner AM, Low CS, Lee YK. Effect of tea phenolics and their aromatic fecal bacterial metabolites on intestinal microbiota. Res Microbiol. 2006;157:876–84. doi: 10.1016/j.resmic.2006.07.004. [DOI] [PubMed] [Google Scholar]
- 38.Parkar SG, Stevenson DE, Skinner MA. The potential influence of fruit polyphenols on colonic microflora and human gut health. Int J Food Microbiol. 2008;124:295–8. doi: 10.1016/j.ijfoodmicro.2008.03.017. [DOI] [PubMed] [Google Scholar]
- 39.Tzounis X, Vulevic J, Kuhnle GG, George T, Leonczak J, Gibson GR, Kwik-Uribe C, Spencer JP. Flavanol monomer-induced changes to the human faecal microflora. Br J Nutr. 2008;99:782–92. doi: 10.1017/S0007114507853384. [DOI] [PubMed] [Google Scholar]


