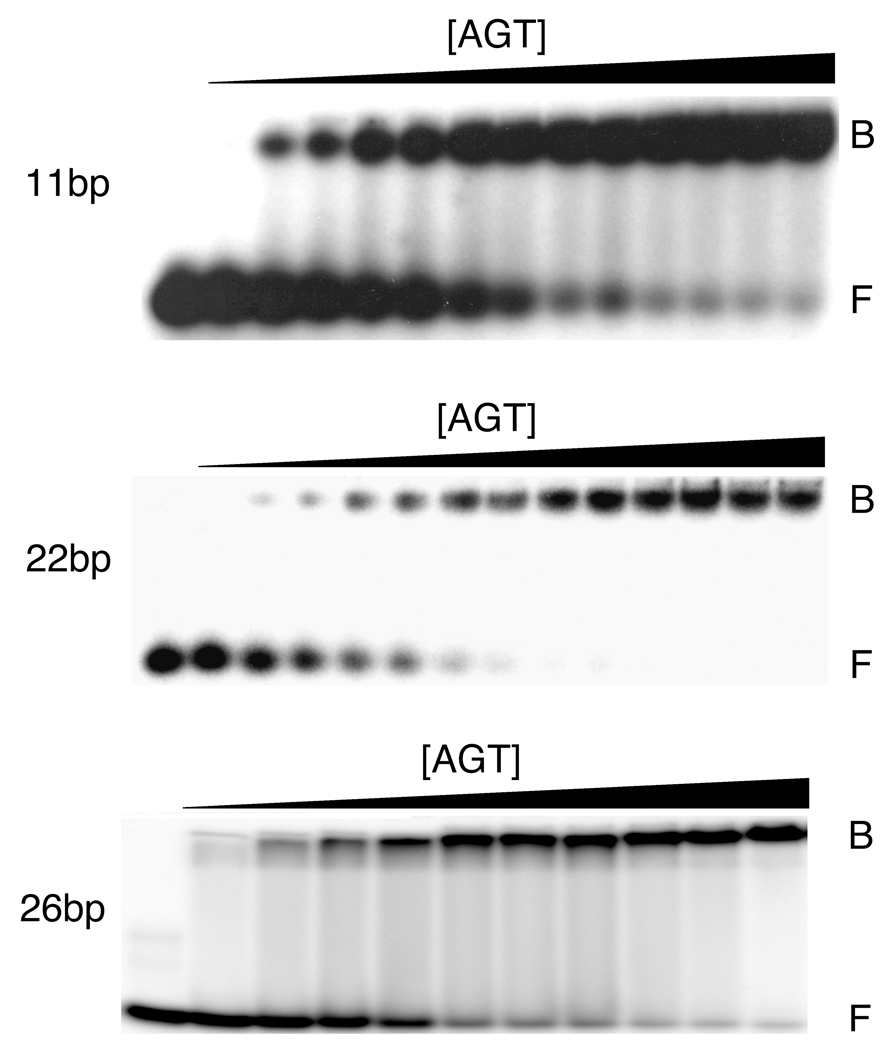
Fig. 1.
Titration of representative double-stranded DNAs with human AGT. Upper panel: 11-mer duplex DNA, 8.8 × 10⁻⁷ M with [AGT] increasing from 0M to 6.5 × 10⁻⁵ M from left to right. Middle panel: 22-mer duplex DNA, 3.6 × 10⁻⁷ M, with [AGT] increasing from 0 M to 1.5 × 10⁻⁵ M from left to right. Lower panel: 26-mer duplex DNA, 3.9 × 10⁻⁷ M, with [AGT] increasing from 0 M to 4.8 × 10⁻⁵ M, from left to right. Binding reactions were carried out at 20 ± 1 °C and samples were resolved on 10% polyacrylamide gels, as described in Experimental Procedures. Band designations B, bound DNA; F, free DNA. Although these images have been cropped and labeled for clarity, no additional bands were detectable between the origin of electrophoresis and the ionic front.

