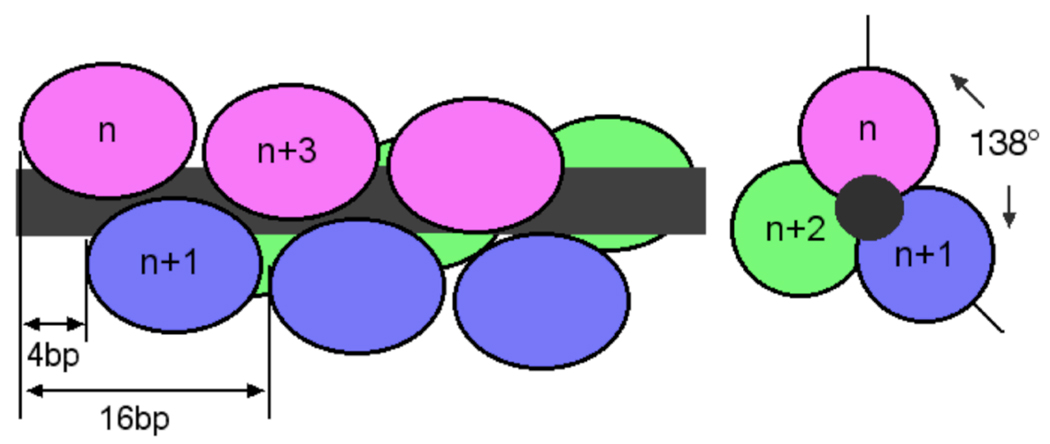
Fig. 6.
A model of binding topology for the cooperative array. Proteins are shown schematically as filled ovals and the DNA as a dark grey rod. Drawings are not to scale. Left, overlapping binding viewed from perpendicular to the DNA axis. Proteins are arranged as a three-start helix with individual arrays colored red, blue and green. Each protein is rotated ~138° with respect to its nearest neighbors, as predicted if all AGT molecules make identical contacts with the minor groove of B-form DNA and binding sites are separated by four base pairs. This view emphasizes the n-to-n+3 juxtaposition predicted for proteins along the same face of the DNA cylinder. Right: view down the long axis of the DNA. Only the first three proteins are shown for clarity. This view emphasizes the rotational juxtaposition of proteins n, n+1 and n+2.

