

Abstract
We combine atomic force microscopy particle size distribution measurements with earlier measurements on 1-anilino-8-naphthalene sulfonate, thioflavin T and dynamic light scattering to develop a quantitative kinetic model for the aggregation of β-lactoglobulin into amyloid. We directly compare our simulations to the population distributions provided by dynamic light scattering and atomic force microscopy. We combine species in the simulation according to structural type to compare with the fluorescence fingerprint results. The kinetic model of amyloidogenesis leads to an aggregation free energy landscape. We define the roles of and propose a classification scheme for different oligomeric species based on their location on the aggregation free energy landscape. We relate the different types of oligomers to the amyloid cascade hypothesis and the toxic oligomer hypothesis for amyloid-related diseases. We discuss existing kinetic mechanisms in terms of the different types of oligomers. We provide a possible resolution to the toxic oligomer-amyloid coincidence.
Keywords: atomic force microscopy, fluorescence, dynamic light scattering, protein aggregation, amyloid
Introduction
Proposed mechanisms of amyloid growth remain idiosyncratic to the precursor, conditions, and methods used. Our aim is to directly observe oligomeric intermediates and develop a detailed molecular model of amyloidogenesis. Such a model allows construction of an amyloidogenic aggregation free energy landscape and enables a more universal approach to evaluating the roles of different amyloid-related species.
Amyloid deposition is observed in more than 20 diseases, including Alzheimer’s disease, Creutzfeldt-Jakob’s disease and Parkinson’s disease. Each amyloid-related disease has a particular precursor protein or peptide that converts from its soluble native state to insoluble cross-β amyloid assemblies.1–4 These diseases typically show a symptom-free latency period that is significantly shortened in the case of certain single amino acid familial mutations of the relevant precursor,5–8 or gene triplication.9 in vitro aggregation studies tend to show correlation between the amyloidogenic properties of different mutants and disease severity.10–13 However, how this protein accumulation participates in the etiology of many of these diseases is still not fully understood.1,3,14 We discuss the role of oligomers in amyloid-related diseases based on two hypothesis that differ in the identity of the pathogenic species.
The amyloid cascade hypothesis suggests that amyloid is the major causative agent in amyloid-related diseases.15 Formation of amyloid is often explained by a nucleation-dependent kinetic mechanism. Once a critical nucleus is formed. the protein in question rapidly aggregates into amyloid fibrils and plaques. Massive fibril deposits can interfere with normal organ function. Amyloid lesions can induce an inflammatory response.16,17 Mature amyloid fibrils were also found to induce cell death in vitro.18,19 However, other studies have shown amyloid fibrils to be relatively innocuous, leaving doubt as to their significance.20–22
To explain the poor correlation between amyloid load with disease progression, the toxic oligomer hypothesis has emerged. Evidence is mounting that soluble oligomeric intermediates have significant cytotox-icity.14,23–31 The toxic oligomer hypothesis states that the inherent toxicity of small oligomers of the amyloidogenic protein causes cellular dysfunction and that the presence of amyloid in amyloid-related diseases is coincidental, not causative. Cytotoxicity has been observed for oligomers of both disease-related32–37 and non–disease-related38 proteins, suggesting that misfolded aggregates in general are pathological and calling into question the specific nature of the proteins associated with each disease.
Toxicity assays often involve cells and conditions different than those specific to the progression of amyloid-related diseases. Oligomers for toxicity assays are usually prepared under extreme conditions that are not physiological or amyloidogenic. The stability of such small oligomers is difficult to assay under cell culture conditions. Toxicity studies typically do not differentiate between the types of oligomers present.27,32,34,35 Characterization of the oligomers varies widely and often involves low-resolution and/or unreliable methods.39 As a result, it is not clear which species are actually present in the different studies. Where they have been characterized, oligomer toxicity appears to depend on size and structure.33,36,37 The thermodynamic and kinetic properties of different oligomeric species will dictate their stability and physiological relevance. Therefore, an understanding of these properties is vital.
The toxic oligomer hypothesis does not account for the relationship between the toxic oligomer and amyloid; the proteins in amyloid diseases all form amyloid in vivo. Moreover, single amino acid mutations that increase rate of disease progression can also increase the rate of amyloid formation in vitro.10,40,41. Under the toxic oligomer hypothesis, toxic oligomer and amyloid fibril formation is a coincidence that spans many diseases.
The ubiquitous presence of amyloid in amyloid-related diseases is often rationalized by invoking a protective role for amyloid fibril formation as a sink for the toxic oligomers.14,42 However, no cellular machinery for producing amyloid from misfolded aggregates has been identified. Indeed, cellular action is not required for amyloid formation, as all amyloid-related disease precursors readily form amyloid in vitro. Nevertheless the conditions that are required to form amyloid in vitro are usually not at all physiological. In particular, rapid agitation in the presence of air-water interfaces is usually required in vitro suggesting that strong perturbation may be necessary for similar aggregation rates to occur in vivo.
In both hypotheses small aggregates play important but different roles. In the amyloid cascade hypothesis, the small aggregates are an intermediate state between the functional form and amyloid;43–49 above a critical size they seed fibril formation.50–52 Thus, oligomers that can seed amyloid formation are at the heart of the autocatalytic cycle. In the toxic oligomer hypothesis the pathology is more direct. The aggregates could trigger the unfolded protein response,53 increase cell membrane permeability,34,35,37,54,55 interfere with long-term potentiation,31,32 or otherwise produce cytotoxicity.56
Distinguishing the type and role of oligomers is therefore important for understanding amyloid-related disease mechanisms. Toxic oligomers and the critical nucleus for amyloidosis have different free-energy landscape requirements. The free energy of the critical nucleus is at a maximum, whereas toxicity would require accumulation of appreciable populations — implying a free energy minimum. Thus, the relationship between these species can be defined in terms of their relative positions on the aggregation free energy landscape.
Multiple techniques have observed sigmoidal kinetics for amyloid assembly. There is a lag phase, during which no amyloid aggregates are detected. A growth phase follows, in which proteins rapidly convert into amyloid with a fast increase in aggregate size and β-sheet rich structure. The lag phase can be shortened or removed by the addition of preformed fibril seeds. Kinetic results are extremely sensitive to the details of sample handling. Pre-existing seeds,52 surfaces,57–59 air-water interfaces,60,61 and agitation62,63 can all strongly perturb the kinetics. These results suggest that amyloidogenesis is kinetically controlled.
Several methods have been commonly used to characterize amyloid intermediates. Static and dynamic light scattering (DLS) provide size distributions,46,51,64,65 but size and morphological heterogeneity prevent resolution of individual species.66 Photo-induced cross-linking followed by SDS-PAGE has been used to study the size distribution of low–molecular-weight Amyloid β peptide (Aβ) oligomers but is limited to differentiating small species. Cross-linking can skew the overall size distribution to smaller aggregate number.45,64 Atomic force microscopy (AFM) during amyloidogenic incubation shows the presence of different-sized globular particles,33,67–74 worm-like beaded protofibrils,72,75 and rare annular structures.76
Structural and spectroscopic methods are often used in parallel to correlate aggregation and conformational states. Increased β-sheet structure was detected by Raman spectroscopy for α-synuclein amyloid formation in tandem with AFM imaging of the aggregate assembly.47 Fourier transform infrared spectroscopy was combined with AFM and electron microscopy to study human prion peptide PrP82-146 aggregation under different conditions.49 Circular dichroism, intrinsic fluorescence,77 and thioflavin T (ThT) luminescence66 can also monitor structural changes. Intermediates may also be detected by oligomer-specific antibodies.78
Proposed mechanisms of amyloidogenesis vary greatly in spite of common kinetic features. A nucleation-dependent polymerization model for prion protein (PrP) and Aβ was proposed by a one-dimensional analogy to protein crystallization. The critical nucleus forms from and elongates by association of monomers with a specific structure.50 Off-pathway species have also been added.79 Acid-induced Aβ assembly was modeled by micelle-facilitated formation of nuclei. Only the moments of the fibril size distribution were compared with DLS data.51,80 In all cases, no direct evidence for intermediates was offered and only the accumulation of amyloid was modeled.
A nucleated conformational conversion (NCC) model was proposed for Sup35. This model was based on the detection of an oligomeric lag phase intermediate that mediated nucleation and elongation. Monomers first associate into a fluid micelle-like oligomer, which then rearranges to form an energetically unfavorable amyloidogenic nucleus. The nucleus grows by inducing conformational rearrangement in the oligomers.52 A Lumry-Eyring step has been added to the nucleated polymerization model to account for pre-equilibrated monomer unfolding and increase fitting function flexibility. Again, averaged quantities were treated.81 Phosphoglyceratekinase assembly kinetics has been modeled by Smoluchowski coagulation theory. Critical oligomers form by collision of smaller intermediates. Filaments grow linearly by the fusion of critical oligomers.46
Some studies find that amyloid assembly deviates from the nucleation-dependent mechanism. Transthyretin aggregation followed nucleation-independent downhill polymerization that was insensitive to seeding.65 The ThT assay for amyloid may have registered a false positive as no fibrils were observed.
Understanding the molecular amyloid assembly mechanism is critical for developing a rational strategy to prevent the aggregation cascade events. A comprehensive molecular model of amyloidogenesis will have many features that are missing from current models. A molecular mechanism of amyloidogenesis must define the reactivity and roles of the oligomeric intermediates in order to evaluate their contribution in disease-progress hypotheses. This level of detail requires measuring both the conformational changes and the distribution of aggregate sizes through the aggregation processes. Intermediate species must be explicitly measured and included. The aggregates before and after nucleation should be distinguished. Linkage must be established between aggregation events and conformational changes. For example, if a hydrophobic core is present the point at which it is disrupted in favor of an aggregated form should be identified. Different types of aggregation events and conformational changes should have different barriers. The critical nucleus must be identified for nucleated processes. The mechanism should allow prediction of sequence and condition determinants of amyloid formation propensity. Representation of the amyloidogenic aggregation mechanism by a free energy landscape allows a unified and intuitive presentation of these ideas.
The present study treats the bovine milk lipocalin β-lactoglobulin A (β-LGA). Extensive studies of the stability, folding, and aggregation of β-LGA have been driven by basic science and the dairy and food processing industries.82 Its biological role, beyond providing a source of protein in milk, is unknown. It may enhance solubility of fat and fat-soluble nutrients through binding to the calyx.83,84 Hydrophobic and amphiphilic fluorophores bound to the β-LGA calyx and other hydrophobic sites can be distinguished using fluorescence lifetime measurements.66,85,86 β-LGA forms amyloid under various conditions. 66,73,87–90
To follow the assembly of β-LGA into amyloid, we used time-resolved fluorescence of 1-anilino-8-naphthalene sulfonate (ANS) and ThT to monitor the conformational changes and used DLS and AFM to monitor the degree of aggregation.66 Several ANS binding locations and β-LGA calyx were modified and disrupted during amyloid assembly.66 A three-stage qualitative mechanism was proposed for β-LGA amyloidogenesis with two different classes of oligomer preceding amyloid protofibril formation. During the early lag phase, denatured monomers associated to form loosely bounded oligomers, AggA, in which the hydrophobic calyx was partially disrupted. During the late lag phase, AggA converted to a globular intermediate, AggB, in which the hydrophobic calyx was completely disrupted. Conversion of AggB to amyloid gave rise to abundant protofibrils in the growth phase. ANS and ThT luminescence for monomer, AggA, AggB and amyloid showed distinct lifetime distribution patterns.66 The present study develops a quantitative kinetic model of the amyloidogenic aggregation of β-LGA by combining AFM oligomer size distributions with ANS, ThT and DLS measurements66. The kinetic model is based on oligomeric intermediates that were directly observed. An amyloidogenic aggregation free energy surface is constructed from the details of the kinetic model.
Results
Aggregate morphology shows two growth pathways
On each of the 32 days of incubation, we imaged samples deposited on aminopropyltetratheoxysilane (APTES)-modified mica using tapping mode AFM. The images showed five phases of aggregate growth.
Early lag phase (Days 0 to 9)
Incubation days 0 through 9 showed amorphous protein layer, with no sign of stable well-defined particles in the AFM images. However, DLS measurements showed a dramatic decrease in monomer population and an accumulation of dimers and tetramers during this period (Fig. 1).66 Accompanying this increase in particle size, time-resolved fluorescence lifetime analysis of intercalated ANS showed a change in accessibility to the calyx site, indicative of a conformation change. Moreover, the change persisted upon dilution to native conditions.66 The AFM images suggest that surface dissociation into the amorphous protein layer prevented detection of the early lag phase oligomers. Thus the early lag phase oligomers are lower in free energy than the folded-state monomers and higher in free energy than surface-dissociated monomers. We designate this class of oligomers as AggA and the period, from days 0 to 9, during which they accumulated as the early lag phase.
Figure 1.

The evolution of the correlation decay time distribution monitored by continuous DLS during first 4.7 days of incubation. We related the particle decay time to spherical hydrodynamic radius using the Stokes-Einstein relation. The characteristic density of the partially unfolded monomer determined from assignment of a urea titration DLS experiment at 5 M was used to scale the oligomer sizes. The brown, green, and blue lines correspond to the correlation decay times of globular monomer, dimer and tetramer, respectively. The correlation decay time distributions were renormalized to the maximum intensity at each incubation time point. The peak shifted from monomer at the beginning of incubation, to dimer by day 2 and tetramer by day 4. Based on this data, a sequential assembly pathway, monomer→dimer→tetramer, (A1 → A2 → A4) is proposed for AggA aggregation.
Late lag phase (Days 10 to 21)
After day 10, individual globular particles of different sizes were imaged by AFM as in Fig. 2a, indicating the formation of oligomers that were stable with respect to dissociation on the APTES surface. The AFM image coverage by resolvable particles varied and was typically about 5%, providing a good balance between particle differentiation and statistics. From day 10 to 21, most particles imaged by AFM were globular, with heights between ~1 nm and ~2 nm above the amorphous protein layer, which was also observed in the early lag phase (Fig. 2a,b). According to our derived relationship between height and number of monomers in globular particles (Fig. 3), this range of heights corresponds to globular oligomers containing 4 to 8 monomers, with the majority species being tetrameric, as shown in Fig. 2a,e and Fig. 2b, f. Particles with heights between ~2 nm and ~4 nm were observed less often. This range of heights corresponds to globular oligomers with up to 16 monomers.
Figure 2.

Particles were imaged with AFM from late lag phase through late growth phase. The left panels are typical AFM images taken during (a) late lag phase (day 11), (b) transition to growth phase (day 15), (c) early growth phase (day 23), and (d) late growth phase (day 31). Particles were identified, measured and assembled into the two-dimensional histograms of the observed height and length that appear on the right (e–h). The population distribution was normalized by most populated species on that day. (e) Day 11: 533 particles from five 2×2 μm images. Small globular particles dominated. (f) Day 15: 2471 particles from ten 2×2 μm images. Larger globular particles appeared. (g) Day 23: 801 particles from two 5×5 μm images. Short protofibrils appeared. (h) Day 31: 1179 globular particles and 291 short protofibrils from four 5×5 μm images. Many protofibrils appeared. The circled number on the right of two-dimensional histogram are the estimated number of monomers in globular particles of corresponding height, referring to Fig. 3. The growth phase showed two growth trends (arrows in (g,f)): globular assembly and fibrillar elongation. The small particles with height around 1 nm were more reliably resolved in the lag phase 2×2 μm images than in the growth phase 5×5 μm images. As a result, the population of such particles is underestimated in the region indicated by the blue circles in (g) and (h).
Figure 3.

Observed height, real length (2×rg) profile of globular β-LGA aggregates on surface measured by AFM. Globular particles of a given size will be observed with same height in different images but with different lengths because of varying tip sizes. After removing the tip effect using Eq. 10, with different tip radii for each image, globular particles from 50 images taken through the incubation gave a unified observed height, real length profile. An empirical relationship between Hg and rg was derived according to this profile. With known height and radius, the volume of globular particles were calculated with Eq. 12. The circled numbers indicate number of monomers in globular particles with corresponding observed height, calculated based on particle volume and density on the surface.
The wing that appears in the DLS correlation decay time distribution during this period is consistent with growth of particle to sizes between 8 and 40 monomers (Fig. 4). This size increase coincided with loss of the structured calyx site as detected by ANS fluorescence,66 suggesting a structural rearrangement of the monomers within the oligomer. This set of observations led us to designate this larger and structurally distinct class of oligomers as AggB. The formation and growth of AggB preceding the conversion to amyloid protofibrils defines the late lag phase, i.e., days 10 to 21. Short fibrillar species could occasionally be detected (Fig. 2b), foretelling the beginning of the growth phase.
Figure 4.
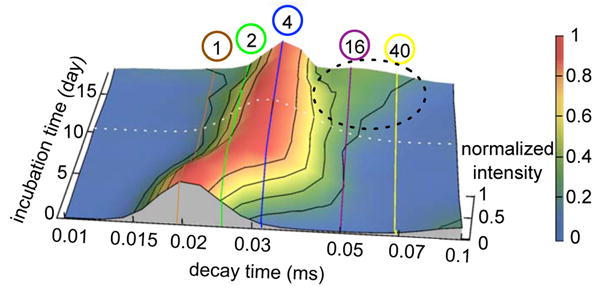
The evolution of the correlation decay time distribution monitored by continuous DLS during the first 18 days of incubation. The brown, green, blue, purple and yellow lines correspond to the correlation decay times of globular monomer, dimer, tetramer, hexadecamer, and 40-mer, respectively. The intensity was normalized by maximum intensity of each incubation time point. The tetramer remained the dominant peak from days 4 to 18. After day 10, a wing appeared to longer decay times indicating aggregate growth up to approximately 40-mers. Because spherical particles contribute to homodyne-detected DLS in proportion to the square of their volumes, the relative population of aggregates contained in this wing was even smaller than their small amplitude with respect to the tetramer peak might suggest. The appearance of this wing coincided with AFM detection of globular particles on the surface. These observations put together suggest that growth of a conformationally distinct species, AggB, defines the late lag phase.
Early growth phase (Days 22 to 28)
By day 22, it became common to observe short rod-like fibrillar structures of different lengths, coexisting with globular particles (Fig. 2c). Most fibrillar particles were approximately 3 to 5 nm thick. We assigned this thinnest class of rod-like fibrillar particles as protofibrils. Protofibrils present at this stage gave a specific ThT lifetime distribution that was different from mature fibrils.66 Thicker fibrillar species did appear at this stage but were very rare. Protofibril population increased rapidly for the 9 days following day 22, consistent with designating this stage of assembly as the early growth phase.
Overall, the size of globular AggB increased during this phase. The low resolution of 5 μm images used for analysis in this stage hindered the precise determination of population for smallest (~1 nm) species. However, there was a clear increase in population of particles ~2 nm to ~4.5 nm high, corresponding to species ranging from octamer (B8) to 24-mer (B24). A small population of particles larger than 4.5 nm, which were absent in the lag phase, were detected during the early growth phase.
Two trends of self-assembly emerged in the height-length two-dimensional histograms (Fig. 2g). One trend continued to follow the globular growth pattern from the late lag phase, resulting in a relatively small population of round particles with heights ranging from ~4 nm to ~8 nm. The second trend led to rod-like protofibrils.
Late growth phase (Days 29+)
Late growth phase AFM images (Fig. 2d) showed globular particles as well as a dramatic increase in protofibril number and length. Analysis of more than 200 of these protofibrils gave an average height of ~3.8 nm and width of ~11 nm. The protofibrils were straight, unbranched and usually had a small variation in height along their length. Some longer protofibrils showed periodic variation in height. The longest protofibrils we detected were ~150 nm. Assuming that the protofibrils on surface have the same density as fully folded monomer, we estimated about 250 monomers for the longest protofibrils. The protofibril length distribution showed contributions across all lengths from 20 to 150 nm, suggesting a relatively small growth unit. However, a modest dip in population from 40 to 60 nm was also observed.
The bifurcation of the two aggregation trends became quite clear during this stage (Fig. 2h). The juncture at which globular particles appear to choose between the two modes of assembly occurs at 3.8 nm, roughly corresponding to B16. Along the globular growth pathway, after the bifurcation point, further growth of AggB resulted in a small population of AggB larger than hexadecamers. The population of globular particles between ~3 nm and ~4 nm, corresponding to B12 and B16, increased and became comparable to that of B8. The population of AggB larger than the bifurcation point was clearly lower than that of smaller AggB (Fig. 2h).
AFM images after more than 60 days of incubation dominated by mature fibrils, indicating that much of the protein had been incorporated into mature fibrils as shown in Fig. 5. The fibril profiles showed different heights and height periodicities along them. The mature fibrils could be several μm long. Our ThT luminescence measurements showed a noticeably different lifetime distribution pattern than that observed during the growth phase which was dominated by protofibrils.66 Globular particles and short protofibrils were also observed to coexist with mature fibrils. Some very thick amorphous particles were observed but were absent from early stages.
Figure 5.
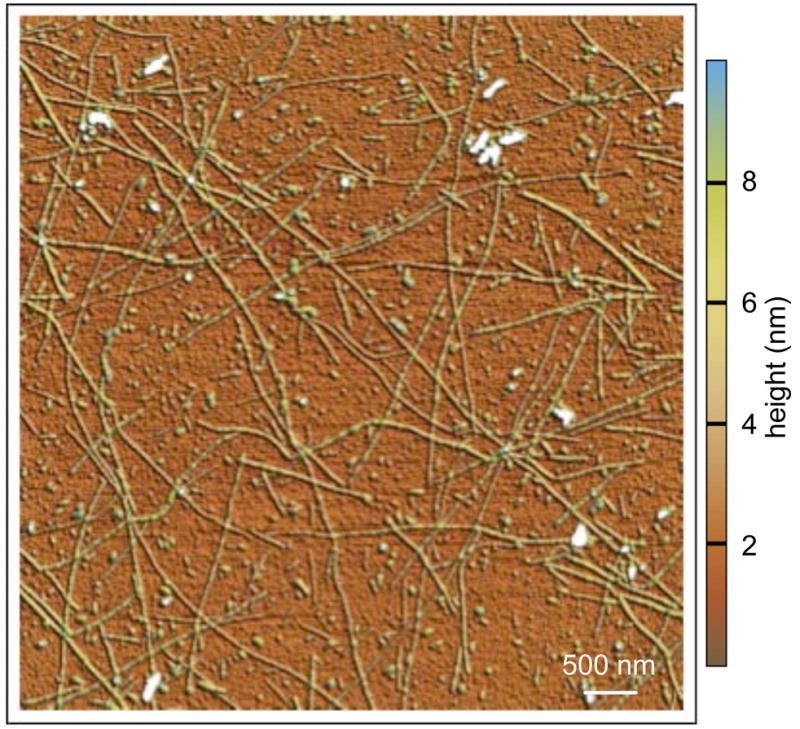
Mature amyloid fibrils detected by AFM after 65 days of incubation. During late stage incubation, mature fibrils of different heights were observed in large numbers. They coexisted with small globular particles and large amorphous particles on the surface. These fibrils were unbranched, curved and could be several μm long.
Mechanisms from kinetic data
Approach to simulating kinetics
We include all classes of species as defined by analysis of AFM, DLS and luminescence lifetime distribution.66 We calculate the evolution of the concentration of all kinetically active species without first simplifying to moment analysis or other averaged quantities. To simplify the optimization of the individual kinetic rate constants, we treat bimolecular reactions with activated collision theory assigning similar barriers to similar reactions. This allows us to define the rate coefficients in terms of energetics. We included only the minimum number of intermediate species and reaction steps necessary to reconstruct the major features of the observed data. In general, an infinite number of more complicated mechanisms could also fit the data. We parsimoniously reject such mechanisms. By including both forward and reverse rates in our analysis we are able to estimate free energy changes at each step of the aggregation.
Early lag phase reactions
The main feature of experimental DLS data for early lag phase was a shift from the monomer peak at time 0 to dimer by day 2 and tetramer by day 4 (Fig. 1). After day 4, the distribution pattern did not change until the start of late lag phase. This evidence shows that species presented during this early lag phase (AggA) is composed of monomeric (M), dimeric and tetrameric (A4) forms. Moreover, monomers aggregated into tetramers through dimers and resulted in an accumulation of dimers and tetramers.
Non-reducing SDS-PAGE showed oxidative aggregation essentially halted at the dimer stage with substantial reduced monomer still present (data not shown). This result suggested that tetramers form from oxidative dimers, , and non-oxidative dimers (A2) or monomers (2 M).
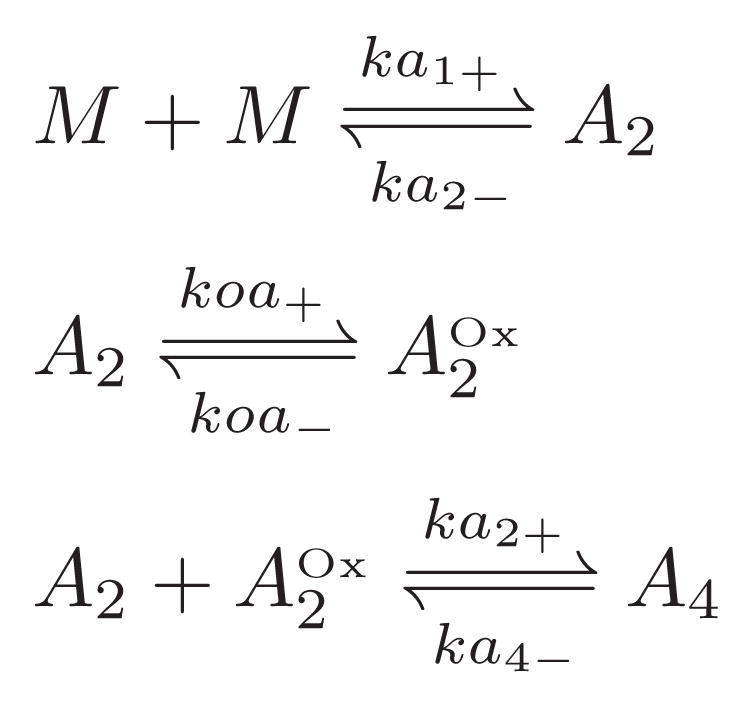
To account for our observations and fit the DLS data, we propose a three-step mechanism to create A4 as shown in Scheme 1. Initially, weakly associated dimers, A2, formed from monomers. formed by structural reorganization and oxidation of A2. By day 4, both types of dimers had aggregated to form A4.
Scheme 1.
The simulation result for the proposed scheme was presented in Fig. 6, with rate coefficients in Table 1. The rate coefficients were optimized by minimizing the Kullback-Leibler distance as in Eq. 18. This simulation successfully caught the sequential shift of intensity peak in DLS from monomer to dimer to tetramer. A close comparison of the simulation to experimental data reveals a difference mainly in the width of distribution at each time point. However, without an adequate noise model for the DLS simulation a strict comparison between simulation and experimental DLS was inappropriate (ill-formed noise was addressed in the simulation and we do not know how particles of different sizes actually contribute to dispersed decay time distribution in our DLS measurement).
Figure 6.

The evolution of the DLS correlation decay time distribution was constructed from a kinetic simulation of the first 4.7 days of aggregation according to Scheme 1. Species population aj was converted to DLS decay time distribution (Is(τ, t)) using Eq. 15. The correlation-time distributions were renormalized to the maximum intensity at each incubation time point to facilitate comparison to the experimental data. Rate coefficients in Scheme 1 were optimized to match the constructed distribution to experimental data in Fig. 1. The brown, green and blue lines correspond to the correlation decay times of globular monomer, dimer and tetramer, respectively. Simulation based on Scheme 1 captured the earliest aggregation events: The DLS decay time distribution shifted from monomer to dimer, then to tetramer by day 4.
Table 1.
Optimized rate coefficients for early lag phase simulation.
| ka1+ (μM day)−1 | ka2− day−1 | koa+ day−1 | koa− day−1 | ka2+ (μM day)−1 | ka4− day−1 |
|---|---|---|---|---|---|
| 0.011 | 0.05* | 0.28 | 0.05* | 0.066 | 0.005* |
| ΔG° ≤ −2.0 kJ/mol | ΔG° ≤ − 4.4 kJ/mol | ΔG° ≤ − 6.7 kJ/mol | |||
The three reverse rate coefficients are upper limits; whereas fit gives results effectively 0, simulations were insensitive to rates below these values. The free energy change, ΔG°, is calculated based on forward and reverse rate coefficients of each step, using Eq. 24.
The broadening to longer decay times might be caused by a small amount of AggA larger than A4 or be due to the limits of the Gaussian model we used for the dispersion of the DLS distribution. We found that inclusion of AggA species larger than tetramers did not significantly improve the simulation of the data set. To be thorough, we also included possible pathways, 2(A2) to A4, and to A4 along with formation of heterotetramers. We found that the main features of the data were reproduced with or without the added complexity. Thus, these minor pathways were excluded from the final mechanism lex parsimoniae.
All the reactions in this stage were determined to be energetically favorable. Monomers converted readily to more stable oligomers —A2, and A4— under the experimental condition during the early lag phase.
Transition to growth phase
After day 10, a new class of globular aggregates, AggB, began to appear and grow in size along a globular growth pathway throughout the incubation as detected with AFM and DLS. We propose that A4, formed in the early lag phase, converted to B4 through a conformational change that eliminated the calyx binding site for ANS. This change in structural state was detected in our ANS and ThT measurement as a change in the lifetime distribution pattern.66 It also enabled AggB to be stably absorbed to modified mica surface and detected with AFM.
We simulated the AggB aggregation along this globular growth pathway by appending Scheme 2 to Scheme 1, extending the aggregation mechanism through the late lag phase before protofibril formation. Converting the AFM height–length two-dimensional histogram (Fig. 2e–h) to oligomer size indicates that AggB sizes ranged from about tetramer (B4) to 80-mer (B80) during the 31 days of incubation. The globular particle aggregation number histogram on day 31 appeared to be multimodal with peaks separated by 4 monomer units. Moreover, an analysis of the effect of the size and type of species responsible for increasing AggB size found that a tetrameric unit of assembly, A4, best fit the data.
Scheme 2.
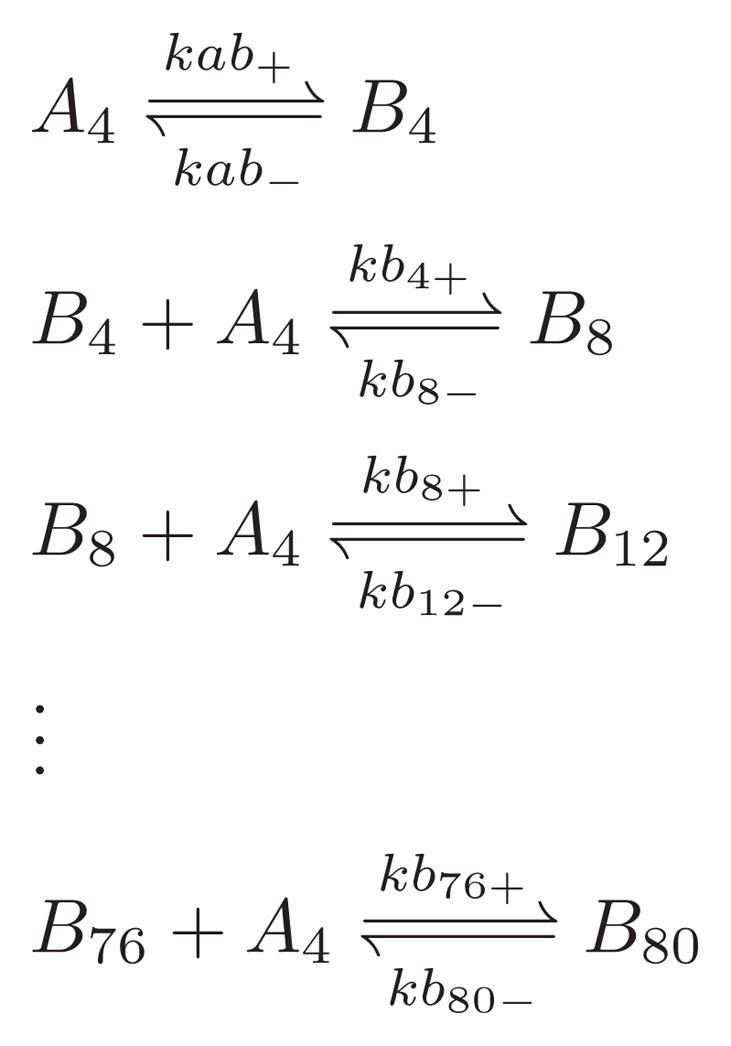
Fig. 4 shows the evolution of the DLS correlation decay time distribution during incubation for the first 18 days from DLS measurement. We estimated our rate coefficents in Scheme 2 by matching the simulated decay time distribution with this data. We scaled the forward rate coefficients for the association steps, kb+s, with Eq. 19, assuming the same energy barrier ΔG‡ for all these steps. This assumption implies that the interaction between all AggB and A4 are the same, reducing the number of kb+ from 19 to 1. The same reverse rate coefficient was used for all the disassociation reactions here.
In the experimental data, a wing apart from the predominant tetrameric peak appeared around day 10 (Fig. 4). This wing corresponded to AggB sized between tetramers and 40-mers. The small intensity of this wing indicated that these bigger AggB were relatively small in population compared with the tetrameric form, A4 and B4. The addition of Scheme 2 to the model successfully reproduced the evolution of the DLS wing arising from AggB growth. Moreover, it reproduced the population relationship between AggA and AggB implied by the intensity difference of their contributions to the decay time distribution (Fig. 7). The small discrepancy between the shape of the simulated and experimental DLS decay time distribution is again attributed to the lack of a noise model for DLS. Because of the great heterogenerity of the system at this stage, multiple species contribute to the edge of the AggB wing. This situation prevents a precise determination of the maximum particle size in the experimental data. However, we will show below that these larger (~40-mers) AggB species are beyond the point at which the aggregates convert to protofibrils and have minimal influence on the overall kinetic behavior. Optimized rate coefficients and barrier parameters appear in Table 2. According to these parameters, formation and growth of AggB were energetically unfavorable under incubation conditions.
Figure 7.

DLS correlation decay time evolution constructed based on species population from kinetic simulations for the first 18 days of incubation. We included AggB aggregation before protofibril formation as in Scheme 2. aj was converted to DLS decay time distribution (Is(τ, t)) using Eq. 15. The correlation-time distributions were normalized to the maximum intensity at each incubation time point. The brown, green, blue, purple and yellow lines correspond to the correlation decay times of globular monomer, dimer, tetramer, hexadecamer and 40-mer, respectively. This simulation including AggB aggregation with successfully captured the assembly event occured during late lag phase, as shown by the wing that appeared around day 10.
Table 2.
Optimized rate coefficients for late lag phase simulation under Scheme 2. The free energy change, ΔG°, is calculated based on forward and reverse rate coefficients of each step, using Eq. 24. ΔG‡ is the energy barrier for AggB growth steps.
| kab+ (day)−1 | kab− day−1 | kb4+ (μM day)− 1 | kb8− day−1 | ΔG‡ kJ/mol |
|---|---|---|---|---|
| 0.024 | 0.28 | 0.023 | 0.067 | 62.1 |
| ΔG° =6.9 kJ/mol | ΔG° =2.7 kJ/mol | |||
We also tested whether B4 can be used as the assembly unit for AggB growth. The amount of AggB in both cases was determined by the formation of B4 from A4. The rate coefficients required to match the experimental data implied that AggB aggregation was energetically favorable. This result precludes a nucleation barrier to protofibril formation from AggB. These observations and the characterization of the formation of amyloid as a nucleated process lead us to discount this mechanism. However, from the experiments we cannot conclusively distinguish between them. In the discussion that follows, our conclusions about the roles of the different classes of oligomers do not change depending on this detail of the mechanism.
Growth phase reactions
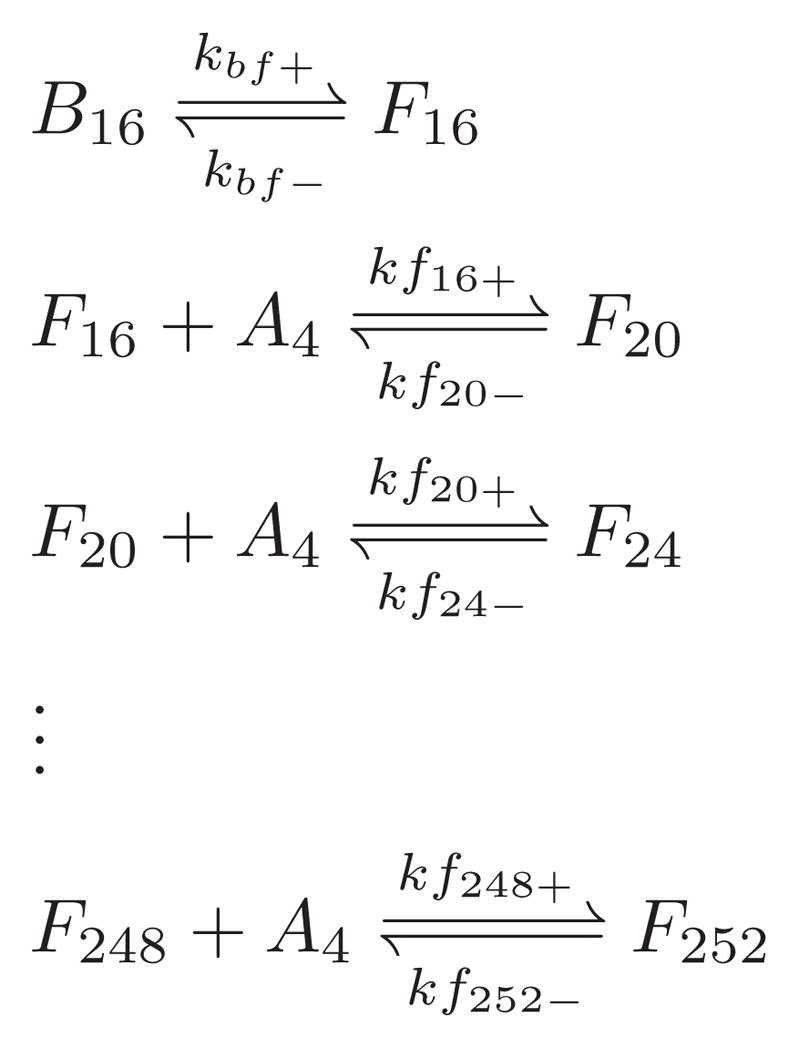
Starting around day 20, a second pathway for aggregation was observed by AFM: protofibril formation and elongation. The second pathway caused a bifurcation in the height-length two-dimensional histogram at around B16 (Fig. 2g,h). We added Scheme 3 to our overall mechanism to accommodate protofibril formation and elongation. We propose that once B16 is formed, it may either continue to grow into B20 or go through a conformational change to form a protofibril nucleus F16. This conversion to protofibril structure was confirmed by ANS and ThT fluorescence lifetime measurements.66 Protofibrils were observed to grow as long as 150 nm (Fig. 2h), corresponding to about a 252-mer. We considered the protofibrils to elongate through association with A4, the most populated species prior to the growth phase.
Scheme 3.
We estimated our rate coefficents in Scheme 3 by matching the simulated height, length two-dimensional histogram with experimental data as in Fig. 2. As in AggB simulation, we used the same energy barrier for all the steps in protofibril elongation and used Eq. 24 to scale the forward rate for elongation kf+s and reduce the number of free parameters. We used the same rate coefficients for all the disassociation reactions and found that the reverse rate was negligible.
The overall simulated height-length 2D histogram from day 11 to day 31 (Fig. 8) was able to reproduce our experimental data. Aggregation proceeded along the two major pathways of assembly. The range of AggB sizes increased with incubation time with the mode of the population also shifting to larger sizes. During the late lag phase, B4 was the dominant AggB size, with a very small number of larger AggB oligomers. During the growth phase, B8, B12 and B16 populations increased dramatically. The appearance time of protofibrils was consistent with the small number and lengths of protofibrils present on day 23 that then became abundant and long by day 31. The maximum length of protofibrils observed during the experiments was reproduced at about 150 nm. The relative population of AggB and protofibrils in the AFM (excluding B4) was reproduced at 0.24. The population of AggB was dramatically lower above the bifurcation point, B16/F16.
Figure 8.

AFM height and length two-dimensional histograms constructed from kinetic simulation of Schemes 1–3. The two-dimensional histogram was constructed using Eq. 16 and the simulated population distribution for (a) day 11, (b) day 15, (c) day 23 and (d) day 31. The population distributions were normalized by the most populated species for that day to facilitate comparison with the experimental data. The circled numbers on the right of two-dimensional histograms give the number of monomers in globular species of corresponding heights, referring to Fig. 3. The red dots at the top of (d) show the number of monomers in protofibrils of corresponding length, calculated with Eq. 14. Both the globular and fibrillar growth patterns observed in the AFM experiments are reproduced by the simulation. This simulation captured the protofibril elongation events during growth phase. Two trends were simulated: globular assembly and fibrillar elongation.
There were also several detailed features that were not captured by our simulation. First, the size evolution of AggB did not match exactly with our data. For example, on day 23, the model over-predicted the B12 population (compare Fig. 2g to Fig. 8c). Our assumption that the energy barrier was the same for all steps in AggB aggregation could be an explanation of this problem. Second, a small number (approximately 3%) of particles higher than 6 nm were observed by AFM but did not appreciably populate in the simulation (Fig. 8g and h). These particles could be experimental artifacts from AggB and short protofibrils sitting on top of each other. Alternatively they could arise from aggregation steps involving the larger AggB aggregates. This class of reaction was not included in our final model. Third, the bundling of several protofibrils to form thicker fibrils was not considered to be important at this stage. Thus, no thicker fibrils were present in the simulation result. Fourth, we did not consider the possibility of AggBs thicker than protofibrils converting to protofibrils as B16 did. The observation of particle between the two aggregation trend lines suggest this possibility, though the small population suggests a minority contribution at best. Fifth, close inspection of the protofibril length distribution in Fig. 2 show that there may be a local minimum of population at ~50 nm, suggesting a local free energy maximum at this protofibril length. We have made no attempt to account for this feature as our focus is on the oligomeric species leading up to protofibrils and not the details of protofibril elongation.
Another possible mechanism was to use B4 as the protofibrilation elongation unit, instead of A4. The simulated fluorescence data from that model did not match our ANS measurement in the sense that the A4 population decreased too slowly during aggregation. Our simulation also showed that monomer addition could not account for protofibril elongation in our case, because not enough monomers were around in the system to interact with the protofibril for elongation at this stage. We did not include protofibril elongation via end-to-end interactions between short protofibrils. Considering the low concentration of protofibril and their slow rate of diffusion in solution compared with A4, the effective rate of such a reaction is likely to be very low. The remainder of the discussion focus on the mechanism with A4 as the elongation unit.
The optimized rate constants appearing in Table 3 predict that there is a free energy decrease for the conversion from B16 to smallest amyloidogenic structure F16. After optimizing the simulation, during sensitivity test we found that as long as kf−s were smaller than 0.3, they had no effect on the simulation results. Thus the kf− values were bracketed between 0 and 0.3. With coefficients in this range, the calculated Gibbs energy change using Eq. 24 was always negative, and thus the protofibril elongation steps were energetically favorable. This result implies that protofibril species can work as template to incorporate assembly units and can be used as seeds to induce fast assembly with enough assembly unit around.
Table 3.
Optimized rate coefficients for late lag phase simulation under Scheme 3.
| kbf+ (day)−1 | kbf− day−1 | kf16+ (μM day)− 1 | kf16− day−1 | ΔG‡ kJ/mol |
|---|---|---|---|---|
| 0.099 | 0.00076 | 0.67 | 0.3* | 52.3 |
| ΔG° = −12.5 kJ/mol | ΔG° = −2.1 kJ/mol | |||
This reverse rate coefficient is the upper limit; simulations were insensitive to rates below these values. The free energy change, ΔG°, is calculated based on forward and reverse rate coefficients of each step, using Eq. 24. ΔG‡ is the energy barrier for protofibril growth steps.
Validation of kinetic model with ANS data
We used qualitative aspects of the ANS data to guide the formulation of the kinetic model. We now use the kinetic simulation that was based on AFM and DLS fits to generate the evolution of the ANS fingerprints that were previously measured.66 Thus, the ANS data provides an independent measure of the evolution of different species in solution against which we may test our overall kinetic model.
We used Eq. 17 with the populations of the different classes of oligomer generated by the kinetic simulations to simulate the different fluorescence contributions we previously reported.66 The evolution of the ANS lifetime distribution fingerprints are shown in Fig. 9 top. By comparison the simulated contribution to the fluorescence is shown in the bottom panel. The kinetic simulation was not adjusted to match the ANS data, nor were the relative amplitudes of the different contributions adjusted. The bottom panel may also be interpreted as the amount of monomer accumulated into each species.
Figure 9.

ANS fingerprint contribution was calculated as an independent validation of the kinetic model. Upper panel: experimental ANS fingerprint contribution evolution of different classes of species for 28 days of incubation. Lower panel: simulated ANS fingerprint contribution evolution based on species population from kinetic simulation, using Eq. 17. Three stages of growth featured by AggA, AggB and protofibril formation were captured.
As in the experimental data, three stages of aggregation appeared in our simulated fingerprint evolution with the same time span. From day 0 to day 10, the dominant process was conversion of monomers to tetramers via dimers. Here we reassign the monomer fingerprint in our last paper to monomer plus both non-oxidative and oxidative dimer.
The contribution from monomer and dimers dropped dramatically as the tetramer reached its maximum population around day 10. During this stage, a reservoir of protein made up of energetically favorable, A2, and A4 accumulated before appearance of any amyloidogenic species. From day 11 to day 21, A4 converted to AggB as shown by the anti-correlation of the two populations. Energetically unfavorable AggB accumulated in relatively smaller population than AggA before nucleation of protofibrils. After day 22, the A4 contribution decreased while the protofibril fingerprint intensity increased accordingly and the contribution from AggB plateaued. Protein was incorporated to protofibrils via A4.
One difference between the simulation and experiment fingerprint evolution was the contribution from protofibrils. The ANS lifetime measurement showed the protofibril contribution was flat before day 20, and increased abruptly after day 21. In the simulation, this contribution was flat before day 10 and increased gradually afterwards. One possible source of this discrepancy is our omission of conversion of protofibrils to fibrils from the mechanism. Larger fibrils appear to bind ANS and ThT differently than do protofibrils. Another possibility is that the fingerprint for protofibrils should more closely resemble that of AggB. The protofibril fingerprint was generated by removing as much AggB fingerprint from the late-stage distributions as possible while maintaining non-negativity. In this case, the fingerprint for AggB would include contributions that should be attributed to protofibrils, which may account for the bi-phasic appearance of the experimental AggB fingerprint evolution.
ANS fingerprints do not give concentrations of individual species. The fingerprint is an average of the different contributions to the ANS lifetime distribution averaged over all the species included in the class of oligomer. Because the relative contribution of each size in a given oligomer class changes during incubation, the connection between a fingerprint and the overall population may not be fixed. ANS partitions amongst all its available binding sites according to their populating and binding affinities, preventing an absolute concentration of a species from being determined. Note that in spite of all these caveats, the simulated fingerprint evolution was obtained using the same proportionality constant for all species. Fig. 9 shows that for three of the fingerprints the evolution simulated from AFM and DLS data, the experimental ANS signals match quite well. This suggests that the different classes of aggregate have similar binding properties to the surface in the AFM experiments and to ANS in the fluorescence experiments.
Discussion
Aggregation Free Energy Landscape
The detailed kinetic mechanism allows us to generate an aggregation free energy landscape under the amyloidogenic conditions of our experiments. The free energy change of each reaction, ΔG°, was calculated from Eq. 24 using optimized forward and reverse rate coefficients. We included the four reactions where the simulation produced only an upper limit for of the reverse rate constants (ka2−, koa−, ka4− and kf−) by considering the least negative ΔG° for the aggregation step in question that was supported by the data. For each of these steps the free energy landscape could be steeper than shown in Fig. 10. Free energy barriers, ΔG‡, were determined as a fit parameter in Eq. 19, which is not applicable for unimolecular reactions. For visualization purposes, barriers for and A4 → B4 are shown in Fig. 10 with the ΔG‡ for the growth reaction of the respective product species, since they should involve similar conformational changes. Similarly, we show the energy barrier for B16 → F16 as 1.5 times that of protofibril elongation. Based on simulation, the population of B16 was always in excess of F16 (> 20 times), indicating that this step is rate-limiting compared to protofibril elongation.
Figure 10.

Free energy landscape for β-LGA amyloid assembly. Assigning the origin of the free energy to be the partially unfolded monomer, the apparent free energy for AggA, AggB, and Protofibrils is plotted based on the free energy change of each reaction. The gray arrows show the path of increasing aggregation number for each class of aggregate, while the red arrows show the conformational conversions (A2 to , A4 to B4, and B16 to F16). Four types of oligomers are identified by their location on the energy landscape and role during amyloidogenesis. Reservoir Oligomers sit at a free energy valley. The Nucleating Oligomers are the species with highest free energy along the amyloid formation pathway. Sequential assembly after nucleation of Seeding Oligomers follows a downhill trend on the energy landscape, which is the driving force for fast amyloid Protofibril elongation in the growth phase. Formation of Dead-end Oligomers has a much smaller driving force than Protofibril elongation and is off the amyloidogenic pathway.
Formation of AggA oligomers is energetically favorable for all steps as shown in Fig. 10. The accumulation of AggA in this local free energy basin at A4 is the main characteristic of the early lag phase. Reactions in the late lag phase that form and grow AggB are uphill. Filling of the shallow free energy basin by populating AggB is the main feature of the late lag phase. There is a bifurcation in the energy landscape at B16. Growth of AggB remains unfavorable above B16. However, at this point formation of protofibrils becomes favorable, signaling the start of the growth phase. The lag time for β-LGA fibrillization kinetics is caused by the accumulation of AggA, the energetically unfavorable formation of B16 species. The net free energy increase of 15 kJ/mol for A4 → B16 does not involve any bracketed rates. The sequential downhill elongation of protofibrils is the main driving force for β-LGA amyloid assembly leading to formation of mature fibrils. This aggregation free energy landscape leads to four different behaviors for oligomers based on their kinetic relationships.
Species involved in Amyloidogenesis
Reservoir Oligomers are located in a stable valley in the free energy landscape. The dominant Reservoir Oligomer is A4. However, other AggA species and AggB smaller than B16 also contribute to the pool of aggregated misfolded protein. These small oligomers accumulate at relatively larger populations during the lag phase. The pool of stable Reservoir Oligomers mediates later aggregation events. Under the amyloidogenic conditions of our experiments, Reservoir Oligomers dominate the lag phase and early growth phase. Reservoir Oligomers eventually attain a size large enough to undergo the critical conformational change to the cross-β structure of amyloid.
Nucleating Oligomers, B16 → F16, exist at the maximum free energy of intermediates along the amyloid aggregation pathway. Nucleating Oligomers do not have the stable structure of amyloid and may not have a conformational relationship to the monomer or to other oligomers. As the species with maximum energy along amyloid formation pathway, Nucleating Oligomers are metastable and present in relatively small populations.
Oligomers that have crossed over the barrier to the cross-β structure are Seeding Oligomers that mark the beginning of the amyloid fibril cascade. Protofibrils bigger than F16 belong to this class. Seeding oligomers can act as templates for the conformation conversion of units added to them, and thus further assembly of them is energetically favored. Addition of these Seeding Oligomers to samples under amyloidogenic conditions will reduce the length of the lag phase by incorporating Reservoir Oligomers without the need to wait for Nucleating Oligomers. Seeding Oligomers accumulate before the formation of mature fibrils and dominate the growth phase. Isolating small Seeding Oligomers would require manipulating experimental conditions to alter the free energy landscape so as to limit the elongation of protofibrils or to induce fragmention of larger protofibrils.
We designate AggB oligomers larger than B16 as Dead-End Oligomers. They are formed by continued growth of Reservoir Oligomers without converting to amyloid structure. Dead-End Oligomers are uphill and off-pathway from amyloid; under the amyloidogenic conditions they remained in small populations. Isolating Dead-End Oligomers would require manipulating experimental conditions to prevent the nucleation step (B16 → F16) from occurring.
Relationship to Other Kinetic Models
The free energy landscape provides insight and a common framework for discussion and comparison of the present model to other common models of amyloidogenesis. The chief feature of a nucleated polymerization model is sequential energetically unfavorable aggregation to form a nucleus of critical size.50 Polymerization is favorable above this critical size. This model precludes the accumulation of a pool of oligomers in a local free energy minimum.
The Lumry-Eyring nucleated polymerization (LENP) model is a generalization of many simpler nucleation-growth models.81 LENP includes five stages of growth and has some superficial similarities to our model. However, there are several important differences. Our study focused on the phase after conformational changes of unaggregated protein and before the condensation of higher-order assembly. In LENP this stage is modeled as pre-nucleation, nucleation and growth of soluble aggregates via polymerization. The LENP pre-nucleation steps are comparable with our AggB formation. However, the Reservoir Oligomer is missing in the LENP model. The nucleation step in LENP is the irreversible rearrangement of an oligomer to amyloidogenic form, implying a large decrease in free energy. Our model showed only modest free energy changes for the conformational conversion steps and the formation of smallest amyloid species, F16. In LENP amyloid growth is by monomer addition; in our model they elongate by incorporating Reservoir Oligomers. Finally, we explicitly compare the populations of the different species present in our model to experimental data rather than calculating averaged relaxation behavior.
The micelle nucleation model assumes an all-or-nothing aggregation to form micelles.51,80 Though, micelle formation may not be as sharp in proteins as in traditional surfactants. We did not observe the cooperativity required for this model. However, there are some important similarities between our model and that of Lomakin et al. The micelle acts as a Reservoir Oligomer above the critical micelle concentration (CMC). The amphiphilic nature of proteins makes the formation of micelle-like structures a reasonable model. A CMC also suggests a limit to the size of a colloidal protein aggregate. The micelle nucleation requires that the Reservoir and Nucleating Oligomers be the same. Amyloid growth is only by monomer addition.
The nucleated conformational conversion model (NCC) for Sup35 amyloid assembly can fit into our picture in some aspects.52,91 Lag phase oligomers of Sup35 formed a reservoir and mediated fibril elongation, similar to AggA. The Sup35 experiments did not identify any other intermediates. In NCC the Reservoir and Nucleating Oligomers are the same size. In our model, nucleation occurs through a larger and rarer intermediate.
We considered the possibility of AggB aggregation through addition of B4 instead of A4. Because A4 and B4 were in equilibrium with each other, the simulation results were indistinguishable from these two mechanisms. The parameters for growth by B4 addition gave downhill aggregation implying no limit to AggB sizes. The globular aggregate height was limited to ~9 nm implying uphill aggregation by A4. However, AggB size may be kinetically controlled by fibril formation.
Roles of Oligomers in Amyloid Hypotheses
The presence of amyloid aggregates defines the entire class of amyloid-related diseases. Because production of amyloid is so often observed during disease progression, any suspected toxic species should be present under the physiological conditions that produce amyloid. To play a role in the disease, aggregates must be cytotoxic and stable enough to accumulate under the disease-relevant amyloidogenic conditions. Experimental tests of the amyloid cascade and toxic oligomer hypothesis mainly evaluate the first requirement of toxicity. The two hypotheses have differing free energy landscape requirements.
The amyloid cascade hypothesis states that accumulation of autocatalytic amyloid fibrils and plaques cause the defects in amyloid-related disease.15 The free energy landscape picture provides restrictions on this hypothesis. First, the reservoir must fill to the point that Nucleating Oligomers are formed to allow creation of Seeding Oligomers. Second, Reservoir Oligomers must accumulate in sufficient numbers to support elongation of protofibrils. Thus, two classes of oligomers are relevant to disease progression under the amyloid cascade hypothesis: Seeding Oligomers and Reservoir Oligomers. Single amino acid mutations that increase the rate of amyloid formation often increase rate of disease progression.10,40,41 This suggests that the mutations must either increase the depth of the reservoir and/or decrease the barrier to nucleation. An increase in cross-β propensity would stabilize the amyloid product but not increase the rate of amyloid formation unless the transition state at the nucleation step resembles cross-β. This idea can explain the inconsistency of secondary structure prediction of amyloid-prone sequences. A net kinetic effect will appear only if the nucleation barrier is reduced or the population of the Reservoir Oligomers is increased.
The Reservoir Oligomers are required for elongation of amyloid protofibrils. Therefore assays of toxicity of Seeding Oligomers when a pool of Reservoir Oligomers is not also present do not strictly evaluate the validity of the amyloid cascade hypothesis. Seeding experiments often show that the lag phase is greatly reduced but not completely eliminated as would be expected for a simple nucleation model. Under seeded conditions, the rate-determining step may be reformation of the pool of Reservoir Oligomers. The downhill landscape after the formation of Nucleating Oligomers assures the stability and accumulation of Seeding Oligomers and long protofibrils, which are the dominant diagnostic species in most investigations of amyloidogenesis. If this is true, then it is critical to prevent formation of Nucleating and Seeding Oligomers.
The free energy landscape picture also provides restrictions on the toxic oligomer hypothesis. Small toxic oligomers must exist at local free energy minima with significant barriers to amyloid formation; that is, they must be Reservoir Oligomers. Thus, kinetic mechanisms that imply local minima at only the monomer and fibril locations on the aggregation free energy landscape are incompatible with the toxic oligomer hypothesis.
The small oligomers used to assay toxicity have many morphologies as they arise from many different, often physiologically impossible, preparation conditions. The different preparation conditions likely constrain the aggregation to oligomers that may be unstable or impossible under amyloidogenic conditions. No attempt is usually made to place the oligomers into the context of amyloidogenic aggregation. As a result any combination of kinetic roles may be active in the assayed samples.
The toxic oligomer hypothesis cannot, on its own, explain why amyloid is observed in amyloid-related diseases. Nor can it explain the correlation between single amino acid mutations that increase amyloid propensity and the onset and severity of disease-related symptoms. This coincidence of the toxicity of small oligomers and their amyloidogenic properties can be explained with our mechanism. To form amyloid fibrils, which are the ultimate indicators of amyloidogenesis, Reservoir Oligomers must be present under amyloidogenic conditions. The rate of growth of amyloid protofibrils is controlled by the concentration of the Reservoir Oligomers. If the Reservoir Oligomers are also intrinsically toxic, this can explain the coincidence between the progression of disease and the presence of amyloid, as both depend on the concentration of the Reservoir Oligomers. It also explains the effects of single amino acid mutations if such changes increase the population of the Reservoir Oligomers.
Identification of targets for therapeutics depends on the nature of the aggregation free energy landscape. Therapeutic intervention relies on the inhibition or acceleration of particular reactions, which can be accomplished by increasing or decreasing the barriers on the aggregation free energy landscape. For example, β-LGA monomer is stabilized by the binding of an appropriate ligand, which increases the barrier to aggregation. Another approach is to open new reaction pathways to important species on the aggregation free energy landscape. Our mechanism suggests that the formation of Reservoir Oligomers is a key feature in both of the dominant amyloid-disease hypotheses. Reservoirs Oligomers are accordingly the best target during therapeutic design. For example, toxic species could be cleared by converting them to innocuous species. However, inhibiting fibril formation might enhance the population of Reservoir Oligomers and enhance toxicity if the toxic oligomer hypothesis is correct. Other therapeutic interventions could have similar unintended consequences because of the details of the aggregation free energy landscape.
Material and Methods
Incubation of β-LGA
β-LGA from bovine milk (Sigma product number: L-7880, Lot number: 026K7000) was found to contain salt impurities at a level of approximately 50% by mass and was therefore dialyzed against 100 mM pH 7.0 phosphate buffer to remove salt prior to use. Stock urea (Sigma) and phosphate (Sigma) buffer solutions were filtered with 0.02 and 0.22 μm filters, respectively. No filtration was done after protein solution dialysis. The final solution for incubation was approximately 0.95 mg/ml β-LGA in 13.7 mM, pH 7 phosphate buffer with 5.0 M urea. Concentration was verified by UV absorption. This sample was incubated in an Eppendorf tube at 37°C without agitation for over 30 days. Incubations were done on 3 separate occasions and produced consistent DLS and luminescence results each time. AFM measurements were performed in parallel from replicate samples and gave consistent results for three different incubations.
AFM Sample Preparation and Imaging
Each day, after inverting the tube once, 20 μL of the incubated solution was aliquoted for AFM imaging on modified mica. To modify the mica surface, 20 μL of 0.1% (v/v) APTES (Acros catalog number: 151081000) was applied evenly on freshly cleaved 9.9 mm diameter muscovite mica disk (Ted Pella product number: 50) and allowed to react for 10 minutes.92 Unreacted APTES was rinsed away with 15 mL Millipore water. The surface was dried with HPLC grade compressed nitrogen gas. Incubated sample was applied evenly on this freshly prepared surface and allowed to adsorb for 3 minutes. Unbound species were rinsed away with Millipore water. Residual water was blown away with nitrogen gas. The sample was imaged by a MultiMode Scanning Probe Microscope with a Nanoscope IIIa controller (Veeco), with a tapping-mode etched silicon probe (TESP, Veeco) in tapping mode in air. The scan speed was 1 Hz with an image size of 512×512 pixels. Samples were stored in disk carriers when further imaging was required.
Image Analysis
Image analysis was performed using a custom protocol developed to identify, classify and measure all the particles in the many images taken throughout the incubation. We classified the detected particles as globular, protofibrillar and long fibrillar based on size and morphology. Models were used to deconvolute tip effects from the image lateral dimensions. The aggregation number, j, was calculated based on the deconvoluted size of particles.
Particle Identification
The tilt in raw AFM images was removed by fitting scan lines to a polynomial to yield flattened images. A dynamic threshold method was used to distinguish particles from the background.93 Each non-border pixel in the flattened AFM image was assigned a local background level, M(x, y), by averaging the values of n × n pixels around it. A user-defined threshold φ was assigned for each image according to its background and noise. Pixels with value P(x, y) ≥ M(x, y) + φ were retained in a binary image mask to identify particles. Next, position of the pixels with maximum value in each particle in the masked image was determined. Using these peak pixels as centers, small ρ × ρ sub-images containing only one detected particle were extracted from the flattened image. These sub-images were used in the next particle classification and measurement steps.
Particle Classification
We classified the particles based on a few simple features. The rarely observed long fibrillar species needed a much greater number of pixels to describe them and were easily distinguished from globular and short protofibrils. Such long fibrils were manually characterized by their height profiles. The globular and protofibrillar classes were abundant, so we automated the classification and measurement protocol. The globular particles were distinguished from short protofibrils by circularity, or the ratio of the square of the particle perimeter to 4π times particle area. A perfectly circular particle consequently would have a circularity of 1. A value of 1.2 was used to distinguish globular and protofibrillar particle classes.
Particle Measurements
To automate the dimensional measurements of large numbers of globular and protofibrillar particles in the image, particles were fit to 2D functions. These functions were solely designed to capture the observed shape and size of particles on surface as in the AFM images. Sub-images containing globular particles were fitted to 2D Gaussian function as in Eq. 1. The elliptical Gaussian function included deviation from circular geometry. Other functions were used to characterize the geometry. However, none offered improvements in reliability over the simple 2D Gaussian:
| (1) |
where,
The fit parameters x0 and y0 gave the position of globular particles in the subimage and θ described their orientation. The background P0, the amplitude α, and the standard deviation along major and minor axis of the 2D Gaussian, σx and σy, were related with particle dimensions. The fit parameter α systematically overestimated the height of globular particles in a width-dependent way. Therefore, we calculated the observed globular particle height on surface, Hg, by subtracting the local background P0 from the maximum pixel value of the particle. The observed globular particle radius on surface, Rg, is calculated as the average of the half lengths at half maximum of the major and minor axes,
| (2) |
To model the morphology of protofibrils on surface, we used a box with a height Hf, length Lf and width Wf, convoluted with a symmetric 2D Gaussian with standard deviation σc. The resulting function was used to fit the subimages containing protofibrils (Eq.3.):
| (3) |
The fit parameters Hf, Lf and Wf were used directly as the observed height, half length and half width of protofibrils on surface, respectively. σc accounted for both the edge shape of the protofibril and the tip.
Tip deconvolution and calculation of aggregation number
The molecular volume of each species observed is proportional to the aggregation number, j.
| (4) |
The volume of the folded monomer, V1 is approximately the maximum density achievable for the protein. Because of sample drying and soft sample tip compression, we assumed all the species on the surface had the same density as the folded monomer. With a molecular weight 18.4 kDa and a radius of ~1.76 nm, the density of folded monomer was calculated to be 1.34 × 10⁻²¹ g/nm3. To determine the aggregation number, j, for each species, we converted the fit dimensions of globular particles on surface to real particle dimensions and volume.
Particles in an AFM image are flattened by the interaction with the surface and by compression from the tip. We modeled the particles as a disc of thickness hg with radius of rm and rm + hg for top and bottom surface, respectively (Fig. 11). Its volume Vg can be calculated as in Eq. 5.
Figure 11.

Schematic of tip scanning globular particles deposited on surface during AFM imaging. Globular particles are modelled as disc (shown in red) partially embedded in a layer of deformed protein of ru thick (in brown). The tip is modelled as a sphere with radius rt. The size of tip prevents it from exactly tracing the particles on surface. The trace (shown in blue) of the last atom on tip (blue spot) is recorded as particle profile during imaging. The height of particle (hg) is underestimated to be Hg(=hg−hr) and the radius (rg) is overestimated as Rg during measurement. Based on this model, with observed height Hg and radius Rg, we calculated the real dimension of globular particles on surface.
| (5) |
Two experimental phenomena must be taken into account in the model. First, particles were partially embedded in a amorphous protein layer on the surface of thickness hu, resulting in a smaller observed height, Hg:
| (6) |
Second, the lateral dimension of particles are overestimated by the effect of the AFM tip. We modeled the tip as a sphere with radius rt. The blue trace in Fig. 11 illustrates the path recorded by the AFM tip under this geometry.
This observed profile, z(x), can be represent analytically by a piecewise function:
| (7) |
Where,
| (8) |
is the x position where the tip first contacts the particle.
Rg is the radius measured at the half-height and includes both an effect from the tip, rt and the surface layer, hu. The true radius of the particle at half-height above the layer is rg and can be expressed by:
| (9) |
To convert the observed width Rg to the globular particle radius rg, we use Eq. 9 and set Eq. 7 to its value at the experimentally observed, Rg, or z(Rg) = Hg/2+ hu. Solving for rg while eliminating rm and hg gives,
| (10) |
The parameter rm is given by
| (11) |
The volume of particle can be calculated from the experimental quantities substituting Eq. 6 and Eq. 11 into Eq. 5 giving:
| (12) |
Using Eq. 12 requires the observed dimensions (Hg, Rg) for each particle and estimates for the tip radius, rt, and thickness of the surface layer, hu for the entire image. The amorphous protein layer on clean mica surfaces was observed to be 0.6 to 0.8 nm thick. Therefore, the surface layer thickness was taken to be hu=0.7 nm for all images. Globular particles of the same volume and shape from different images should have the same height, hg and lateral dimension, rg. During imaging, tip wear and contamination from the sample resulted in deviation from its nominal ~10 nm radius. Although the distribution of heights is relatively unaffected by the tip shape, the distribution of lateral dimensions is strongly perturbed by it. Images with slightly different tip radii were pooled by adjusting the tip radius parameter for each related image such that the overall height-lateral-dimension distribution was matched. We matched the Hg and real length (2×rg) 2D histogram profiles for 50 images taken during the 32 days by adjusting the tip radius of each image. The tip radius was typically ~20 nm, though this parameter ranged between 5 and 80 nm. The resulting total histogram, shown in Fig. 3, provided an empirical relationship between Hg and rg:
| (13) |
shown as the dotted line in Fig. 3. This empirical function also allowed us to use Eq. 12 and Eq. 4 to correlate the heights of globular particles to their volumes and aggregation number, as shown by the numbered circles in Fig. 3. This relationship is used to convert kinetic simulation data, which returns the aggregation number, j, to particle dimensions that we compare with our data.
To determine the aggregation number of protofibrils, the same protein density was used as the globular particle on surface. We used the observed lateral dimension Wf and Lf directly to calculate the volume of protofibril on surface, Vf, assuming the tip effect for protofibrils was small because of their big size. Protofibrils were considered as an ellipsoid to estimate their volume as in Eq.14.
| (14) |
Image Analysis Protocol Performance
We applied this image analysis protocol to images from the first 32 incubation days. Every image had different noise level associated with imaging conditions, such as image size, tip, temperature, etc. We chose a local threshold (φ) to include all globular species and fibrils while rejecting the background from noise and the amorphous protein layer. Some small features of the background were unavoidably included. However, these features did not have a well-defined shape and were too small for the fitting algorithm to give accurate, converged fits. Whether a particle can be successfully fitted depended on how many pixels in the images were used to define the particle and the noise level in that image. For images of the same size, fits of small particles defined by just several pixels were more likely to be compromised by noise than bigger particles. The higher resolution images allowed more pixels to define a particle of a given size, making it more likely to be successfully fitted. As a result, the population of smallest particles around 1 nm high was determined with high accuracy in the 2 μm images but was underestimated in 5 μm images. Other than this uncertainty, enough particles of different heights of interest were successfully fitted (more than 85%) to gave us a reliable estimation on the species present and their population distribution.
Even though we carefully controlled the sample deposition process, we observed small variations of particle coverage between samples. We attribute this variability to different degrees of APTES surface functionalization and to variation during the Millipore water rinsing step used to remove salt and any loose material. Though the particle coverage on surface varied between images, the relative populations appeared not to change for a given point in the incubation. Therefore to allow comparison between different days of the incubation, we normalized the two-dimensional height-length distribution for each day to the most populated species detected on that day.
Kinetic Simulations
All kinetic simulations were accomplished in Mathematica 6.0. Kinetic models (as discussed in the results section) were formulated based on the observation of different intermediates. We numerically solved the resulting coupled differential equations to get the population evolution for each species. These populations were compared to DLS and AFM results to determine kinetic rate constants and to discard kinetic models that could not be made consistent with observations.
Comparison of Simulations to Experiments
To directly compare with our DLS measurements, we simulated evolution of the correlation decay time distribution based on evolution of the population of different species given by the kinetic simulation, aj(t) (Eq. 15). We modeled the contribution of each species as a Gaussian distribution positioned at the decay time corresponding to its size with a standard deviation of 0.004 ms.
| (15) |
ω is the scale factor between particle size and decay time which was determined by our DLS experiments to be 0.02.66
To convert simulated population on each day, aj(t), to height, length 2D histogram as in AFM measurement, we used Eq. 16.
| (16) |
where for globular particles the observed height, Hg,j, and real width lg,j (as 2rg,j) on surface can be calculated according to aggregation number as discussed above (Fig. 3). For protofibrils, an averaged observed height was used for Hf,g. The length lf,j can be calculated (as Lf) with Eq. 14. σH and σl are the standard deviation in height and width measurement, respectively. They were estimated to be 0.37 nm and 2 nm, based on the dispersion of height and length signal in the experimental height-length 2D histogram.
To generate the ANS fluorescence lifetime fingerprint evolution based on population evolution from kinetic simulation, we assumed that the fluorescence intensity was proportional to aggregation number, j, in each species. The total fluorescence Ca(t) for a given class of oligomer was obtained by the weighted sum:
| (17) |
where aj(t) is the time evolution of species concentration, aj, where a ∈ {A, B, F } and j was summed over the range of relevant oligomer sizes. The same proportionality constant was used for all species.
Determination of Rate Coefficients
The early lag phase contained several rate coefficients that we fit by minimizing the Kullback-Leibler (K-L) divergence94 between the simulated correlation decay time distribution evolution and experimental data:
| (18) |
where Is(τ, t)† and Ie(τ, t)† are the DLS correlation decay time distributions normalized by maximum intensity of each incubation time point, from simulation (Eq. 15) and experiment, respectively. After finding the minimum divergence, we perturbed each parameter to evaluate the sensitivity of the fit.
To account for the many related association reactions present in the late lag phase and the growth phase, we began from a basic encounter-theory approach, assuming diffusion-limited collisions with a free energy of activation that accounts for both entropic and energetic barriers to aggregation.95 The rate constant for association steps during these phases, kj+, can thus be expressed as in Eq. 19.
| (19) |
where is the diffusion limited rate constant for species with aggregation number, j, reacting with the the assembly unit. kB is the Boltzmann constant. ΔG‡ is the free energy barrier for that association step.
The diffusion-limited rate coefficients for globular particle growth by addition of globular assembly unit, Aδ, were calculated with
| (20) |
where Dδ and Dg,j are the diffusion constants for globular assembly unit and globular particles, respectively, which can be calculated with Einstein-Stokes-Debye equation. The globular particle radius in solution, rsol,j, was calculated assuming all the globular species have the same density 4.67 × 10⁻²²g/nm3, which was calculated with a partially unfolded monomer radius ~2.5 nm from DLS measurements.66
| (21) |
where η is the viscosity of protein solution, 0.876 centipoise in our case (measured for 5 M urea in buffer at 37°C).
For protofibril elongation, fibril-fibril interaction was not included in the simulation. Protofibrils elongated by adding globular assembly units to the end. We assumed that protofibrils had the same density and dimension in solution and on surface. The protofibrils were treated as a string of imaginary touching spheres whose diameter equalled to protofibril height.96 The diffusion-limited rate coefficient in this case is
| (22) |
where Df,j and Dδ are the diffusion constants for fibril and the globular assembly unit, respectively. ris is the radius of the imaginary sphere, which equals half the height of protofibrils, Hf + hu. Again, an averaged height on surface was used.
The diffusion constants were calculated using:
| (23) |
where Dis is the diffusion constant for the imaginary sphere and N is the number of spheres along the protofibril, calculated as the protofibril length divided by protofibril height.96
Calculation of free energy difference
The free energy difference was calculated as
| (24) |
δ is the number of monomers in the association unit and k(j+δ)− is the reverse rate for association steps.
Acknowledgments
This work was supported in part by a grant from the National Institutes of Health #R01GM071684. JTG was supported by a Graduate Assistantship in Areas of National Need grant to the Department of Chemistry and Chemical Biology. We thank Richard Ebright for the use of AFM.
Footnotes
Publisher's Disclaimer: This is a PDF file of an unedited manuscript that has been accepted for publication. As a service to our customers we are providing this early version of the manuscript. The manuscript will undergo copyediting, typesetting, and review of the resulting proof before it is published in its final citable form. Please note that during the production process errors may be discovered which could affect the content, and all legal disclaimers that apply to the journal pertain.
References
- 1.Chiti F, Dobson CM. Protein misfolding, functional amyloid, and human disease. Annu Rev Biochem. 2006;75:333–366. doi: 10.1146/annurev.biochem.75.101304.123901. [DOI] [PubMed] [Google Scholar]
- 2.Selkoe DJ. Folding proteins in fatal ways. Nature (London, U K) 2003;426:900–904. doi: 10.1038/nature02264. [DOI] [PubMed] [Google Scholar]
- 3.Pepys MB. Pathogenesis, diagnosis and treatment of systemic amyloidosis. Philos Trans R Soc London, Ser B. 2001;356:203–211. doi: 10.1098/rstb.2000.0766. [DOI] [PMC free article] [PubMed] [Google Scholar]
- 4.Pepys MB. Amyloidosis. Annu Rev Med. 2006;57:223–241. doi: 10.1146/annurev.med.57.121304.131243. [DOI] [PubMed] [Google Scholar]
- 5.Polymeropoulos MH, Lavedan C, Leroy E, Ide SE, Dehejia A, Dutra A, Pike B, Root H, Rubenstein J, Boyer R, Stenroos ES, Chandrasekharappa S, Athanassiadou A, Papapetropoulos T, Johnson WG, Lazzarini AM, Duvoisin RC, Iorio GD, Golbe LI, Nussbaum RL. Mutation in the alpha-synuclein gene identified in families with parkinson’s disease. Science. 1997;276:2045–2047. doi: 10.1126/science.276.5321.2045. [DOI] [PubMed] [Google Scholar]
- 6.Krger R, Kuhn W, Mller T, Woitalla D, Graeber M, Ksel S, Przuntek H, Epplen JT, Schls L, Riess O. Ala30pro mutation in the gene encoding alpha-synuclein in parkinson’s disease. Nat Genet. 1998;18:106–108. doi: 10.1038/ng0298-106. URL http://dx.doi.org/10.1038/ng0298-106. [DOI] [PubMed]
- 7.Zarranz JJ, Alegre J, Gmez-Esteban JC, Lezcano E, Ros R, Ampuero I, Vidal L, Hoenicka J, Rodriguez O, Atars B, Llorens V, Tortosa EG, del Ser T, Muoz DG, de Yebenes JG. The new mutation, e46k, of alpha-synuclein causes parkinson and lewy body dementia. Ann Neurol. 2004;55:164–173. doi: 10.1002/ana.10795. URL http://dx.doi.org/10.1002/ana.10795. [DOI] [PubMed]
- 8.Mizuno Y, Hattori N, Kubo S-I, Sato S, Nishioka K, Hatano T, Tomiyama H, Funayama M, Machida Y, Mochizuki H. Progress in the pathogenesis and genetics of parkinson’s disease. Philos Trans R Soc Lond B Biol Sci. 2008;363:2215–2227. doi: 10.1098/rstb.2008.2273. URL http://dx.doi.org/10.1098/rstb.2008.2273. [DOI] [PMC free article] [PubMed]
- 9.Singleton AB, Farrer M, Johnson J, Singleton A, Hague S, Kachergus J, Hulihan M, Peuralinna T, Dutra A, Nussbaum R, Lincoln S, Crawley A, Hanson M, Maraganore D, Adler C, Cookson MR, Muenter M, Baptista M, Miller D, Blancato J, Hardy J, Gwinn-Hardy K. alpha-synuclein locus triplication causes parkinson’s disease. Science. 2003;302:841. doi: 10.1126/science.1090278. URL http://dx.doi.org/10.1126/science.1090278. [DOI] [PubMed]
- 10.Conway KA, Harper JD, Lansbury PT. Accelerated in vitro fibril formation by a mutant alpha-synuclein linked to early-onset parkinson disease. Nature Medicine. 1998;4:1318–1320. doi: 10.1038/3311. URL http://dx.doi.org/10.1038/3311. [DOI] [PubMed]
- 11.Lee MK, Stirling W, Xu Y, Xu X, Qui D, Mandir AS, Dawson TM, Copeland NG, Jenkins NA, Price DL. Human alpha-synuclein-harboring familial parkinson’s disease-linked ala-53-thr mutation causes neurodegenerative disease with alpha-synuclein aggregation in transgenic mice. Proc Natl Acad Sci U S A. 2002;99:8968–8973. doi: 10.1073/pnas.132197599. URL http://dx.doi.org/10.1073/pnas.132197599. [DOI] [PMC free article] [PubMed]
- 12.Iijima K, Chiang H-C, Hearn SA, Hakker I, Gatt A, Shenton C, Granger L, Leung A, Iijima-Ando K, Zhong Y. Abeta42 mutants with different aggregation profiles induce distinct pathologies in drosophila. PLoS ONE. 2008;3:e1703. doi: 10.1371/journal.pone.0001703. URL http://dx.doi.org/10.1371/journal.pone.0001703. [DOI] [PMC free article] [PubMed]
- 13.Meinhardt J, Tartaglia GG, Pawar A, Christopeit T, Hortschansky P, Schroeckh V, Dobson CM, Vendruscolo M, Fndrich M. Similarities in the thermodynamics and kinetics of aggregation of disease-related abeta(1–40) peptides. Protein Sci. 2007;16:1214–1222. doi: 10.1110/ps.062734207. URL http://dx.doi.org/10.1110/ps.062734207. [DOI] [PMC free article] [PubMed]
- 14.Caughey B, Lansbury PT. Protofibrils, pores, fibrils, and neurodegeneration: separating the responsible protein aggregates from the innocent bystanders. Annu Rev Neurosci. 2003;26:267–298. doi: 10.1146/annurev.neuro.26.010302.081142. URL http://dx.doi.org/10.1146/annurev.neuro.26.010302.081142. [DOI] [PubMed]
- 15.Hardy JA, Higgins GA. Alzheimer’s disease: the amyloid cascade hypothesis. Science (Washington, D C) 1992;256:184–5. doi: 10.1126/science.1566067. [DOI] [PubMed] [Google Scholar]
- 16.McGeer PL, McGeer EG. The inflammatory response system of brain: implications for therapy of alzheimer and other neurodegenerative diseases. Brain Res Brain Res Rev. 1995;21:195–218. doi: 10.1016/0165-0173(95)00011-9. [DOI] [PubMed] [Google Scholar]
- 17.Eikelenboom P, Veerhuis R. The role of complement and activated microglia in the pathogenesis of alzheimer’s disease. Neurobiol Aging. 1996;17:673–680. doi: 10.1016/0197-4580(96)00108-x. [DOI] [PubMed] [Google Scholar]
- 18.Pike CJ, Walencewicz AJ, Glabe CG, Cotman CW. Aggregation-related toxicity of synthetic beta-amyloid protein in hippocampal cultures. Eur J Pharmacol. 1991;207:367–368. doi: 10.1016/0922-4106(91)90014-9. [DOI] [PubMed] [Google Scholar]
- 19.Lorenzo A, Yankner BA. beta -amyloid neurotoxicity requires fibril formation and is inhibited by congo red. Proc Natl Acad Sci U S A. 1994;91:12243–7. doi: 10.1073/pnas.91.25.12243. [DOI] [PMC free article] [PubMed] [Google Scholar]
- 20.Mucke L, Masliah E, Yu GQ, Mallory M, Rockenstein EM, Tatsuno G, Hu K, Kholodenko D, Johnson-Wood K, McConlogue L. High-level neuronal expression of abeta 1–42 in wild-type human amyloid protein precursor transgenic mice: synaptotoxicity without plaque formation. J Neurosci. 2000;20:4050–4058. doi: 10.1523/JNEUROSCI.20-11-04050.2000. [DOI] [PMC free article] [PubMed] [Google Scholar]
- 21.Dodart J-C, Bales KR, Gannon KS, Greene SJ, DeMattos RB, Mathis C, DeLong CA, Wu S, Wu X, Holtzman DM, Paul SM. Immunization reverses memory deficits without reducing brain abeta burden in alzheimer’s disease model. Nat Neurosci. 2002;5:452–457. doi: 10.1038/nn842. URL http://dx.doi.org/10.1038/nn842. [DOI] [PubMed]
- 22.Meier JJ, Kayed R, Lin C-Y, Gurlo T, Haataja L, Jayasinghe S, Langen R, Glabe CG, Butler PC. Inhibition of human iapp fibril formation does not prevent beta-cell death: evidence for distinct actions of oligomers and fibrils of human iapp. Am J Physiol Endocrinol Metab. 2006;291:E1317–E1324. doi: 10.1152/ajpendo.00082.2006. URL http://dx.doi.org/06. [DOI] [PubMed]
- 23.Lue LF, Kuo YM, Roher AE, Brachova L, Shen Y, Sue L, Beach T, Kurth JH, Rydel RE, Rogers J. Soluble amyloid beta peptide concentration as a predictor of synaptic change in alzheimer’s disease. Am J Pathol. 1999;155:853–62. doi: 10.1016/s0002-9440(10)65184-x. [DOI] [PMC free article] [PubMed] [Google Scholar]
- 24.McLean CA, Cherny RA, Fraser FW, Fuller SJ, Smith MJ, Beyreuther K, Bush AI, Masters CL. Soluble pool of abeta amyloid as a determinant of severity of neurodegeneration in alzheimer’s disease. Ann Neurol. 1999;46:860–866. doi: 10.1002/1531-8249(199912)46:6<860::aid-ana8>3.0.co;2-m. [DOI] [PubMed] [Google Scholar]
- 25.Klein WL, Krafft GA, Finch CE. Targeting small abeta oligomers: the solution to an alzheimer’s disease conundrum? Trends Neurosci. 2001;24:219–224. doi: 10.1016/s0166-2236(00)01749-5. [DOI] [PubMed] [Google Scholar]
- 26.Kirkitadze MD, Bitan G, Teplow DB. Paradigm shifts in alzheimer’s disease and other neurodegenerative disorders: the emerging role of oligomeric assemblies. J Neurosci Res. 2002;69:567–577. doi: 10.1002/jnr.10328. [DOI] [PubMed] [Google Scholar]
- 27.Klein WL, Stine WB, Teplow DB. Small assemblies of unmodified amyloid beta -protein are the proximate neurotoxin in alzheimer’s disease. Neurobiol Aging. 2004;25:569–580. doi: 10.1016/j.neurobiolaging.2004.02.010. [DOI] [PubMed] [Google Scholar]
- 28.Crowther DC, Kinghorn KJ, Miranda E, Page R, Curry JA, Duthie FAI, Gubb DC, Lomas DA. Intraneuronal abeta, non-amyloid aggregates and neurodegeneration in a drosophila model of alzheimer’s disease. Neuroscience. 2005;132:123–135. doi: 10.1016/j.neuroscience.2004.12.025. URL http://dx.doi.org/10.1016/j.neuroscience.2004.12.025. [DOI] [PubMed]
- 29.Cleary JP, Walsh DM, Hofmeister JJ, Shankar GM, Kuskowski MA, Selkoe DJ, Ashe KH. Natural oligomers of the amyloid-beta protein specifically disrupt cognitive function. Nat Neurosci. 2005;8:79–84. doi: 10.1038/nn1372. URL http://dx.doi.org/10.1038/nn1372. [DOI] [PubMed]
- 30.Dennis S. Soluble oligomers of the amyloid beta-protein impair synaptic plasticity and behavior. Behav Brain Res. 2008;192:106–13. doi: 10.1016/j.bbr.2008.02.016. [DOI] [PMC free article] [PubMed] [Google Scholar]
- 31.Laurn J, Gimbel DA, Nygaard HB, Gilbert JW, Strittmatter SM. Cellular prion protein mediates impairment of synaptic plasticity by amyloid-beta oligomers. Nature. 2009;457:1128–1132. doi: 10.1038/nature07761. URL http://dx.doi.org/10.1038/nature07761. [DOI] [PMC free article] [PubMed]
- 32.Walsh DM, Klyubin I, Fadeeva JV, Cullen WK, Anwyl R, Wolfe MS, Rowan MJ, Selkoe DJ. Naturally secreted oligomers of amyloid beta protein potently inhibit hippocampal long-term potentiation in vivo. Nature. 2002;416:535–539. doi: 10.1038/416535a. URL http://dx.doi.org/10.1038/416535a. [DOI] [PubMed]
- 33.Chromy BA, Nowak RJ, Lambert MP, Viola KL, Chang L, Velasco PT, Jones BW, Fernandez SJ, Lacor PN, Horowitz P, Finch CE, Krafft GA, Klein WL. Self-assembly of abeta 1–42 into globular neurotoxins. Biochemistry. 2003;42:12749–12760. doi: 10.1021/bi030029q. [DOI] [PubMed] [Google Scholar]
- 34.Kayed R, Sokolov Y, Edmonds B, McIntire TM, Milton SC, Hall JE, Glabe CG. Permeabilization of lipid bilayers is a common conformation-dependent activity of soluble amyloid oligomers in protein misfolding diseases. J Biol Chem. 2004;279:46363–46366. doi: 10.1074/jbc.C400260200. URL http://dx.doi.org/10.1074/jbc.C400260200. [DOI] [PubMed]
- 35.Demuro A, Mina E, Kayed R, Milton SC, Parker I, Glabe CG. Calcium dysregulation and membrane disruption as a ubiquitous neurotoxic mechanism of soluble amyloid oligomers. J Biol Chem. 2005;280:17294–17300. doi: 10.1074/jbc.M500997200. URL http://dx.doi.org/10.1074/jbc.M500997200. [DOI] [PubMed]
- 36.Carrotta R, Carlo MD, Manno M, Montana G, Picone P, Romancino D, Biagio PLS. Toxicity of recombinant beta-amyloid prefibrillar oligomers on the morphogenesis of the sea urchin paracentrotus lividus. FASEB Journal. 2006;20:1916–1917. doi: 10.1096/fj.06-5716fje. URL http://dx.doi.org/10.1096/fj.06-5716fje. [DOI] [PubMed]
- 37.Danzer KM, Haasen D, Karow AR, Moussaud S, Habeck M, Giese A, Kretzschmar H, Hengerer B, Kostka M. Different species of alpha-synuclein oligomers induce calcium influx and seeding. J Neurosci. 2007;27:9220–9232. doi: 10.1523/JNEUROSCI.2617-07.2007. URL http://dx.doi.org/10.1523/JNEUROSCI.2617-07.2007. [DOI] [PMC free article] [PubMed]
- 38.Bucciantini M, Giannoni E, Chiti F, Baroni F, Formigli L, Zurdo J, Taddei N, Ramponi G, Dobson CM, Stefani M. Inherent toxicity of aggregates implies a common mechanism for protein misfolding diseases. Nature. 2002;416:507–511. doi: 10.1038/416507a. URL http://dx.doi.org/10.1038/416507a. [DOI] [PubMed]
- 39.Bitan G, Fradinger EA, Spring SM, Teplow DB. Neurotoxic protein oligomers–what you see is not always what you get. Amyloid. 2005;12:88–95. doi: 10.1080/13506120500106958. URL http://dx.doi.org/10.1080/13506120500106958. [DOI] [PubMed]
- 40.Narhi L, Wood SJ, Steavenson S, Jiang Y, Wu GM, Anafi D, Kaufman SA, Martin F, Sitney K, Denis P, Louis JC, Wypych J, Biere AL, Citron M. Both familial parkinson’s disease mutations accelerate alpha-synuclein aggregation. J Biol Chem. 1999;274:9843–9846. doi: 10.1074/jbc.274.14.9843. [DOI] [PubMed] [Google Scholar]
- 41.Greenbaum EA, Graves CL, Mishizen-Eberz AJ, Lupoli MA, Lynch DR, Englander SW, Axelsen PH, Giasson BI. The e46k mutation in alpha-synuclein increases amyloid fibril formation. J Biol Chem. 2005;280:7800–7807. doi: 10.1074/jbc.M411638200. URL http://dx.doi.org/10.1074/jbc.M411638200. [DOI] [PubMed]
- 42.Watson D, Castano E, Kokjohn TA, Kuo YM, Lyubchenko Y, Pinsky D, Connolly E, Sander J, Esh C, Luehrs DC, Stine WB, Rowse LM, Emmerling MR, Roher AE. Physicochemical characteristics of soluble oligomeric abeta and their pathologic role in alzheimer’s disease. Neurol Res. 2005;27:869–881. doi: 10.1179/016164105X49436. [DOI] [PubMed] [Google Scholar]
- 43.Walsh DM, Hartley DM, Kusumoto Y, Fezoui Y, Condron MM, Lomakin A, Benedek GB, Selkoe DJ, Teplow DB. Amyloid beta -protein fibrillogenesis. structure and biological activity of protofibrillar intermediates. J Biol Chem. 1999;274:25945–25952. doi: 10.1074/jbc.274.36.25945. [DOI] [PubMed] [Google Scholar]
- 44.Conway KA, Harper JD, Lansbury Peter TJ. Fibrils formed in vitro from alpha -synuclein and two mutant forms linked to parkinson’s disease are typical amyloid. Biochemistry. 2000;39:2552–2563. doi: 10.1021/bi991447r. [DOI] [PubMed] [Google Scholar]
- 45.Bitan G, Lomakin A, Teplow DB. Amyloid beta -protein oligomerization: prenucleation interactions revealed by photo-induced cross-linking of unmodified proteins. J Biol Chem. 2001;276:35176–35184. doi: 10.1074/jbc.M102223200. [DOI] [PubMed] [Google Scholar]
- 46.Modler AJ, Gast K, Lutsch G, Damaschun G. Assembly of amyloid protofibrils via critical oligomers-a novel pathway of amyloid formation. J Mol Biol. 2003;325:135–148. doi: 10.1016/s0022-2836(02)01175-0. [DOI] [PubMed] [Google Scholar]
- 47.Apetri MM, Maiti NC, Zagorski MG, Carey PR, Anderson VE. Secondary structure of alpha-synuclein oligomers: characterization by raman and atomic force microscopy. J Mol Biol. 2006;355:63–71. doi: 10.1016/j.jmb.2005.10.071. URL http://dx.doi.org/10.1016/j.jmb.2005.10.071. [DOI] [PubMed]
- 48.Podest A, Tiana G, Milani P, Manno M. Early events in insulin fibrillization studied by time-lapse atomic force microscopy. Biophys J. 2006;90:589–597. doi: 10.1529/biophysj.105.068833. URL http://dx.doi.org/10.1529/biophysj.105.068833. [DOI] [PMC free article] [PubMed]
- 49.Natalello A, Prokorov VV, Tagliavini F, Morbin M, Forloni G, Beeg M, Manzoni C, Colombo L, Gobbi M, Salmona M, Doglia SM. Conformational plasticity of the gerstmann-straeussler-scheinker disease peptide as indicated by its multiple aggregation pathways. J Mol Biol. 2008;381:1349–1361. doi: 10.1016/j.jmb.2008.06.063. [DOI] [PubMed] [Google Scholar]
- 50.Jarrett JT, Lansbury Peter TJ. Seeding “one-dimensional crystallization” of amyloid: A pathogenic mechanism in alzheimer’s disease and scrapie? Cell (Cambridge, Mass) 1993;73:1055–8. doi: 10.1016/0092-8674(93)90635-4. [DOI] [PubMed] [Google Scholar]
- 51.Lomakin A, Chung DS, Benedek GB, Kirschner DA, Teplow DB. On the nucleation and growth of amyloid beta-protein fibrils: detection of nuclei and quantitation of rate constants. Proc Natl Acad Sci U S A. 1996;93:1125–1129. doi: 10.1073/pnas.93.3.1125. [DOI] [PMC free article] [PubMed] [Google Scholar]
- 52.Serio TR, Cashikar AG, Kowal AS, Sawicki GJ, Moslehi JJ, Serpell L, Arnsdorf MF, Lindquist SL. Nucleated conformational conversion and the replication of conformational information by a prion determinant. Science (Washington, D C) 2000;289:1317–1321. doi: 10.1126/science.289.5483.1317. [DOI] [PubMed] [Google Scholar]
- 53.Hoozemans JJM, Veerhuis R, Haastert ESV, Rozemuller JM, Baas F, Eikelenboom P, Scheper W. The unfolded protein response is activated in alzheimer’s disease. Acta Neuropathol. 2005;110:165–172. doi: 10.1007/s00401-005-1038-0. URL http://dx.doi.org/10.1007/s00401-005-1038-0. [DOI] [PubMed]
- 54.Volles MJ, Lansbury PT. Vesicle permeabilization by protofibrillar alpha-synuclein is sensitive to parkinson’s disease-linked mutations and occurs by a pore-like mechanism. Biochemistry. 2002;41:4595–4602. doi: 10.1021/bi0121353. [DOI] [PubMed] [Google Scholar]
- 55.Kagan BL, Azimov R, Azimova R. Amyloid peptide channels. J Membr Biol. 2004;202:1–10. doi: 10.1007/s00232-004-0709-4. URL http://dx.doi.org/10.1007/s00232-004-0709-4. [DOI] [PubMed]
- 56.Varvel NH, Bhaskar K, Patil AR, Pimplikar SW, Herrup K, Lamb BT. Abeta oligomers induce neuronal cell cycle events in alzheimer’s disease. J Neurosci. 2008;28:10786–10793. doi: 10.1523/JNEUROSCI.2441-08.2008. URL http://dx.doi.org/10.1523/JNEUROSCI.2441-08.2008. [DOI] [PMC free article] [PubMed]
- 57.Narayanan V, Scarlata S. Membrane binding and self-association of alpha-synucleins. Biochemistry. 2001;40:9927–9934. doi: 10.1021/bi002952n. [DOI] [PubMed] [Google Scholar]
- 58.Zhu M, Souillac PO, Ionescu-Zanetti C, Carter SA, Fink AL. Surface-catalyzed amyloid fibril formation. J Biol Chem. 2002;277:50914–50922. doi: 10.1074/jbc.M207225200. URL http://dx.doi.org/10.1074/jbc.M207225200. [DOI] [PubMed]
- 59.Zhu M, Fink AL. Lipid binding inhibits alpha-synuclein fibril formation. J Biol Chem. 2003;278:16873–16877. doi: 10.1074/jbc.M210136200. URL http://dx.doi.org/10.1074/jbc.M210136200. [DOI] [PubMed]
- 60.Sluzky V, Tamada JA, Klibanov AM, Langer R. Kinetics of insulin aggregation in aqueous solutions upon agitation in the presence of hydrophobic surfaces. Proc Natl Acad Sci U S A. 1991;88:9377–9381. doi: 10.1073/pnas.88.21.9377. [DOI] [PMC free article] [PubMed] [Google Scholar]
- 61.Jiang D, Dinh KL, Ruthenburg TC, Zhang Y, Su L, Land DP, Zhou F. A kinetic model for beta-amyloid adsorption at the air/solution interface and its implication to the beta-amyloid aggregation process. J Phys Chem B. 2009;113:3160–3168. doi: 10.1021/jp8085792. URL http://dx.doi.org/10.1021/jp8085792. [DOI] [PMC free article] [PubMed]
- 62.Ramirez-Alvarado M, Merkel JS, Regan L. A systematic exploration of the influence of the protein stability on amyloid fibril formation in vitro. Proc Natl Acad Sci U S A. 2000;97:8979–8984. doi: 10.1073/pnas.150091797. URL http://dx.doi.org/10.1073/pnas.150091797. [DOI] [PMC free article] [PubMed]
- 63.Collins SR, Douglass A, Vale RD, Weissman JS. Mechanism of prion propagation: amyloid growth occurs by monomer addition. PLoS Biology. 2004;2:1582–1590. doi: 10.1371/journal.pbio.0020321. [DOI] [PMC free article] [PubMed] [Google Scholar]
- 64.Bitan G, Kirkitadze MD, Lomakin A, Vollers SS, Benedek GB, Teplow DB. Amyloid beta -protein (abeta) assembly: Abeta 40 and abeta 42 oligomerize through distinct pathways. Proc Natl Acad Sci U S A. 2003;100:330–335. doi: 10.1073/pnas.222681699. [DOI] [PMC free article] [PubMed] [Google Scholar]
- 65.Hurshman AR, White JT, Powers ET, Kelly JW. Transthyretin aggregation under partially denaturing conditions is a downhill polymerization. Biochemistry. 2004;43:7365–7381. doi: 10.1021/bi049621l. [DOI] [PubMed] [Google Scholar]
- 66.Giurleo JT, He X, Talaga DS. beta -lactoglobulin assembles into amyloid through sequential aggregated intermediates. J Mol Biol. 2008;381:1332–1348. doi: 10.1016/j.jmb.2008.06.043. [DOI] [PubMed] [Google Scholar]
- 67.Gosal WS, Myers SL, Radford SE, Thomson NH. Amyloid under the atomic force microscope. Protein Pept Lett. 2006;13:261–270. doi: 10.2174/092986606775338498. [DOI] [PubMed] [Google Scholar]
- 68.Kad NM, Myers SL, Smith DP, Smith DA, Radford SE, Thomson NH. Hierarchical assembly of beta 2-microglobulin amyloid in vitro revealed by atomic force microscopy. J Mol Biol. 2003;330:785–797. doi: 10.1016/s0022-2836(03)00583-7. [DOI] [PubMed] [Google Scholar]
- 69.Dahlgren KN, Manelli AM, Stine W, Blaine J, Baker LK, Krafft GA, LaDu MJ. Oligomeric and fibrillar species of amyloid-beta peptides differentially affect neuronal viability. J Biol Chem. 2002;277:32046–32053. doi: 10.1074/jbc.M201750200. [DOI] [PubMed] [Google Scholar]
- 70.Stine W, Blaine J, Dahlgren KN, Krafft GA, LaDu MJ. In vitro characterization of conditions for amyloid-beta peptide oligomerization and fibrillogenesis. J Biol Chem. 2003;278:11612–11622. doi: 10.1074/jbc.M210207200. [DOI] [PubMed] [Google Scholar]
- 71.Green J, Goldsbury C, Mini T, Sunderji S, Frey P, Kistler J, Cooper G, Aebi U. Full-length rat amylin forms fibrils following substitution of single residues from human amylin. J Mol Biol. 2003;326:1147–1156. doi: 10.1016/s0022-2836(02)01377-3. [DOI] [PubMed] [Google Scholar]
- 72.Harper JD, Wong SS, Lieber CM, Lansbury Peter TJ. Assembly of abeta amyloid protofibrils: An in vitro model for a possible early event in alzheimer’s disease. Biochemistry. 1999;38:8972–8980. doi: 10.1021/bi9904149. [DOI] [PubMed] [Google Scholar]
- 73.Gosal WS, Clark AH, Ross-Murphy SB. Fibrillar beta -lactoglobulin gels: Part 1. fibril formation and structure. Biomacromolecules. 2004;5:2408–2419. doi: 10.1021/bm049659d. [DOI] [PubMed] [Google Scholar]
- 74.Xu S, Bevis B, Arnsdorf MF. The assembly of amyloidogenic yeast sup35 as assessed by scanning (atomic) force microscopy: an analogy to linear colloidal aggregation? Biophys J. 2001;81:446–454. doi: 10.1016/S0006-3495(01)75712-8. [DOI] [PMC free article] [PubMed] [Google Scholar]
- 75.Harper JD, Wong SS, Lieber CM, Lansbury Peter TJ. Observation of metastable abeta amyloid protofibrils by atomic force microscopy. Chem Biol. 1997;4:119–125. doi: 10.1016/s1074-5521(97)90255-6. [DOI] [PubMed] [Google Scholar]
- 76.Ding TT, Lee SJ, Rochet JC, Lansbury Peter TJ. Annular alpha -synuclein protofibrils are produced when spherical protofibrils are incubated in solution or bound to brain-derived membranes. Biochemistry. 2002;41:10209–10217. doi: 10.1021/bi020139h. [DOI] [PubMed] [Google Scholar]
- 77.Padrick SB, Miranker AD. Islet amyloid: Phase partitioning and secondary nucleation are central to the mechanism of fibrillogenesis. Biochemistry. 2002;41:4694–4703. doi: 10.1021/bi0160462. [DOI] [PubMed] [Google Scholar]
- 78.Kayed R, Head E, Thompson JL, McIntire TM, Milton SC, Cotman CW, Glabe CG. Common structure of soluble amyloid oligomers implies common mechanism of pathogenesis. Science (Washington, DC, U S) 2003;300:486–489. doi: 10.1126/science.1079469. [DOI] [PubMed] [Google Scholar]
- 79.Powers ET, Powers DL. Mechanisms of protein fibril formation: nucleated polymerization with competing off-pathway aggregation. Biophys J. 2008;94:379–391. doi: 10.1529/biophysj.107.117168. [DOI] [PMC free article] [PubMed] [Google Scholar]
- 80.Lomakin A, Teplow DB, Kirschner DA, Benedek GB. Kinetic theory of fibrillogenesis of amyloid beta-protein. Proc Natl Acad Sci U S A. 1997;94:7942–7947. doi: 10.1073/pnas.94.15.7942. [DOI] [PMC free article] [PubMed] [Google Scholar]
- 81.Andrews JM, Roberts CJ. A lumry-eyring nucleated polymerization model of protein aggregation kinetics: 1. aggregation with pre-equilibrated unfolding. J Phys Chem B. 2007;111:7897–7913. doi: 10.1021/jp070212j. URL http://dx.doi.org/10.1021/jp070212j. [DOI] [PubMed]
- 82.Sawyer L, Kontopidis G. The core lipocalin, bovine beta-lactoglobulin. Biochim Biophys Acta. 2000;1482:136–148. doi: 10.1016/s0167-4838(00)00160-6. [DOI] [PubMed] [Google Scholar]
- 83.Kontopidis G, Holt C, Sawyer L. Invited review: beta-lactoglobulin: binding properties, structure, and function. J Dairy Sci. 2004;87:785–796. doi: 10.3168/jds.S0022-0302(04)73222-1. [DOI] [PubMed] [Google Scholar]
- 84.Uhrnov S, Smith MH, Jameson GB, Uhrn D, Sawyer L, Barlow PN. Structural changes accompanying ph-induced dissociation of the beta-lactoglobulin dimer. Biochemistry. 2000;39:3565–3574. doi: 10.1021/bi992629o. [DOI] [PubMed] [Google Scholar]
- 85.D’Alfonso L, Collini M, Baldini G. Evidence of heterogeneous 1-anilinonaphthalene-8-sulfonate binding to beta-lactoglobulin from fluorescence spectroscopy. Biochim Biophys Acta. 1999;1432:194–202. doi: 10.1016/s0167-4838(99)00105-3. [DOI] [PubMed] [Google Scholar]
- 86.Collini M, D’Alfonso L, Baldini G. New insight on beta-lactoglobulin binding sites by 1-anilinonaphthalene-8-sulfonate fluorescence decay. Protein Sci. 2000;9:1968–1974. doi: 10.1110/ps.9.10.1968. URL http://dx.doi.org/10.1110/ps.9.10.1968. [DOI] [PMC free article] [PubMed]
- 87.Carrotta R, Bauer R, Waninge R, Rischel C. Conformational characterization of oligomeric intermediates and aggregates in beta-lactoglobulin heat aggregation. Protein Sci. 2001;10:1312–1318. doi: 10.1110/ps.42501. [DOI] [PMC free article] [PubMed] [Google Scholar]
- 88.Hamada D, Dobson CM. A kinetic study of beta -lactoglobulin amyloid fibril formation promoted by urea. Protein Sci. 2002;11:2417–2426. doi: 10.1110/ps.0217702. [DOI] [PMC free article] [PubMed] [Google Scholar]
- 89.Sagis LMC, Veerman C, van der Linden E. Mesoscopic properties of semiflexible amyloid fibrils. Langmuir. 2004;20:924–927. doi: 10.1021/la035390s. [DOI] [PubMed] [Google Scholar]
- 90.Hamada D, Tanaka T, Tartaglia GG, Pawar A, Vendruscolo M, Kawamura M, Tamura A, Tanaka N, Dobson CM. Competition between folding, native-state dimerisation and amyloid aggregation in beta-lactoglobulin. J Mol Biol. 2009;386:878–890. doi: 10.1016/j.jmb.2008.12.038. URL http://dx.doi.org/10.1016/j.jmb.2008.12.038. [DOI] [PubMed]
- 91.Thomas Scheibel, Jesse Bloom SLL. The elongation of yeast prion fibers involves separable steps of association and conversion. Proc Natl Acad Sci U S A. 2003;101:2287–2292. doi: 10.1073/pnas.0308754101. [DOI] [PMC free article] [PubMed] [Google Scholar]
- 92.Liu Z, Li Z, Zhou H, Wei G, Song Y, Wang L. Immobilization and condensation of dna with 3-aminopropyltriethoxysilane studied by atomic force microscopy. J Microsc. 2005;218:233–239. doi: 10.1111/j.1365-2818.2005.01482.x. URL http://dx.doi.org/10.1111/j.1365-2818.2005.01482.x. [DOI] [PubMed]
- 93.Schalkoff RJ. Digital Image Processing and Computer Vision. 1989:179. [Google Scholar]
- 94.Kullback S, Leibler RA. On information and sufficiency. Annals of Mathematical Statistics. 1951;22:79. [Google Scholar]
- 95.Lee CC, Nayak A, Sethuraman A, Belfort G, McRae GJ. A three-stage kinetic model of amyloid fibrillation. Biophys J. 2007;92:3448–3458. doi: 10.1529/biophysj.106.098608. [DOI] [PMC free article] [PubMed] [Google Scholar]
- 96.Hill TL. Linear Aggregation Theory in Cell Biology. 1987:93. [Google Scholar]