Abstract
The purpose of this study was to design and prepare rigid contrast agents with a precisely defined globular structure for MR angiography and tumor angiogenesis imaging. Generations 1 through 3 (Gd-DOTA-monoamide)-poly-L-lysine octasilsesquioxane dendrimers were prepared as nanoglobular MRI contrast agents. The nanoglobular Gd(III) chelates had a well-defined compact globular structure and high loading of Gd-DOTA-monoamide at their surface. The size of the G1, G2 and G3 nanoglobular MRI contrast agents was approximately 2.0, 2.4 and 3.2 nm, respectively. The T1 relaxivity of G1, G2 and G3 nanoglobular MRI contrast agents was approximately 6.4, 7.2, and 10.0 mM−1sec−1 at 3T, respectively. The nanoglobular MRI contrast agents showed size-dependent contrast enhancement within the mouse vasculature, which gradually decayed to baseline after a 60-min session. The G3 nanoglobular contrast agent resulted in more significant and prolonged vascular enhancement than the smaller nanoglobular agents at 0.03 mmol-Gd/kg. The G3 agent also provided significant and prolonged contrast enhancement in the heart and vasculature at a dose as low as 0.01 mmol-Gd/kg, 1/10th of the regular clinical dose. Significant enhancement was observed in tumor for all contrast agents. The nanoglobular contrast agents cleared via renal filtration and accumulated in the urinary bladder as shown in the dynamic MR images. The nanoglobular Gd(III) chelates are effective intravascular MRI contrast agents at substantially reduced doses. The nanoglobular MRI contrast agents are promising for further preclinical development for MR angiography and MR imaging of tumor angiogenesis.
Introduction
A safe and effective contrast agent for magnetic resonance angiography (MRA) and magnetic resonance imaging (MRI) of tumor angiogenesis is desired. Current Gd(III)-based extravascular and intravascular contrast agents (CAs) pose significant challenges for MRA and tumor imaging. Extravascular agents are characterized by rapid extravasation from the vasculature, nonspecific and transient tissue retention, and unfavorable pharmacokinetics (1). High doses or multiple doses are often used for MRA, but this practice has raised safety concerns in regards to nephrogenic systemic fibrosis in patients with impaired renal functions (2-4). Macromolecular Gd(III) complexes have been developed as intravascular CAs for blood pool and tumor angiogenesis imaging (5-11). These larger complexes are more effective than low molecular weight CAs because they provide greater and prolonged contrast enhancement within the blood pool at lower doses. Furthermore, macromolecules can passively accumulate within tumor tissue due to high density of angiogenic microvessel in tumor and the enhanced permeability and retention effect of macromolecules (12). Despite the advantages of macromolecular CAs, they are associated with a few limitations. For instance, linear macromolecular CAs have poorly defined architectures. Also, their random morphology and hydrodynamic volume leads to inconsistent and unpredictable pharmacokinetics, which may thwart experimental repeatability. These larger Gd(III) complexes are also associated with slower excretion and elevated tissue accumulation; prolonged tissue retention increases the possibility of Gd leakage from the Gd(III) complex (11,13,14). These drawbacks are a major factor impeding the clinical development of macromolecular Gd(III) complexes (14).
In addition to linear polymers, dendrimer Gd(III) complexes have been investigated as MRA CAs. Dendrimeric macromolecules are a unique class of polymers because they are prepared by step-up synthesis and have controllable molecular sizes and a defined morphology (15). Gd(III)-chelates conjugated to polyamidoamine (PAMAM) dendrimers have a greater Gd3+ ion payload, and exhibit size-dependant relaxivity and pharmacokinetics (16-18). Although this class of CAs is promising for vascular imaging, conventional dendrimeric carriers still have a relatively flexible structure, which is retained after conjugation of Gd(III)-chelates. Consequently, the flexible structure may affect carrier morphology in vivo, and quite possibly increase non-specific interactions and result in unpredictable pharmacokinetics and prolonged tissue retention (16, 19).
A favorable carrier of Gd-chelates for MRA and tumor angiogenesis imaging should have a compact globular morphology with a precisely defined architecture. The compact and globular shape is preferred over flexible globular systems because it would minimize non-specific interactions with healthy tissues and lower systemic accumulation. In addition, the globular morphology would maximize the number of Gd(III)-chelates conjugated to the surface, resulting in a greater loading capacity and a lower administered dose. Effective contrast enhancement at a substantially reduced dose could significantly decrease dose-related toxic side effects of Gd(III) based CAs. Finally, the precisely defined globular architecture would facilitate well-controlled, size-dependant pharmacokinetics and experimental repeatability.
Recently, we have prepared poly-L-lysine octasilsesquioxane dendrimers with a compact three-dimensional molecular architecture using a symmetric octa(3-aminopropyl)silsesquioxane (OAS) cube as the dendrimer core (20). These dendrimers, or nanoglobules, exhibit a globular morphology and relatively compact and rigid structure that is contributed to the OAS cubic core (21). Furthermore, the nanoglobules were prepared with precisely defined molecular structures. The properties of the nanoglobules suggest that they are optimal carriers for MRI CAs.
The purpose of this study was to design and prepare poly-L-lysine OAS dendrimeric Gd-DOTA monoamide conjugates as nanoglobular CAs for MRA and tumor angiogenesis imaging. We hypothesize that these nanoglobular CAs would be safe and effective for MRA and tumor angiogenesis imaging because they could be administered at low doses, have well-controlled size-dependent pharmacokinetics, and rapidly excrete from the body to minimize tissue accumulation of toxic Gd3+ ions. Vascular contrast enhancement and tumor microvessel enhancement of the nanoglobular MRI CAs of different sizes were tested in mice bearing tumor xenografts using reduced doses as low as 0.01 mmol-Gd/kg.
Materials and Methods
All reagents were used without further purification unless otherwise stated. 1,4,7,10-Tetraazacyclododecane-1,4,7-tris-tert-butyl acetate-10-acetic acid [DOTA-tris(t-Bu)] was purchased from Macrocyclics (Dallas, TX). 2-(1H-Benzotriazole-1-yl)-1,1,3,3-tetramethyluronium hexafluorophosphate (HBTU), and 1-hydroxybenzotriazole hydrate (HOBt) were purchased from Nova Biochem (Darmstadt, Germany). N,N-Diisopropylethyl amine (DIPEA) and N,N-dimethylformamide anhydrous (DMF) were purchased from Alfa Aesar (Ward Hill, MA). Trifluoroacetic acid (TFA) was purchased from ACROS Organics (Morris Plains, NJ).
Sample purification was performed using high pressure liquid chromatography (HPLC) on an Agilent 1100 HPLC system equipped with a ZORBAX 300SB-C18 PrepHT column. The gradient mobile phase was a mixture of H2O (0.05% TFA) and acetonitrile (0.05% TFA). The nanoglobular MRI contrast agents were characterized by size exclusion chromatography (SEC) on an AKTA FPLC system with a Superose 12 column (Amersham Biosciences Corp., Piscataway, NJ), calibrated with poly[N-(2-hydroxypropyl)methacrylamide] standards.
Nanoglobular MRI Contrast Agents
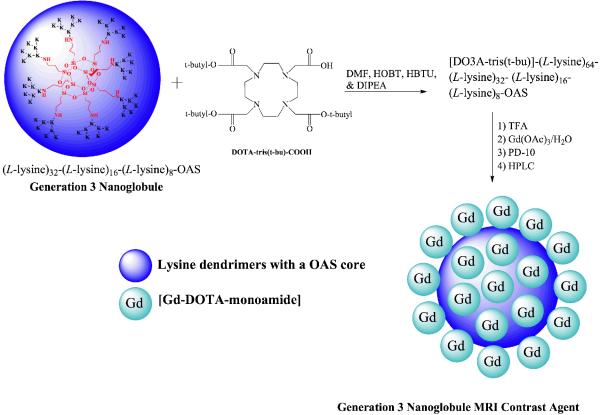
The synthesis and characterization of generations 1-3 (G1-G3) nanoglobules, polylysine dendrimers with an octa(3-aminopropyl)silsesquioxane core, were previously described (20). G1 through G3 (Gd-DOTA-monoamide)-polylysine OAS dendrimers, nanoglobule MRI contrast agents, were synthesized using standard liquid-phase peptide synthesis chemistry, Scheme 1. (L-Lysine)8-OAS (G1) trifluoroacetate (0.0185 mmol), HBTU (1.5 mmol), HOBt (1.5 mmol), and DOTA-tris(t-Bu) (0.52 mmol) were dissolved in DMF (50 ml) and stirred at room temperature for 2 days. The reaction solution was precipitated out in anhydrous diethyl ether. The precipitate, which contained crude (DOTA-tris(t-Bu)-monoamide)-polylysine OAS G1 dendrimers and un-conjugated DOTA-tris(t-Bu) was washed several times. The protective t-butyl groups were removed by dissolving the precipitate in a large excess of trifluoroacetic acid (~5.5 ml) for 18 hours while stirring at room temperature. The residue was treated with ice-cold diethyl ether to give a colorless solid precipitate. (DOTA-monoamide)-polylysine OAS G1 dendrimers were further purified by HPLC to separate low molecular weight species, such as un-conjugated DOTA ligands. Yield of pure (DOTA-monoamide)-polylysine OAS G1 dendrimers was 35.0 %, which was calculated from G1 starting material. Complexation was achieved by reacting (DOTA-monoamide)-dendrimer conjugates (6.5 μmol) with Gd(OAc)3 (0.30 mmol) in deionized water (10 ml) and stirring for 3 days at room temperature. Free Gd3+ ions were removed from the reaction solution by adding EDTA (0.5 g) and later eluting the solution through a PD-10 desalting column with deionized water. The absence of free Gd3+ was verified by performing a xylenol orange test at pH ~ 6. Pure G1 (Gd-DOTA-monoamide)-polylysine OAS MRI contrast agent was obtained after HPLC purification (yield: 15.1%). G2 (15.5% yield) and G3 (18.8% yield) (Gd-DOTA-monoamide)-polylysine OAS MRI contrast agents were prepared from (L-Lysine)16-(L-Lysine)8-OAS trifluoroacetate and (L-Lysine)32-(L-Lysine)16-(L-Lysine)8-OAS trifluoroacetate, respectively, using similar protocols.
Scheme 1.
Synthesis of G3 nanoglobular MRI contrast agents. K denotes a lysine residue.
The Gd(III) content was measured by inductively coupled plasma-optical emission spectroscopy (ICP-OES Optima 3100XL, Perkin Elmer, Norwalk, CT). The number of Gd(III) chelates conjugated to the nanoglobular surface and the molecular weight (MW) of the nanoglobular contrast agents were also estimated from the Gd(III) content. The particle size was determined in water (10 mg/ml) by dynamic light scattering (DLS).
Relaxation Time Measurements
Longitudinal relaxivity (r1) was determined by measuring the water proton T1 relaxation times of three different concentrations of G1-G3 nanoglobular MRI contrast agents with water as a reference. Measurements were acquired on a Siemens Trio 3T MRI Scanner at room temperature using an inversion recovery prepared turbo spin echo imaging pulse sequence. The inversion times (TI) were 25, 35, 50, 75, 100, 200, 400, 800, 1600 and 3200 ms with TR = 5000 ms and TE = 16.0 ms. The net magnetization amplitude data from the region of interest of each sample were fit using a Marquardt-Liebenberg algorithm for multiparametric nonlinear regression analysis. T1 and M0 were calculated from these data and r1 was determined from the slope of 1/T1 vs. [Gd3+] plot. Transverse relaxivity (r2) was determined by measuring the T2 relaxation times for four different concentrations of G1-G3, as well as a water reference on a Siemens Trio 3T MRI scanner at room temperature using a turbo spin echo sequence with turbo factor 3. The parameters were as follows: TE = 25, 37, 49, 61, 74, 86, 98 and 110; TR = 3000 ms. T2 values were calculated on a semi-log plot of the net magnetization amplitude data from the region of interest. Relaxivity r2 was determined from the slope of 1/T2 vs. [Gd3+] plot.
Animal Model
The human breast carcinoma cell line MDA-MB-231 was purchased from the American Type Culture Collection (ATCC, Manassas, VA, USA) and cultured in LH-15 media supplemented with 2 M glutamine and 10% FBS in 5% CO2. Female athymic nu/nu mice (6 weeks old) were purchased from the National Cancer Institute (Frederick, MD, USA). The mice were cared for according to the guidelines of the IACUC of the University of Utah. The mice were subcutaneously implanted in the both flanks with 2 × 10⁶ MDA-MB-231 cells in 50 μl of culture media mixed with 50 μl of BD® Matrigel. MRA and tumor imaging studies were performed at an average tumor size of 400 ± 100 mm3.
Contrast Enhanced MRI in Tumor Bearing Mice
Contrast enhanced MRI was performed on female nu/nu athymic mice bearing MDA-MB-231 human breast carcinoma xenografts. Groups of three mice each were used to evaluate contrast enhancement efficacy for each contrast agent. The mice were anesthetized with an I.P. injection of a mixture of 12 mg/kg xylazine and 80 mg/kg ketamine. G1-G3 nanoglobular MRI contrast agents were administered via tail vein at a dose of 0.03 and 0.01 mmol-Gd/kg. The mice were placed in a human wrist coil and scanned in a Siemens Trio 3T MRI scanner at pre-injection and at 2, 5, 10, 15, 30 and 60 min post-injection using a fat suppression 3D FLASH sequence (TR=7.8 ms, TE=2.74 ms, 25° flip angle, 0.5 mm slice thickness). Axial tumor MR images were also acquired using a 2D spin-echo sequence (TR=400 ms, TE=8.9 ms, 90° flip angle, 2.0 mm slice thickness).
In vivo contrast enhancement of the blood pool was analyzed using Osirix software. Contrast to noise ratios (CNR) were measured (non-blinded) at each time point and averaged from three different mice for the heart. The CNR was calculated using the following equation: ; where S (post-injection) and S0 (pre-injection) denote the signal within the regions of interest (ROIs) and σn is the standard deviation of noise estimated from the background air; ROI area was approximately 0.164 cm2 (95 pxls). The pharmacokinetics was evaluated semi-quantitatively by plotting the CNR within the blood vs. time. Tumor contrast enhancement was measured and expressed as an enhancement ratio (ER) that was defined by the following equation: , where Stumor and Smuscle denote the signal within the tumor and thigh muscle, respectively. ROI area was approximately 0.230 cm2 (556 pxls). Statistical analysis was performed using a two-way ANOVA with Bonferroni’s, assuming statistical significance at p < 0.05.
Results
Contrast agents
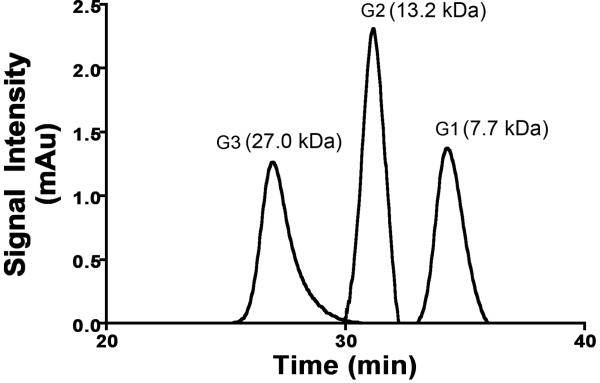
We have designed and prepared rigid globular (Gd-DOTA-monoamide)-poly-L-lysine dendrimers with a cubic octa(3-aminopropyl)silsesquioxane (OAS) core up to G3 as nanoglobular MRI contrast agents (CAs). The preparation pathway is shown in Scheme 1. Nanoglobular MRI CAs were prepared by reacting globular lysine dendrimers G1-G3 with 80% excess of DOTA-tris(t-Bu), followed by the deprotection and complexation with Gd(OAc)3 in water. Size exclusion chromatography (SEC) was used to separate low molecular weight impurities before and after addition of Gd3+ ions. The nanoglobular MRI contrast agents possessed narrow size distribution as shown by size exclusion chromatography, Figure 1. The physicochemical properties of the contrast agents are listed in Table 1. Approximately 62-76% of the surface amine groups of the nanoglobules were conjugated with Gd-DOTA-monoamide with only 80% excess of DOTA-tris-(t-Bu) in the conjugation reaction. Full saturation or higher conjugation degree could be achieved at nanoglobular surface if a larger excess of DOTA-tris-(t-Bu) was used in the reaction (20,22,23). The molecular weights estimated from the Gd(III) content were slightly greater than the apparent molecular weights measured by SEC. The nanoglobular contrast agents showed size dependent T1 relaxivity (r1) and T2 relaxivity (r2) at 3T. The relaxivities of the G3 agent were similar to those of other high generation dendrimeric Gd-DOTA-monoamide conjugates at the same magnetic field strength (24,25).
Figure 1.
Size exclusion chromatogram of the G1, G2 and G3 nanoglobular MRI contrast agents.
Table 1.
Physicochemical properties of the nanoglobular MRI contrast agents
| Contrast Agents |
Gd content (mmol-Gd/g polymer |
# Gd-DOTA monoamide chelates |
Molecular weight by ICP-OES |
Apparent MW by SEC |
Particle Size by DLS (nm) |
r1/r2 (mM−1sec−1) at 3T |
|---|---|---|---|---|---|---|
| G1 | 0.97 | 11/16 (69%) | 7.3 kDa | 7.7 kDa | ~2.0 | 6.4/9.5 |
| G2 | 0.93 | 20/32 (62%) | 14.8 kDa | 13.2 kDa | ~2.4 | 7.2/9.8 |
| G3 | 1.01 | 47/64 (76%) | 34.7 kDa | 27.0 kDa | ~3.2 | 10/16.4 |
In vivo MRI Contrast Enhancement
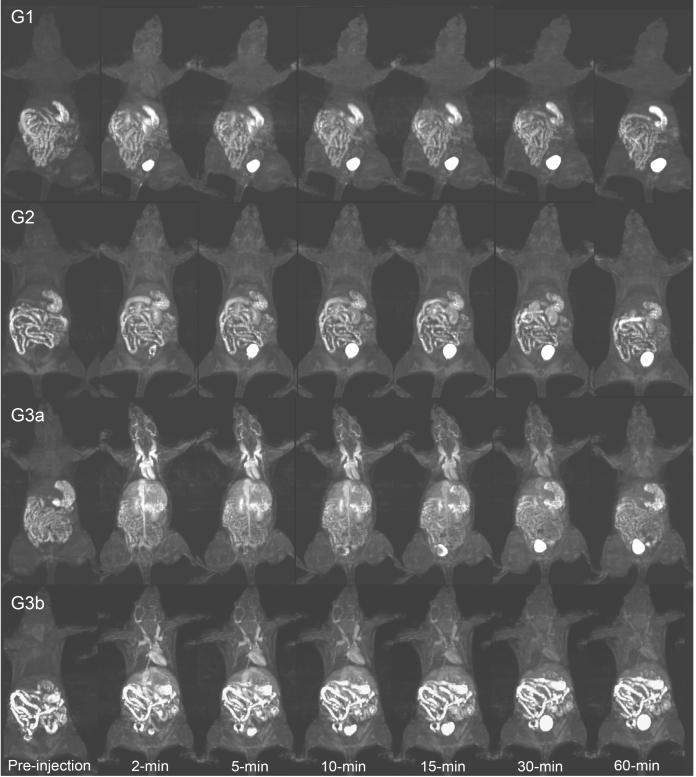
Three agents (G1-G3) and two doses of G3 (G3a and G3b) were investigated for vascular contrast enhancement and size-dependant pharmacokinetics in female nu/nu athymic mice (N=3) bearing MDA-MB-231 human breast carcinoma xenografts. Figure 2 shows the dynamic 3D maximum intensity projection (MIP) images of mice injected with the G1-G3 nanoglobular CAs at 0.03 mmol-Gd/kg (G1-G3a) and G3 nanoglobular CAs at 0.01 mmol-Gd/kg (G3b). The nanoglobular agents showed size-dependent vascular enhancement. The majority of G1 and G2 agents rapidly cleared via renal filtration and showed little contrast enhancement in the heart and vasculature, whereas the larger G3 agent was retained longer within the vasculature, then gradually excreted via renal clearance. Consequently, strong and prolonged enhancement was observed with the G3 agent for at least 30-min post-injection in the heart and vasculature. Strong bladder enhancement was observed for the G1 and G2 agents as early as two minutes post-injection, while bladder enhancement was observed for the G3 agent at 10 minutes post-injection, indicating a size-dependent renal clearance of the agents. The G3 nanoglobular MRI CA also resulted in greater and prolonged vascular enhancement at a low dose of 0.01 mmol-Gd/kg—1/10th of the regular clinical dose—as compared to G1 and G2 nanoglobular agent at 0.03 mmol-Gd/kg.
Figure 2.
3D maximum intensity projection images for the G1, G2 and G3 (G3a) nanoglobular MRI contrast agents administered at 0.03 mmol-Gd/kg and the G3 agent administered at 0.01 mmol-Gd/kg (G3b) in nu/nu female nude mice. Fat suppression 3D FLASH sequence (TR=7.8 ms, TE=2.74 ms, 25° flip angle, 0.5 mm slice thickness).
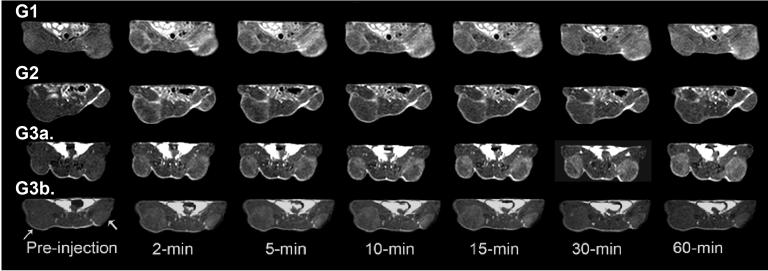
Figure 3 shows the axial 2D spin echo tumor images for G1-G3 agents dosed at 0.03 mmol-Gd/kg (G1-G3a) and the G3 agent dosed at 0.01 mmol-Gd/kg (G3b). G3 nanoglobular MRI CA at 0.03 mmol-Gd/kg resulted in greater and more confined enhancement within the tumor tissues than the G1 and G2 agents. Significant tumor enhancement was also observed for the G3 agent at a dose of 0.01 mmol-Gd/kg. The enhancement from the G3 agent appeared to be more specific and confined within the tumor tissue as compared to G1 and G2 nanoglobular agents, which produced non-specific contrast enhancement in the surrounding normal tissue/muscle. Similar to blood pool contrast enhancement, the increase in tumor contrast enhancement slowly decayed over time for all conjugates.
Figure 3.
2D axial images of tumor xenografts of the G1, G2 and G3 (G3a) nanoglobular MRI contrast agents administered at 0.03 mmol-Gd/kg and the G3 agent administered at 0.01 mmol-Gd/kg (G3b) in nu/nu female nude mice. Axial tumor MR images acquired using a 2D spin-echo sequence (TR=400 ms, TE=8.9 ms, 90° flip angle, 2.0 mm slice thickness). Arrows indicate tumor.
Size-dependent Contrast Enhancement and Pharmacokinetics
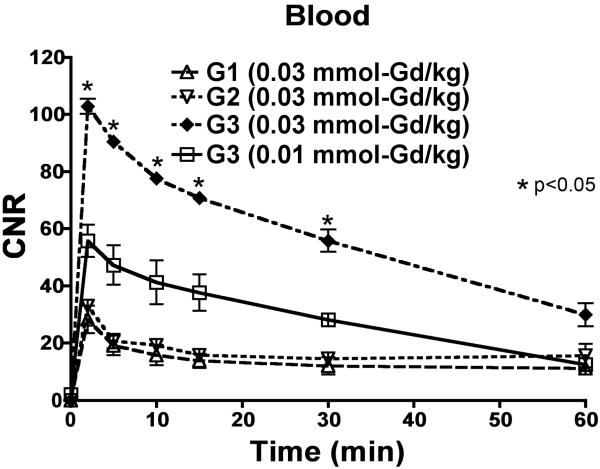
The nanoglobular MRI CAs showed size-dependant contrast-to-noise ratios (CNR) and pharmacokinetic profiles that paralleled the contrast enhancement observed in the 3D MIP images. Larger nanoglobular MRI contrast agents exhibited greater CNR. Figure 4 shows the measured CNR profiles of blood in the heart at pre-injection until 60-min post-injection for all CAs administered at 0.03 mmol-Gd/kg and 0.01 mmol-Gd/kg. There was a significant increase in CNR within the blood at 2-min post-injection for all conjugates, which gradually decayed over time. G3 nanoglobular MRI CAs showed significantly greater and prolonged CNR within blood at both doses as compared to lower generation nanoglobules (p < 0.05). The G1 and G2 nanoglobular MRI CAs had a similar CNR profile in the blood.
Figure 4.
Contrast-to-noise ratio of the blood with the G1, G2 and G3 (G3a) nanoglobular MRI contrast agents administered at 0.03 mmol-Gd/kg and the G3 agent administered at 0.01 mmol-Gd/kg (G3b) in nu/nu female nude mice.
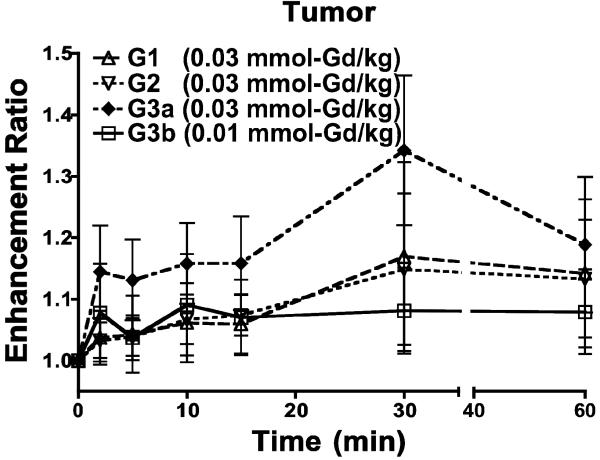
Figure 5 shows the enhancement ratio in the tumor tissue (the ratio of signal intensity after contrast to that before contrast) up to 60-min post-injection. Signal intensity measurements within the tumor tissue revealed that the G3 nanoglobular agent at 0.03 mmol-Gd/kg resulted in a greater enhancement ratio than G1 and G2. The G3 agent also resulted in approximately 10% signal increase at 0.01 mmol-Gd/kg. No significant difference was observed between the enhancement ratios of different nanoglobular MRI CAs. Nonetheless, a greater enhancement ratio trend was observed for higher generation nanoglobular MRI CAs dosed at 0.03 mmol-Gd/kg.
Figure 5.
Tumor enhancement ratio of the G1, G2 and G3 (G3a) nanoglobular MRI contrast agents administered at 0.03 mmol-Gd/kg and the G3 agent administered at 0.01 mmol-Gd/kg (G3b) in nu/nu female nude mice.
Discussion
MRA CAs should have a sufficiently long blood circulation for effective diagnostic imaging and be rapidly excreted from the body to avoid accumulation. Prolonged retention of macromolecular CA may increase the likelihood of Gd3+ release and cause toxic side effects. Macromolecular Gd(III) complexes provide effective contrast enhancement for MRA, but cannot be rapidly excreted after imaging. Low molecular weight CAs clear too fast from the vasculature for MRA, which leads to higher administered doses to obtain adequate images. Previously, we designed and developed polydisulfide Gd(III) complexes as biodegradable macromolecular MRI CAs to control the pharmacokinetics (26). The biodegradable macromolecular CAs initially behave as high molecular weight agents for effective vascular imaging, then gradually degrade in plasma into smaller complexes, which excrete rapidly via renal filtration with minimal tissue accumulation (27). In this study, we designed nanoglobular Gd(III) chelates with precisely defined nanosizes and a globular morphology to achieve both effective contrast enhanced MRA and the necessary safety profile by balancing size-dependent plasma pharmacokinetics and renal filtration rate.
We successfully synthesized and designed compact and globular MRI CAs with well-defined nanosizes. Stable Gd(III) chelates, Gd-DOTA-monoamide, were conjugated on the surface of the nanoglobules with a relatively high conjugation efficiency. Size exclusion chromatography showed that the narrow size distribution of the nanoglobular MRI CAs was similar to that of globular proteins (PDI of approximately 1.01 for each MRI CA), which validated the precisely controlled size of the nanoglobular CAs. Dynamic light scattering measurements showed that all agents had a particle size less than the renal threshold (4.7 nm) (28). The T1 relaxivity increased with agent size due to a greater rotational correlation time that is inherent with larger molecules (29).
The nanoglobular Gd(III) chelates showed size-dependent vascular enhancement in both the 3D MIP images and CNR analysis. The G1 and G2 agents did not provide effective vascular enhancement at 0.03 mmol-Gd/kg. These agents had much smaller sizes (< 2.5 nm) than the kidney filtration threshold and excreted rapidly via renal filtration. Strong and prolonged vascular enhancement was observed for the G3 agent at 0.03 and 0.01 mmol-Gd/kg. This property was attributed to its higher relaxivity and a size that was slightly smaller than the renal filtration threshold. The G3 agent administered at 0.03 mmol-Gd/kg had a similar vascular enhancement profile and half-life as compared to a G6 PAMAM Gd-DOTA-monoamide conjugate that we reported previously (24). The G3 agent also showed much less non-specific liver enhancement than the G6 PAMAM conjugate (24). As shown in the 3D dynamic images, the G3 agent could still excrete via renal filtration, but at a relatively slow rate, which is validated by the gradually increased signal intensity within the urinary bladder. The precisely controlled sizes of the nanoglobular contrast agents provide effective control of size-dependent pharmacokinetics and excretion of the agents. The G3 agent with a size slightly smaller than the renal filtration threshold provided effective prolonged vascular enhancement and could be readily excreted via renal filtration.
The nanoglobular CAs also resulted in significant tumor tissue enhancement. It appeared that the G1 and G2 agents not only enhanced the tumor tissues, but also the surrounding tissue/muscle. This might explain why a lower tumor enhancement ratio was observed for both the G1 and G2 agents than the G3 agent at the same dose. The G3 agent was more effective for contrast enhanced tumor imaging at both doses than the smaller G1 and G2 agents. The strong tumor enhancement of the G3 agent is attributed to the less extravasation into surrounding tissue/muscle due to its greater hydrodynamic volume and high density of angiogenic microvessels in the tumor tissue.
From this preliminary evaluation of nanoglobular MRI CAs, a compact and globular morphology and well-defined size may be advantageous for size-dependant vascular enhancement kinetics, effective tumor imaging and renal filtration. Linear macromolecular CA are polymeric mixtures of different sizes, have a flexible morphology and exhibit inconsistent size-dependant pharmacokinetics. Linear macromolecules have a higher degree of deformability; therefore, they are more permeable through the glomerular capillary wall than globular proteins with similar hydrodynamic volume (28). The kidneys do not readily pass globular plasma proteins larger than the renal threshold. Based upon this principle, we showed that the vascular enhancement kinetics and renal filtration rate of globular MRI CAs with well-defined nanostructures could be effectively tuned by their sizes.
The nanoglobular CAs may be advantageous over PAMAM-based contrast agents, even though both series of agents have well-defined sizes. PAMAM dendrimers are still relatively flexible (16, 19) and their inner spheres are cationic at physiological pH, which may result in lowered vascular enhancement due to non-specific tissue uptake by the liver (24, 30). For example, G4-(1B4M-Gd)64-PAMAM agents produced significant vascular enhancement at 2 min post-injection, but vascular and liver enhancement become similar at 10 min post-injection (30). High liver accumulation has also been reported for other dendrimeric Gd(III) chelates with positively charged inner spheres (30). In contrast, the nanoglobular CAs have neutral inner spheres and the Gd-DOTA-monoamide chelates are effectively neutral after complexation with Gd3+ ions, which may minimize liver uptake. The nanoglobular MRI CA also have relatively rigid structures because of their three-dimensional geometry. The rigid globular morphology may minimize the non-specific tissue interaction of the nanoglobular agents, thus prolonging circulation within the vasculature. Due to minimal non-specific tissue uptake and limited vascular extravasation, the G3 nanoglobular CA was able to provide significant vascular and tumor enhancement at a substantially reduced dose of 0.01 mmol-Gd/kg—1/10th of the regular dose of most clinical CAs. Effective enhancement at the substantially low dose will greatly reduce the dose related toxicity of Gd(III)-based MRI CAs.
This is the first investigation of globular MRI CAs with precisely defined compact structures. Further studies are needed to improve the conjugation of Gd-DOTA-monoamide to the nanoglobule surface, such as using a larger excess of DOTA-tris(t-Bu) during the conjugation reaction, or synthesizing nanoglobules with equal arms. The α-amino group has a shorter spacer than the ε-amino group in the lysine residues and may become sterically hindered for the conjugation of relatively large DOTA-tris(t-Bu). Greater conjugation efficiency of DOTA-tris(t-Bu) may be achieved if both amino groups have equal spacers. Although the liver enhancement was relatively low, complete conjugation of the free amino groups may further reduce non-specific tissue interactions. Nonetheless, these nanoglobular CAs, particularly the G3 agent, may hold a great promise for effective contrast enhanced MRA at significantly reduced doses. They are also promising for MR imaging of tumor angiogenesis based on high tumor vascularity (31-34) and to non-invasively evaluate tumor response to various therapies including anti-angiogenesis therapy. The precisely defined size of the nanoglobular CAs may reduce the variability associated with linear polymeric CAs with broad size distributions.
Conclusions
We designed and synthesized nanoglobular MRI CAs of compact globular morphology and well-defined nanosizes. These agents had a relatively high load of a stable Gd(III)-chelate, Gd-DOTA-monoamide, on their globular surface. They showed size-dependent contrast enhancement and pharmacokinetics, and were readily excreted through renal filtration. The G3 nanoglobular agent, which had a particle diameter slightly smaller than the renal filtration threshold, resulted in significant vascular and tumor contrast enhancement at only 1/10th of the regular clinical dose of most Gd(III)-based MRI contrast agents. Effective enhancement at the lower dose may reduce the dose-related toxic side effects of Gd(III)-based MRI contrast agents. These agents, particularly the G3 agent, are promising for further preclinical development as intravascular contrast agents for MRA and tumor angiogenesis imaging.
Acknowledgements
This research was supported in part by the NIH R01 CA097465. We greatly appreciate Dr. Yongen Sun and Ms. Melody Johnson for their technical assistance in animal handling and MRI data acquisition.
Abbreviations
- ANOVA
analysis of variance
- CA
contrast agent
- CE-MRI
contrast enhanced magnetic resonance imaging
- CNR
contrast-to-noise ratio
- DIPEA
diisopropylethyleneamine
- DOTA-tris(t-Bu)
1,4,7,10-tetraazacyclododecane-1,4,7-tris-tert-butyl acetate-10-acetic acid
- DLS
dynamic light scattering
- DMF
dimethylformamide
- Gd-DOTA-monoamide
gadolinium(III)-1,4,7,10-tetraazacyclododecane-1,4,7,10-tetraacetic monoamide acid
- G1
generation 1
- G2
generation 2
- G3
generation 3
- ICP-OES
inductively coupled plasma-optical emission spectroscopy
- NSF
nephrogenic systemic fibrosis
- MALDI-TOF
matrix assisted laser desorption ionization-time of flight
- MIP
maximum intensity projection
- Mw
molecular weight
- MRA
magnetic resonance angiography
- MRI
magnetic resonance imaging
- OAS
octa(3-aminopropyl)silsesquioxane
- SEC
size exclusion chromatography
- TFA
trifluoroacetic acid
References
- 1.Paetsch I, Gebker R, Fleck E, Nagel E. J Interven Cardiol. 2003;16:457–463. doi: 10.1046/j.1540-8183.2003.01063.x. [DOI] [PubMed] [Google Scholar]
- 2.Sadowski E, Bennett L, Chan MR, Wentland AL, Garrett AL, Garrett RW, Djamali A. Radiology. 2007;243:148–157. doi: 10.1148/radiol.2431062144. [DOI] [PubMed] [Google Scholar]
- 3.Grobner T, Prischl FC. Kidney Int. 2007;72:260–264. doi: 10.1038/sj.ki.5002338. [DOI] [PubMed] [Google Scholar]
- 4.Saab G, Cheng S. Hemodialysis Int. 2007;11:S2–S6. doi: 10.1111/j.1542-4758.2007.00222.x. [DOI] [PubMed] [Google Scholar]
- 5.Fu Y, Raatschen H-J, Nitecki DE, Wendland MF, Novikov V, Fournier LS, Cyran C, Rogut V, Shams DM, Brasch RC. Biomacromolecules. 2007;8:1519–1529. doi: 10.1021/bm061141h. [DOI] [PubMed] [Google Scholar]
- 6.Mohs AM, Wang X, Goodrich KC, Zong Y, Parker DL, Lu Z-R. Biomacromolecules. 2004;15:1424–1430. doi: 10.1021/bc049828r. [DOI] [PubMed] [Google Scholar]
- 7.Lin W, Abendschein DR, Celi A, Dolan RP, Lauffer RB, Walovitch RC, Haacke EM. J Magn Reson Imaging. 1997;7:963–971. doi: 10.1002/jmri.1880070605. [DOI] [PubMed] [Google Scholar]
- 8.Ladd DL, Hollister R, Peng X, Wei D, Wu G, Delecki D, Snow RA, Toner JL, Kellar K, Eck J, Desai VC, Raymond G, Kinter LB, Desser TS, Rubin DL. Bioconjugate Chem. 1999;10:361–70. doi: 10.1021/bc980086+. [DOI] [PubMed] [Google Scholar]
- 9.Wang Y, Ye F, Jeong EK, Sun Y, Parker DL, Lu ZR. Pharm Res. 2007;24:1208–1216. doi: 10.1007/s11095-007-9252-1. [DOI] [PubMed] [Google Scholar]
- 10.Langereis S, Lussanet QGD, Genderen MHP, Backes WH, Meijer WE. Macromolecules. 2004;37:3084–3091. [Google Scholar]
- 11.Schuhmann-Giampieri G, Schmitt-Willich H, Franzel T, Press WR, Weinmann HJ. Invest Radiol. 1991;26:969–974. doi: 10.1097/00004424-199111000-00008. [DOI] [PubMed] [Google Scholar]
- 12.Duncan R. Pharm Sci Technol To. 1999;2:441–449. doi: 10.1016/s1461-5347(99)00211-4. [DOI] [PubMed] [Google Scholar]
- 13.Toth E, Helm L, Kellar KE, Merbach AE. Chem Eur J. 1999;5:1202–1211. [Google Scholar]
- 14.Rebizak R, Schaefer M, Dellacherie E. Eur J Pharm Sci. 1998;7:243–248. doi: 10.1016/s0928-0987(98)00027-x. [DOI] [PubMed] [Google Scholar]
- 15.Rodríguez-Hernández J, Gatti M, Klok Harm-Anton. Biomacromolecules. 2003;4:249–258. doi: 10.1021/bm020096k. [DOI] [PubMed] [Google Scholar]
- 16.Kobayashi H, Kawamoto S, Jo S-K, Bryant HL, Jr, Brechbiel MW, Star RA. Bioconju Chem. 2003;14:388–394. doi: 10.1021/bc025633c. [DOI] [PubMed] [Google Scholar]
- 17.Langereis S, de Lussanet QG, van Genderen MH, Beets-Tan RG, Griffloen AW, van Engelshoven JM, Backes WH. NMR Biomed. 2006;19:133–141. doi: 10.1002/nbm.1015. [DOI] [PubMed] [Google Scholar]
- 18.Sato N, Kobayashi H, Hiraga A, Saga T, Togashi K, Konishi J, Brechbiel MW. Magn. Reson. Med. 2001;46:1169–1173. doi: 10.1002/mrm.1314. [DOI] [PubMed] [Google Scholar]
- 19.Kobayashi H, Sato N, Kawamoto S, Saga T, Hiraga A, Laz Haque T, Ishimori T, Konishi J, Togashi K, Brechbiel MW. Bioconjugate Chem. 2001;12:100–107. doi: 10.1021/bc000075s. [DOI] [PubMed] [Google Scholar]
- 20.Kaneshiro TL, Wang X, Lu Z-R. Mol Pharm. 2001;4:759–768. doi: 10.1021/mp070036z. [DOI] [PubMed] [Google Scholar]
- 21.Zhang X, Haxton KJ, Ropartz L, Cole-Hamilton DJ, Morris RE. J Chem Soc. Dalton. Trans. 2001:3261. [Google Scholar]
- 22.Rudovsky J, Botta M, Hermann P, Hardcastle KI, Lukes I, Aime S. Bioconjugate Chem. 2006;17:975–987. doi: 10.1021/bc060149l. [DOI] [PubMed] [Google Scholar]
- 23.Venditto VJ, Regino CAS, Brechbiel MW. Mol Pharm. 2005;2:302–311. doi: 10.1021/mp050019e. [DOI] [PubMed] [Google Scholar]
- 24.Xu R, Wang Y, Wang X, Jeong EK, Parker DL, Lu Z-R. Exp Biol Med. 2007;232:1081–1089. doi: 10.3181/0702-RM-33. [DOI] [PubMed] [Google Scholar]
- 25.Laus S, Sour A, Ruloff R, Tóth E, Merbach AE. Chemistry. 2005;11:3064–76. doi: 10.1002/chem.200401326. [DOI] [PubMed] [Google Scholar]
- 26.Lu Z-R, Mohs AM, Zong Y, Feng Y. Intl J Nanomed. 2006;1:31–40. doi: 10.2147/nano.2006.1.1.31. [DOI] [PMC free article] [PubMed] [Google Scholar]
- 27.Feng Y, Zong Y, Ke T, Lu Z-R. Pharm Res. 2006;23:1736–1742. doi: 10.1007/s11095-006-9028-z. [DOI] [PubMed] [Google Scholar]
- 28.Asgeirsson D, Venturoli D, Rippe B, Rippe C. Am J Physiol Renal Physiol. 2006;291:1083–1089. doi: 10.1152/ajprenal.00488.2005. [DOI] [PubMed] [Google Scholar]
- 29.Wiener EC, Auteri FP, Chen JW, Brechbiel MW, Gansow OA, Schneider DS, Belford RL, Clarkson RB, Lauterbur PC. J Am. Chem Soc. 1996;118:7774–7782. [Google Scholar]
- 30.Kobayashi H, Kawamoto S, Saga T, Sato N, Hiraga A, Ishimori T, Akita Y, Mamede M, Konishi J, Togashi K, Brechbiel M. Magn Reson Med. 2001;46:795–802. doi: 10.1002/mrm.1259. [DOI] [PubMed] [Google Scholar]
- 31.Kobayashi H, Sato N, Hirga A, Saga T, Nakamoto Y, Ueda H, Konishi J, Togashi K, Brechbiel M. Magn Reson Med. 2001;45:454–460. doi: 10.1002/1522-2594(200103)45:3<454::aid-mrm1060>3.0.co;2-m. [DOI] [PubMed] [Google Scholar]
- 32.Ivanusa T, Beravs K, Medic J, Sersa I, Sersa G, Jevtic, Demsar F, Mikac U. Physica Medica. 2007;23:85–90. doi: 10.1016/j.ejmp.2007.05.001. [DOI] [PubMed] [Google Scholar]
- 33.Fournier LS, Novikov V, Lucidi V, Fu Y, Miller T, Floyd E, Shames DM, Brasch RC. Radiology. 2007;243:105–111. doi: 10.1148/radiol.2431050658. [DOI] [PubMed] [Google Scholar]
- 34.Kobayashi H, Kawamoto S, Jo SK, Bryant HL, Jr., Brechbiel MW, Star RA. ADDR. 2005;57:2271–2286. [Google Scholar]


