

Abstract
Recent advances in genome research have enabled the identification of new genomic variations that are associated with type 2 diabetes mellitus (T2DM). Via fine mapping of SNPs in a candidate region of chromosome 21q, the current study identifies potassium inwardly-rectifying channel, subfamily J, member 15 (KCNJ15) as a new T2DM susceptibility gene. KCNJ15 is expressed in the β cell of the pancreas, and a synonymous SNP, rs3746876, in exon 4 (C566T) of this gene, with T allele frequency among control subjects of 3.1%, showed a significant association with T2DM affecting lean individuals in three independent Japanese sample sets (p = 2.5 × 10⁻⁷, odds ratio [OR] = 2.54, 95% confidence interval [CI] = 1.76–3.67) and with unstratified T2DM (p = 6.7 × 10⁻⁶, OR = 1.76, 95% CI = 1.37–2.25). The diabetes risk allele frequency was, however, very low among Europeans in whom no association between this variant and T2DM could be shown. Functional analysis in human embryonic kidney 293 cells demonstrated that the risk allele of the synonymous SNP in exon 4 increased KCNJ15 expression via increased mRNA stability, which resulted in the higher expression of protein as compared to that of the nonrisk allele. We also showed that KCNJ15 is expressed in human pancreatic β cells. In conclusion, we demonstrated a significant association between a synonymous variant in KCNJ15 and T2DM in lean Japanese patients with T2DM, suggesting that KCNJ15 is a previously unreported susceptibility gene for T2DM among Asians.
Introduction
Type 2 diabetes mellitus (T2DM [MIM 125853]) is recognized as one of the leading health problems throughout the developed world. There is some evidence that T2DM is also becoming increasingly common in the developing countries.1,2 Clinical studies have indicated that T2DM comprises heterogeneous phenotypes among the various ethnic groups. During the last 40 years, the prevalence of T2DM in Japan has increased dramatically, partially due to the biological implications of genetic risk factors being exposed to environmental changes including high-calorie diets and a sedentary lifestyle. Despite the rise in T2DM, it has been reported that Asian patients are still characterized by a lower body-mass index (BMI) and lower serum insulin levels than those in Mexican American or African American T2DM patients.3–5 Numerous studies have also revealed a striking difference in the average BMI of T2DM patients among different human populations: The UK Prospective Diabetes Study (UKPDS) reported a BMI of 29.4, whereas the Japan Diabetes Complications Study (JDCS) reported a BMI of 23.1.6,7 The average BMI of the primary sibling-pair set in the current study was 23.0 ± 3.0 (mean ± standard deviation [SD]).8 These results suggest that a lean Asian individual may have some unique risk susceptibility for developing diabetes mellitus.
We have previously identified suggestive evidence for linkage with T2DM in lean individuals (“lean T2DM”) in a region of chromosome 21q (ch21q). Upon examination of 116 T2DM families via affected-sibling-pair analysis, we showed a LOD score of 2.42.8 Recently, large-scale genome-wide association studies revealed several genetic variants to be responsible for T2DM,9–16 though no susceptibility gene on ch21q has been reported to date.
In the current study, we aimed to identify novel susceptibility genes for lean T2DM by follow-up examinations of our candidate region on ch21q. By applying SNP typing of this locus, we demonstrate a significant association between potassium inwardly-rectifying channel, subfamily J, member 15 (KCNJ15) and Asian T2DM. In addition, we evaluate the functional significance of this susceptibility gene in vitro.
Subjects and Methods
Subjects and Genomic DNA
T2DM patients were recruited at the Diabetes Center of Tokyo Women's Medical University. The diagnosis of T2DM was made on the basis of the 1985 World Health Organization criteria.17 We excluded diabetic patients who required insulin therapy within 2 yrs of diagnosis. Glutamic acid decarboxylase (GAD)-antibody-positive patients (including those whose first-degree relative was GAD-antibody positive) and patients with maturity-onset diabetes of the young were also excluded. The clinical features of the diabetic subjects were obtained by medical interview at the time of blood sampling and inspection of medical records. The first sample set was composed of 149 T2DM cases for the pooled sample and individual typing, 96 lean cases out of 149 cases for the pooled sample only, and 200 healthy controls for the pooled sample, individual typing, and variation screening (Table S1, available online). The case samples were selected from the affected sibling pairs used in the previous linkage analysis.8 We assembled two independent subject panels for replication. Replication A consisted of 419 cases and 500 healthy controls, and replication B consisted of 1000 cases and 1000 healthy controls. All participants gave written, informed consent, and the study was approved in advance by the research ethics committees of the Graduate School of Medicine, The University of Tokyo, and Tokyo Women's Medical University. In our previous study, we made BMI subsets from lean cutoff values of 20, 21, 22, 23, 24, 25, or 27 kg/m2. The LOD score was highest in the leanest family, whose BMI was less than 24. The purpose of this study was for following up on the initial study, so we used the same threshold (BMI 24). A lean case was defined as an individual with a BMI less than 24 at the time of blood sampling. Lifelong lean cases were defined as having a maximal BMI below 24 for the follow-up period. The KCNJ15 rs3746876 variant was genotyped in 9574 Danish individuals, including three different study groups. One was the group from the Inter99 study (ClinicalTrials.gov ID no.: NCT00289237), which is a population-based intervention study for prevention of cardiovascular disorders. In the present study, a sample of 5784 treatment-naive individuals who had undergone an oral glucose tolerance test (OGTT) were included for genetic studies. According to their response to OGTT, the people could be categorized as subjects with normal glucose tolerance (n = 4381), impaired fasting glycemia (n = 489), impaired glucose tolerance (n = 669), or screen-detected and treatment-naive type 2 diabetes (n = 245). Another study group was made up of the type 2 diabetes cases (n = 1658) and glucose-tolerant control individuals (n = 504) ascertained at Steno Diabetes Center. The final study group was made up of screen-detected T2DM patients from the Danish ADDITION study (ClinicalTrials.gov ID no.: NCT00237548) (n = 1551). Type 2 diabetes case-control studies included all healthy glucose-tolerant subjects obtained from the Inter99 cohort (n = 4381) and ones from Steno Diabetes Center (n = 504), as well as type 2 diabetes cases obtained from Steno Diabetes Center (n = 1658), the ADDITION study (n = 1551), and the Inter99 study (n = 322; made up of 117 patients with known type 2 diabetes and 245 with screen-detected type 2 diabetes). Clinical characteristics (mean ± SD) of the cases are as follows: age 60.4 ± 9.7 years, BMI 30.7 ± 5.5 kg/m2, HbA1c 7.0 ± 1.6%, age at diagnosis for clinical-onset cases 52.3 ± 11.0 yrs. Clinical characteristics (mean ± SD) of the controls are as follows: age 46.4 ± 8.8 yrs, BMI 25.5 ± 4.1 kg/m2. Quantitative association studies of intermediary diabetes-related traits were performed in the population-based Inter99 cohort, excluding individuals with previously diagnosed and treated type 2 diabetes. All participants provided written informed consent, and the protocol was approved by the ethics committee of each participating institution.
Estimation of Allele Frequency in Screening and Genotyping
The estimation of allele frequency for each SNP was performed via capillary electrophoresis single-strand conformation polymorphism (CE-SSCP) analysis as previously reported.18 Pooled DNA aliquot from each sample was adjusted to a final concentration of 10 ng/ml, as previously described. Primer sequence, annealing temperature, and SSCP temperature are shown in Table S2. Variation screening and target polymorphisms in the screening study were genotyped via direct sequencing (Table S3). In the replication study, polymorphisms were genotyped via TagMan allelic discrimination (KBiosciences).
RNA Isolation and Real-Time PCR from Peripheral Blood, Cell Line, and Human Langerhans Islet
Total RNA was isolated from peripheral-blood mononuclear cells (PMNCs) of healthy volunteers with the use of a PAXgene Blood RNA Kit (QIAGEN). In accordance with instructions from laboratory manuals of deoxyribonuclease (100 ng) treatment, oligo (dT) reverse-transcription reactions were performed. Quantitative real-time PCR (Q-PCR) was performed with SYBR Green PCR Master Mix (Applied BioSystems). Normalization of the relative expression of the genes of interest to the β-actin gene was performed. Q-PCR primer sequences are shown in Table S4.
RNA Differential Plot Analysis
RNA differential plot (RDP) analysis was performed as previously described.19 In brief, the PCR products were labeled with the fluorescent dye 6-FAM with the use of the specific primers 5′-ATGACCTGGTTCCTTTTTGG-3′ and 6FAM-5′-GGGTTCTAAGTCCCCATGAA-3′. Capillary electrophoresis was carried out, and the signal intensity of the polymorphic or mutated fragments was analyzed with the software program GeneMapper Analysis (Applied BioSystems). The expression ratio was calculated by dividing the RNA ratio by the genomic DNA ratio.
Immunofluorescence Staining
Human tissue was provided from the Human Tissues & Biofluids Bank (Asterand). The tissue sample was surgically removed because of tumor-related pancreas disease. KCNJ15 and insulin immunofluorescence double staining was carried out with frozen sections. Frozen sections 5 μm in thickness were cut with cryotome and placed on slides. The frozen sections were then dried at room temperature and fixed with acetone for 10 min. The slides were washed with PBS three times and incubated with KCNJ15 antibody overnight and with insulin antibody for 1 hr (Santa Cruz Biotechnology). After being washed with PBS, the slides were incubated with Alexa488-conjugated secondary antibody, for KCNJ15, or with Alexa647-conjugated secondary antibody, for insulin (Invitrogen), for 40 min. After being washed with PBS, the sections were visualized with confocal microscopy (LSM 510 Meta NLO Imaging System, Carl Zeiss).
RNA-Stability Assay
For evaluation of RNA degradation in the simulated biological environment, the synthetic RNA from a KCNJ15-cloned vector was incubated with whole-cell extract. First, we amplified a PCR fragment that contained the entire coding region of KCNJ15 from each allele carrier (rs3746876: 566C and 566T) genomic DNA by using the specific primers 5′- GGGGACAAGTTTGTACAAAAAAGCAGGCTCTGCCGCCATGGATGCCATTCACATCG-3′ and 5′- GGGGACCACTTTGTACAAGAAAGCTGGGTCGACATTGCTCTGTTGTAATAAAAGTGT-3′. The amplified DNA fragments were inserted into the DONR221 vector and subsequently into the pcDNA3.1/nV5-DEST (Invitrogen) expression vector. KCNJ15 mRNA was expressed by the T7 promoter without cells and was purified according to the manufacturer's instructions (RiboMax Large-Scale RNA Production System-T7, Promega). We prepared whole-cell lysates of HEK 293 cells with extraction buffer (0.5% Nonidet P-40; 20 mM HEPES buffer, pH 8.0; 20% glycerol [v/v]; 400 mM NaCl; 0.5 mM dithiothreitol; 0.2 mM EDTA; and 1% protease-inhibitor cocktail). Diluted whole-cell extracts (1:500) were incubated with 5 μg of synthesized RNA at room temperature for 15 min. The reaction was stopped by the addition of formamide dye, and the samples were heated at 68°C for 5 min. RNAs were then detected via electrophoresis on a 2% agarose gel and stained with DynaMarker RNA Easy Measurement N (BioDynamics Laboratory). Gels were scanned with a CCD camera system (LAS-4000mini; Fuji Photo Film), and full-length RNA intensity was measured on a DocuCentre Color 500cp (Fuji-Xerox).
Immunoblotting and FACS Analysis of Recombinant KCNJ15 Protein in HEK 293 Cells
We examined the influence of rs3746876 (C566T) on protein expression by immunoblotting with membrane fraction and fluorescence-activated cell sorting (FACS) analysis with the whole cell. KCNJ15 was cloned into the pcDNA6.2/C-EmGFP-DEST vector (Invitrogen) and transfected into human embryonic kidney (HEK) 293T cells with Lipofectamine 2000 (Invitrogen) in 24-well plates. After 48 hr of incubation, the cells were washed with PBS (pH 7.4) and permeabilized with radioimmunoprecipitation assay buffer containing a protease-inhibitor cocktail. The membrane fraction was collected after centrifuging at 10,000 × g for 30 min, resuspended in permeabilization buffer, and solubilized with SDS-PAGE sample buffer containing 100 mM dithiothreitol and 2% SDS. To increase mobility, we incubated the membranes in the same sample buffer for at least 24 hr at room temperature, followed by heating at 50°C for 15 min, at 20°C for 30 min, and at 50°C for 15 min, as previously reported for an SDS-resistant inward rectifier.20 The lysates were separated on a 10%–20% gradient SDS-polyacrylamide gel. After proteins were transferred from the gel to a polyvinylidene fluoride membrane (Amersham Biosciences), Immunoblot analysis was performed with the use of 1:2000 diluted rabbit polyclonal green fluorescent protein (GFP) antibody (Medical & Biolocal Laboratories) and 1:100 diluted rabbit polyclonal E-cadherin antibody (Santa Cruz Biotechnology) for 1 hr at room temperature. Get Signal (Toyobo) was added to the antibody-dilution buffer to reduce background. Chemiluminescence was detected via ECL Plus (Amersham Biosciences) with a charge-coupled device (CCD) camera system. For FACS analysis, GFP fusion-KCNJ15 protein-expressing plasmid-transfected HEK 293 cells were treated with trypsin-EDTA for 5 min at 37°C, followed by vigorous pipetting to create a single-cell suspension. Cells were stringently washed and fixed in 2% paraformaldehyde, and fluorescence derived from GFP was detected by flow cytometry (BD LSR-II, BD Biosciences). Flow cytometry was performed at a 488 nm excitation wavelength and an emission filter of 535 nm to measure the average signal intensity of each cell. The transfected cell whose signal intensity was more than that of the upper limit in negative control was defined as a GFP-positive cell.
Overexpression in Cultured Rat Insulinoma Cell
Cultured rat insulinoma cells (INS1) were transfected with pcDNA6.2/C-EmGFP-DEST vector-cloned human KCNJ15 or entry vector, as in previous experiments. Cells were incubated for 72 hr to allow overexpression of the KCNJ15 gene. Transfected INS1 were cultured in 24-well plates and preincubated for 30 min at 37°C in glucose-free Krebs-Ringer buffer, followed by 1 hr of incubation with 5 mM glucose or 25 mM glucose for the determination of insulin secretion. Insulin secreted into the medium was measured via ELISA (Rat Insulin ELISA Kit, Mercodia AB).
Statistical Analysis
Data for subjects are presented as mean ± SD or standard error of the mean [SEM]. Hardy-Weinberg equilibrium was assessed by the χ2 analysis. The overall distribution of alleles was analyzed with the use of 2 × 2 contingency tables. Statistical significance was defined as p < 0.05. In the pooled-sample analysis, the threshold of p values was set to 0.05 in order to minimize pseudonegatives. In genotyping data, a lower p value is presented with dominant or recessive models. The Danish case-control study was analyzed by logistic regression adjusted for the effect of age and sex under the assumption of a multiplicative genetic model. Quantitative traits in the Inter99 cohort were analyzed by linear regression adjusted for age, sex, and BMI (when appropriate).
Tag SNPs were selected by estimated haplotype construction calculated by Haploview 4.1 with Japanese genotype data from the HapMap project. The haplotype analysis was performed. Permutation-based hypothesis testing (10,000 permutations) was performed for the examination of associations of estimated haplotype frequencies. We performed permutation tests for correction of multiple testing by the Haploview permutation function on all tested markers and haplotypes.
Results
Association Mapping in the Candidate Region on ch21q
We focused on the candidate region contained within the physical positions between 38,000,000 and 46,944,323 on ch21q, which also contained the peak LOD-score region outlined in our previous report (Figure 1A and Table 1). In the first screening, a case-control association study was conducted, involving 149 unrelated T2DM patients derived from an original sibling-pair set and 200 healthy unrelated individuals. Ninety-six T2DM patients were defined as lean, given that their BMI was lower than 24 kg/m2 (Table 2).
Figure 1.
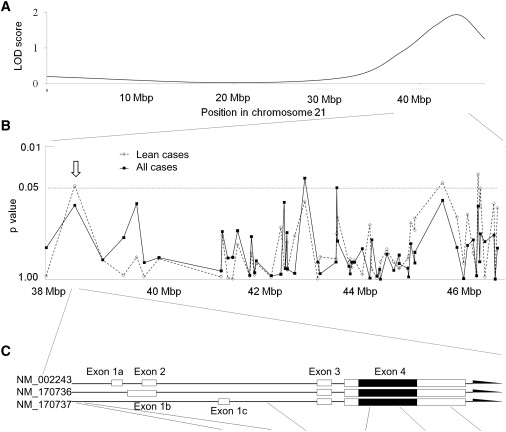
Association Mapping in the Ch21q Candidate Region with Pooled Samples and Variants of KCNJ15 and Their Association with T2DM
(A) LOD score of linkage analysis on ch21q.8
(B) Association mapping in the region between D21S1440 and D21S1446.
(C) KCNJ15 structure and the SNPs detected by variation screening. Black blocks represent coding regions, and white blocks represent the untranslated regions. Location and frequencies of the KCNJ15 SNP in case and control samples are shown in Table 1.
Table 1.
Location and Frequencies of the KCNJ15 SNP in Case and Control Samples
| SNP ID | rs2836247 | rs13433471 | rs743296 | rs3746876 | rs2230033 | rs1064273 |
| Polymorphism | G-255T | C-212G | G16183C | Ile88Ile (C566T) | Asp98Gly | C44635T |
| Annotation | Promoter | Promoter | Intron 2 | Exon 4 | Exon 4 | Exon 4 |
| Allele Frequency | ||||||
| Risk allele | T | G | G | T | A | T |
| Lean case: major | 137 (72.1%) | 134 (69.8%) | 143 (78.6%) | 180 (93.8%) | 131 (68.2%) | 149 (81.9%) |
| Lean case: minor | 53 (27.9%) | 58 (30.2%) | 39 (21.4%) | 12 (6.3%) | 61 (31.8%) | 33 (18.1%) |
| Control: major | 266 (67.2%) | 269 (67.3%) | 238 (68.4%) | 390 (98.0%) | 282 (70.5%) | 340 (89.0%) |
| Control: minor | 130 (32.8%) | 131 (32.8%) | 110 (31.6%) | 8 (2.0%) | 118 (29.5%) | 42 (11.0%) |
| Odds ratio | 1.26 | 1.13 | 1.69 | 3.25 | 1.13 | 1.79 |
| p value | n.s. | n.s. | 0.013 | 7.1 × 10⁻³ | n.s. | n.s. |
| Genotype Frequency | ||||||
| Lean case: M/Ma | 50 (64.9%) | 56 (55.4%) | 61 (67.0%) | 85 (88.5%) | 42 (43.8%) | 64 (85.3%) |
| Lean case: M/ma | 37 (39.8%) | 22 (25.6%) | 21 (23.1%) | 10 (10.4%) | 47 (49.0%) | 21 (24.4%) |
| Lean case: m/ma | 8 (8.4%) | 18 (18.8%) | 9 (9.9%) | 1 (1.0%) | 7 (7.3%) | 6 (6.6%) |
| Control: M/Ma | 86 (69.9%) | 101 (47.4%) | 77 (44.3%) | 192 (96.5%) | 97 (48.5%) | 154 (95.7%) |
| Control: M/ma | 94 (50.8%) | 67 (36.0%) | 84 (48.3%) | 6 (3.0%) | 88 (44.0%) | 32 (17.1%) |
| Control: m/ma | 18 (9.1%) | 32 (16.0%) | 13 (7.5%) | 1 (0.5%) | 15 (7.5%) | 5 (2.6%) |
| p valueb | n.s. | n.s. | 4.2 × 10⁻⁴ | 7.6 × 10⁻³ | n.s. | n.s. |
Variations (rs2836246, rs3746875, rs9963, rs2298331, rs7277497, rs3171454) with MAFs less than 1% were omitted.
M/M, major homozygote; M/m, heterozygote; m/m, minor homozygote.
Lower p value observed on the basis of genotype frequencies assessed within a recessive or dominant model.
Table 2.
Replication Analysis for KCNJ15 rs3746876 (C566T)
| Sample |
Allele (%) |
Genotype (%) |
p Valuea |
ORa(95% CI) |
||||||
|---|---|---|---|---|---|---|---|---|---|---|
| C | T | C/C | C/T | T/T | Allele | Genotype | Allele | Genotype | ||
| Japanese Population | ||||||||||
| Screening sample | Controls | 390 (98.0) | 8 (2.0) | 192 (96.5) | 6 (3.0) | 1 (0.5) | - | - | - | - |
| All cases | 279 (94.3) | 17 (5.7) | 132 (89.2) | 15 (10.1) | 1 (0.7) | 9.1×10⁻³ | 6.9×10⁻³ | 2.97 (1.26-6.98) | 3.32 (1.33-8.30) | |
| Lean cases | 180 (93.8) | 12 (6.3) | 85 (88.5) | 10 (10.4) | 1 (1.0) | 7.1×10⁻³ | 7.6×10⁻³ | 3.25 (1.31-8.09) | 3.55 (1.33-9.47) | |
| Lifelong lean cases | 67 (93.1) | 5 (6.9) | 32 (88.9) | 3 (8.3) | 1 (2.8) | 0.019 | 0.047 | 3.63 (1.16-11.46) | 3.43 (0.95-12.38) | |
| Replication sample A | Controls | 963 (96.5) | 35 (3.5) | 465 (93.2) | 33 (6.6) | 1 (0.2) | - | - | - | - |
| All cases | 768 (93.7) | 52 (6.3) | 360 (87.8) | 48 (11.7) | 2 (0.5) | 6.5×10⁻³ | 5.3×10⁻³ | 1.87 (1.20-2.89) | 1.90 (1.20-3.00) | |
| Lean cases | 481 (93.2) | 35 (6.8) | 225 (87.2) | 31 (12.0) | 2 (0.8) | 4.0×10⁻³ | 6.1×10⁻³ | 2.00 (1.24-3.24) | 2.01 (1.21-3.32) | |
| Lifelong lean cases | 176 (90.7) | 18 (9.3) | 81 (83.5) | 14 (14.4) | 2 (2.1) | 3.5×10⁻⁴ | 1.6×10⁻³ | 2.84 (1.56-5.08) | 2.70 (1.43-5.12) | |
| Replication sample B | Controls | 1,937 (96.9) | 63 (3.2) | 937 (93.7) | 63 (6.3) | 0 (0.0) | - | - | - | - |
| All cases | 1,902 (95.1) | 98 (4.9) | 906 (90.6) | 90 (9.0) | 4 (0.4) | 4.9×10⁻³ | 0.01 | 1.58 (1.14-2.19) | 1.54 (1.11-2.15) | |
| Lean cases | 966 (94.7) | 54 (5.3) | 458 (89.8) | 50 (9.8) | 2 (0.4) | 3.9×10⁻³ | 6.9×10⁻³ | 1.72 (1.19-2.49) | 1.69 (1.15-2.48) | |
| Lifelong lean cases | 282 (93.4) | 20 (6.6) | 131 (86.8) | 20 (13.2) | 0 (0.0) | 2.6×10⁻³ | 2.1×10⁻³ | 2.18 (1.30-3.66) | 2.27 (1.33-3.88) | |
| Combined samples | Controls | 3,290 (96.9) | 106 (3.1) | 1,594 (93.9) | 102 (6.0) | 2 (0.1) | - | - | - | - |
| All cases | 2,949 (94.6) | 167 (5.4) | 1,398 (89.7) | 153 (9.8) | 7 (0.4) | 6.7×10⁻⁶ | 1.5×10⁻⁵ | 1.76 (1.37-2.25) | 1.75 (1.36-2.27) | |
| Lean cases | 1,627 (94.2) | 101 (5.8) | 768 (88.9) | 91 (10.5) | 5 (0.6) | 2.9×10⁻⁶ | 8.7×10⁻⁶ | 1.93 (1.46-2.55) | 1.92 (1.43-2.56) | |
| Lifelong lean cases | 525 (92.4) | 43 (7.6) | 244 (85.9) | 37 (13.0) | 3 (1.1) | 2.5×10⁻⁷ | 1.7×10⁻⁶ | 2.54 (1.76-3.67) | 2.51 (1.70-3.71) | |
| Danish Population | ||||||||||
| Controls | 9694 (99.2) | 76 (0.8) | 4,809 (98.4) | 76 (1.6) | 0 (0.0) | - | - | - | - | |
| All cases | 7013 (99.3) | 49 (0.7) | 3482 (98.6) | 49 (1.4) | 0 (0.0) | 0.53 | 0.53 | 0.89 (0.62-1.28) | 0.89 (0.62-1.28) | |
| Lean cases | 3470 (99.3) | 26 (0.7) | 1722 (98.5) | 26 (1.5) | 0 (0.0) | 0.84 | 0.84 | 0.96 (0.61-1.50) | 0.96 (0.61-1.50) | |
| Lifelong lean cases | 903 (99.4) | 5 (0.6) | 449 (98.9) | 5 (1.1) | 0 (0.0) | 0.45 | 0.45 | 0.70 (0.28-1.75) | 0.70 (0.28-1.75) | |
A Japanese lean case was defined as one with a BMI ≤ 24 at the time of sampling.
A Japanese lifelong lean case was defined as one with a lifelong BMI ≤ 24.
A Danish relative lean case was defined as one with a BMI ≤ 30.0; the 50th percentile of T2DM cases.
A Danish absolute lean case was defined as one with a BMI ≤ 25.0; the 50th percentile of population-based control samples.
As compared with control.
In order to clarify the primary gene conferring the LOD score, we selected a total of 86 SNPs in this region. To estimate the allele frequencies of each SNP, capillary-electrophoresis single-strand confirmation polymorphism (CE-SSCP) analysis was performed as reported.18 Sixty-five SNPs out of 86 were successfully analyzed, and allele frequencies between the cases and the controls were compared (Table S2). Five SNPs showed nominal significant differences on the basis of the estimation by CE-SSCP analysis (Figure 1B).
Individual genotyping by direct sequencing for these five SNPs in the 149 T2DM cases and 200 control subjects and subsequent association analysis revealed that one SNP (rs743296 T allele and dominant model [C/T or T/T] genotype) showed a significant association with unstratified T2DM and with lean T2DM (Table S5). The minor T allele frequency in all T2DM patients was significantly lower than that in controls (24.3% and 31.6%, respectively; p = 0.042). Moreover, the association with lean T2DM was more prominent (21.4% and 31.6%, respectively; p = 0.013). In the genotype comparison, the frequency of homozygotes for the major allele in patients was significantly higher than that in controls (61.1% and 44.3%, respectively; p = 2.7 × 10⁻³). Again, the lean cases showed more prominent association (67.0% and 44.3%, respectively; p = 4.2 × 10⁻⁴).
The linkage disequilibrium (LD) block containing rs743296 covers only one gene, KCNJ15, according to HapMap data of Japanese panels (Figure S1). Both the upstream and the downstream regions of the gene belong to the different LD blocks, and the SNPs in the adjacent genes did not show significant association. Thus, KCNJ15 was considered as a primary gene in this candidate region.
Replication and Primary SNP of KCNJ15 in Association with T2DM
After identifying KCNJ15 as a likely primary gene, we performed high-density association mapping to detect the primary SNP in this gene. First, we performed direct sequencing of all of the exons and the promoter region of KCNJ15 in 200 healthy, unrelated Japanese subjects to screen for variation. The exon-intron structure was based on the NCBI Refseq database build 129 (NM_002243, NM_170736, and NM_170737) (Figure 1). Via the variation screening, three SNPs in the promoter and eight SNPs in the exons were detected. Among them, five KCNJ15 SNPs had frequencies of more than 1% in the controls, and no new polymorphisms were discovered. Genotyping of 149 T2DM cases and 200 controls was carried out for the five SNPs by direct sequencing. The association analysis revealed that the original SNP (rs743296) and the SNP on exon 4 (rs3746876: C566T of mRNA position on exon 4, based on NM_002243, at codon 88 for isoleucine) T allele and dominant model (C/T or T/T) genotype showed significant associations with lean T2DM (rs743296: allele p = 0.013, odds ratio [OR] = 1.69, genotype p = 4.2 × 10⁻⁴; rs3746876: allele p = 7.1 × 10⁻³, OR = 3.25, genotype p = 7.6 × 10⁻³) (Figure 1C).
For the detection of a possible association with SNP(s) in intron 2, haplotype and LD analyses were performed in the 200 healthy controls, and after the outcome of these analyses, three tag SNPs were selected: C4724A (rs2836252), T4782A (rs2000457), and T15950C (rs2836266). Five haplotypes showing estimated frequencies of more than 3% in the controls were subjected to further association analysis. No significant association was, however, observed for any of the haplotype (Figure S2).
Next, in order to confirm the observed associations in the first sample set, two SNPs (rs743296 and rs3746876) were analyzed in two independent sample sets composed of 419 cases and 500 controls (Japanese replication sample A [replication A]) or 1000 cases and 1000 controls (Japanese replication sample B [replication B]). rs3746876 (T allele and dominant model [C/T or T/T] genotype) showed replicated significant association in both replication sets (replication A: p = 6.5 × 10⁻³, OR 1.87; replication B: p = 4.9 × 10⁻³, OR 1.58) (Table 2). Subclass analysis with all of the samples from the first and the replication sets showed that the association of rs3746876 was more prominent in the lean T2DM samples, especially in the lifelong lean cases whose maximal BMI was less than 24 (all cases combined: p = 6.7 × 10⁻⁶, OR = 1.76; lean cases combined: p = 2.9 × 10⁻⁶, OR = 1.93; lifelong lean cases combined: p = 2.5 × 10⁻⁷, OR = 2.54).
In an attempt to replicate the positive association of the KCNJ15 variant with T2DM among Japanese subjects, we examined the association of rs3746876 with T2DM in the Danish population. A total of 3531 patients with T2DM and 4885 glucose-tolerant subjects were studied. The minor allele frequencies (MAFs) in the Danish population were significantly lower as compared to those in the Japanese population (Danish: controls 0.8%, cases 0.7%; Japanese: all controls 3.1%, all cases 5.4%). In the simulation study, the sample size of the Danish case-control study yielded 80% statistical power for detecting association if the relative risk is larger than 1.5 (Figure S3). However, as shown in Table 2, there were no significant differences in either allele frequency or genotype frequency of KCNJ15 rs3746876 between T2DM cases and glucose-tolerant individuals. Also, analysis of T2DM-related quantitative traits in 5783 participants of the Danish population-based Inter99 cohort revealed no statistically significant associations (Table 3).
Table 3.
Quantitative Intermediary Diabetes-Related Traits in Treatment-Naive Individuals from the Population-Based Inter99 Cohort Stratified with Regard to Genotype of KCNJ15 rs3746876
| C/C | C/T | T/T | p Value | |
|---|---|---|---|---|
| N (men/women) | 5690 (2824/2866) | 93 (46/47) | 0 | |
| Age (yrs) | 46.2 ± 7.9 | 44.7 ± 8.1 | ||
| BMI | 26.2 ± 4.6 | 25.6 ± 3.7 | 0.4 | |
| Fasting glucose (mmol/l) | 5.5 ± 0.8 | 5.4 ± 0.5 | 0.6 | |
| Glucose at 30 min (mmol/l) | 8.7 ± 1.9 | 8.4 ± 1.8 | 0.3 | |
| Glucose at 120 min (mmol/l) | 6.2 ± 2.1 | 6.2 ± 2.1 | 0.7 | |
| Incremental AUC for glucose | 221 ± 136 | 211 ± 140 | 0.8 | |
| Fasting insulin (pmol/l) | 35 (24–52) | 35 (26.5–56) | 0.1 | |
| Insulin at 30 min (pmol/l) | 247 (177–357) | 220 (160–346) | 0.3 | |
| Insulin at 120 min (pmol/l) | 157 (97–258) | 172 (122–237) | 0.7 | |
| Incremental AUC for insulin | 18,810 (13,130–27,420) | 17,750 (12,240–24,990) | 0.8 | |
| Derived Estimates of Insulin Response | ||||
| Insulinogenic index | 24.5 (16.9–36.4) | 22.6 (14.6–33.8) | 0.2 | |
| BIGTT-AIR | 1620 (1280–2080) | 1580 (1340–2100) | 0.8 | |
| CIR | 651 (400–1061) | 634 (369–1229) | 0.6 | |
| Derived Estimates of Insulin Sensitivity | ||||
| HOMA-IR (mg/dl × μU/ml) | 4.8 ± 5.5 | 4.2 ± 2.5 | 0.2 | |
| BIGTT-Si | 9.2 ± 4.1 | 9.2 ± 4.0 | 0.8 | |
Data are mean ± SD or median (interquantile range). Values of s-insulin, insulinogenic index, BIGTT-AIR, CIR, and HOMA-IR were logarithmically transformed before statistical analysis. Calculated p values were adjusted for age, sex, and BMI, except for BMI (age and sex) and BIGTT-AIR and BIGTT-Si (age).
Insulinogenic index: (insulin at 30 min (pmol/l) − fasting insulin (pmol/l)) / glucose at 30 min (mmol/l).
CIR: insulin at 30 min / (glucose at 30 min × (glucose at 30 min – 3.89)) × 100.
HOMA-IR (μU/ml × mg/dl): fasting insulin (μU/ml) × fasting glucose (mg/dl) / 405.
BIGTT-insulin sensitivity index (BIGTT-Si) and BIGTT-AIR use information about sex and BMI combined with analysis of glucose and insulin levels at the time points 0, 30, and 120 min to provide indices for Si and AIR, which highly correlate with indexes obtained during an intravenous glucose tolerance test, and were calculated as described elsewhere.36
The KCNJ15 rs3746876 (C566T) Polymorphism Affects mRNA Level
We measured the mRNA level of KCNJ15 extracted from peripheral-blood cells in 16 healthy volunteers and examined the association with rs3746876 (C566T) genotypes. The mRNA level was significantly higher in the T/C or T/T genotype than in the C/C genotype (p = 0.0036) (Figure 2A). The relative ratio of the allele T mRNA level to that of the allele C was measured by RDP analysis with the T/C heterozygote samples.19 The level of the allale T mRNA was significantly higher than that of the allele C mRNA (Figure 2B).
Figure 2.
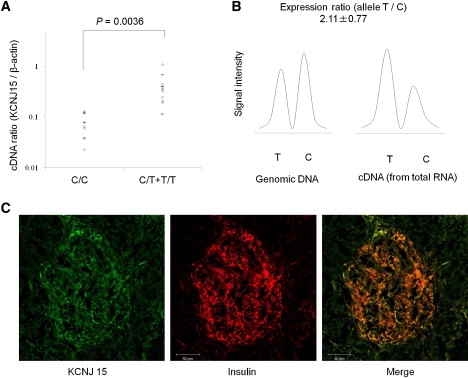
Genotype and mRNA Level and Localization of KCNJ15
(A) The mRNA expression level of KCNJ15 in PMNCs from healthy individuals with different genotypes (eight C/C, seven C/T, and one T/T) relative to β-actin measured by Q-PCR. Horizontal bars represent mean and SD.
(B) RDP analysis of KCNJ15 in PBMCs from healthy individuals. Fragments of 66 bp containing the C allele or the T allele were analyzed: T and C indicate minor (susceptible) and major allele fragments, respectively. Average expression ratios with SD in four independent experiments are indicated.
(C) Immunofluorescence staining of Kcnj15 and insulin. A tissue with immunofluorescence staining was visualized with confocal microscopy. Kcnj15 was detected as alexa-488 fluorescence (Kcnj15-green) and insulin by alexa-633 fluorescence (insulin-red). The same sections were merged into the overlapped images (merge). Human pancreas tissue was a frozen section from a nondiabetic and surgical operation.
Localization of Kcnj15 in the Pancreas
The reference data from Affymetrix, all exon microarray data, and the GNF Expression Atlas 1 Human Data on Affy U95 Chips in the UCSC Genome Browser database reveal that the expression of Kcnj15 in the pancreas is relatively high, as is that in the kidney, thymus, and whole blood. The expression of the KCNJ15 molecule in Langerhans islets was prominent as compared with that of exocrine glands in nondiabetic humans (Figure 2C).
Association of the rs3746876 (C566T) Polymorphism with Insulin Deficiency and Maximal BMI in Japanese T2DM Patients
We analyzed potential associations between genotypes and BMI, estimates of insulin secretion and resistance, age at diagnosis, and response to therapeutic intervention. The maximal BMI of patients with the T/T genotype was significantly lower than that of those with the C/C or the C/T genotype (p = 0.046) (Figure 3A). Moreover, the prevalence of patients who required insulin therapy during the follow-up study was significantly higher in the patients with the T/C or T/T genotype than in those with the C/C genotype (p = 0.047) (Figure 3B). The age at diagnosis and estimates of insulin secretion and insulin resistance, calculated by the HOMA-IR,21 did not associate with rs3746876 (Figure 3C).
Figure 3.
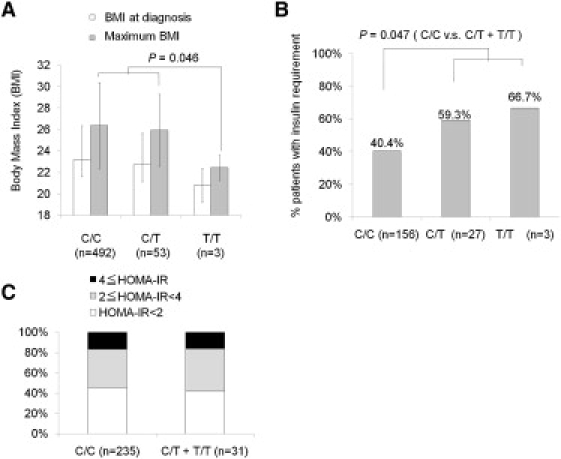
Clinical Characteristics Associated with rs3746876 (C566T)
(A) Association of the SNP with BMI of the patients at the time of diagnosis and maximal BMI throughout the follow-up period. Values represent mean ± SD.
(B) Association of the SNP with the percentage of patients who progressed to insulin deficiency (required insulin therapy or HOMA-β less than 10) among the patients who have been followed up for more than 10 yrs after diagnosis with each genotype.
(C) Association of the SNP with the percentage of patients who progress to high insulin resistance (HOMA-IR more than 2 or more than 4) among patients who have been followed up for more than 10 yrs after diagnosis with each genotype.
In Vitro Functional Analysis of the rs3746876 (C566T) Polymorphism
The stability of the mRNA was then analyzed as previously described.22 Synthetic KCNJ15 mRNA carrying the T allele was degraded at a significantly reduced rate as compared to that carrying the C allele (p = 0.039) (Figure 4A). These data indicated that the T allele carrier individuals may show higher levels of KCNJ15 mRNA because of the advantage of its increased stability. Finally, protein expression levels of KCNJ15 were examined with the use of KCNJ15-GFP fusion protein expressed in HEK 293 cells. Protein expression of KCNJ15 was higher in the rs3746876 (T allele) than in rs3746876 (C allele) samples in both the membrane fraction (p = 0.028) (Figure 4B) and whole-cell fractions (p = 0.00023) (Figure 4C). For functional analysis of the protein level of KCNJ15, overexpression experiments of KCNJ15 were conducted (Figure 4D). Overexpression of KCNJ15 decreased insulin secretion at high-glucose conditions (p = 0.035). However, no significant change was found under normoglycemic conditions (5 mM glucose).
Figure 4.
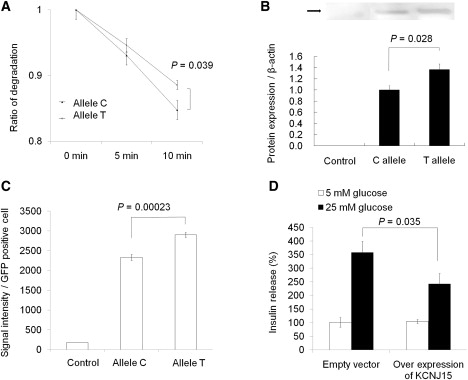
Functional Analysis of the rs3746876 Polymorphism
(A) Stability of susceptible and nonsusceptible KCNJ15 transcripts. Values represent mean ± SEM of data from three independent experiments.
(B) GFP fusion protein expression of KCNJ15 in the membrane fraction. Immunoblotting analysis was conducted with the use of GFP antibody. Values represent mean ± SEM of data from three independent experiments.
(C) GFP fusion protein expression of KCNJ15 in whole-cell fractions. The values were measured by FACS analysis. Values represent mean ± SEM of data from three independent experiments.
(D) INS-1 cells were cultured for 72 hr, and insulin secretion was determined after a 1 hr incubation in 5 mM or 25 mM glucose. Results are expressed as a percentage of 5 mM glucose. Control values: 0.98 ± 0.04 mg/mg of protein. Values represent mean ± SEM.
Discussion
Applying genome-wide linkage analysis and SNP-based fine mapping in the candidate region on ch21q, we have identified KCNJ15 as a T2DM susceptibility gene in the Japanese population. We showed that KCNJ15 is expressed in the β cell of the human pancreas, and functional analysis revealed that the rs3746876 (C566T) variant in exon 4 potentially affects β cell function.
The first peak LOD score of this candidate region on ch21q, derived from linkage analysis in 164 T2DM families (256 affected sibling pairs), increased when the linkage study was limited to the 116 families with lean T2DM (BMI < 24 kg/m2).8 We started with a case-control association study of the unrelated T2DM patients in the original sample set and healthy control subjects. Estimation of allele frequency by CE-SSCP18 detected a significant association of one SNP (rs743296) located in KCNJ15. High-density mapping in KCNJ15, LD, and haplotype analysis enabled us to identify rs3746876 (C566T) as the lead SNP in the region. Moreover, we confirmed the association of this SNP by two independent replication studies in the Japanese population. Because there were limitations concerning SNP density and estimation of allele frequencies with the use of pooled samples, we cannot rule out the possibility of susceptibility gene(s) other than KCNJ15. In addition, because of the low frequency of the risk allele at rs3746876, this SNP alone could not explain the positive linkage result for the chromosomal region. Other variants located in this region are likely to be present.
It is noteworthy that population-diversity data of rs3746876 (C566T) are not available from the NCBI database at the time of this study. However, the data are now available at the HapMmap database. Moreover, as for the latest genome-wide SNP-typing arrays, only the Human 1M DNA Analysis Beadchip (Illumina) contains this SNP. The other commercially available platforms, including the 500K Chip (Affymetrix), the Genome-Wide Human SNP Array 6.0 (Affymetrix), and the 317K Chip (Illumina), do not contain this SNP.
Interestingly, the primary diabetes-associated SNP, rs3746876 (C566T), exhibits a marked difference in allele frequency between individuals of Japanese and European ethnicity. For instance, the MAF of the SNP in the general Danish population was only 0.81%, as opposed to 3.1% in Japanese control subjects. Therefore, in the Danish genotype-phenotype correlation study using 5783 subjects with T2DM, the number of subjects with a T risk allele was only 93 (1.1%), whereas the remaining 98.9% individuals were C/C homozygous. No T/T-homozygous individuals were detected in the Danish sample. Thus, this SNP showed a striking population diversity between European and Japanese individuals. Statistical power for quantitative traits in the Inter99 cohort was calculated as previously reported.23 Assuming an allele frequency of 0.0081 and an additive genetic model, we had 80% statistical power for detecting an allele-dependent difference of 28% of an SD at a 5% significance level, corresponding to a 12% difference in BIGTT-acute insulin response (BIGTT-AIR), 21% in CIR, and 18% in HOMA-IR.
In addition, the clinical data at enrollment were not associated with genotypes (Table S6). However, it should be noted that the spectrum of BMI was quite different from that in the Japanese population (Table S1). Asians, unlike those of European descent, tend to become diabetic without being obese. Therefore, it is reasonable to assume that the genes responsible for Asian diabetes tend to be concentrated in the subgroup of which the patients are diabetic but not obese. We therefore conducted association studies in subgroups of the diabetes patients who are lean. In Japanese participants, the association with T2DM was more significant at lower BMI levels. However, we failed to find such association between the 50th percentile of lean cases and controls among the Danish participants. Of interest, variation in KCNQ1 was originally found to be associated with T2DM in the Japanese population, and the association was replicated in other ethnicities, including the Danish population.16,24 The relative risk of T2DM in carriers of the KCNJ15 risk allele was 1.76, which increased to 2.54 when the analyses were limited to the subjects with a BMI less than 24 kg/m2. The ORs estimated in the present manuscript may be overestimates and should be validated in later studies. However, these estimated risk increments are large, suggesting that rs3746876 (C566T) in the KCNJ15 gene is also an important contributor to T2DM susceptibility in the Asian population, as it is in the KCNQ1 gene.
A recent review of the functional properties of synonymous SNPs in exons suggested that synonymous SNPs may influence gene variant splicing, miRNA, protein folding and mRNA folding.25 It has also been reported that SNPs in the 3′ untranslated region (UTR) of genes may affect the stability of transcripts.26–28 In the present study we provide evidence that the synonymous SNP (Ile88Ile) variant influences mRNA levels and their stability; also the KCNJ15 protein levels were higher in the T allele carriers than in non-carriers. The stability of transcripts is suggested to be regulated by miRNA and/or mRNA folding. Here we demonstrate changes of the mRNA second structure of KCNJ15 as predicted by MFOLD software29 (Figure S4).
The KCNJ15 protein is a member of the inwardly-rectifying potassium channel (KIR) family and was cloned from human kidney by Shuck et al.30 According to the initial channel nomenclature, KCNJ15 was also termed IRKK, KIR1.3, or KIR4.2. KCNJ15 is abundantly expressed in many organs, including the pancreas and peripheral blood mononuclear cells. In the current study, we demonstrated that a genetically determined increased expression of KCNJ15 confers susceptibility to T2DM among Japanese, as well as earlier dependency on insulin treatment in patients with established T2DM.
On the basis of current knowledge about the functions of the KiR protein family and the present findings, we suggest that KCNJ15 may negatively regulate insulin secretion by maintaining resting membrane potential of pancreatic β cells and thereby inhibit depolarization, like KCNJ11.31,32 Recently, the Ca2+-sensing receptor (CsR) was demonstrated as the key molecule for a full insulin-secretory response of β cells,33–35 and, importantly, KCNJ15 and CsR are functionally associated with each other, whereas KCNJ11 and CsR are not associated with each other.35
In conclusion, genome-wide linkage analysis and SNP fine mapping in the candidate of ch21q have identified a new T2DM susceptibility gene, KCNJ15, a molecule associated with altered insulin release that may be applicable as a new therapeutic target in T2DM.
Supplemental Data
Supplemental Data include a Supplemental Acknowledgment, four figures, and six tables and can be found with this article online at http://www.ajhg.org.
Supplemental Data
Web Resources
The URLs for data presented herein are as follows:
ClinicalTrials.gov, http://clinicaltrials.gov/
HapMap, http://www.hapmap.org/
NCBI Refseq database, http://www.ncbi.nlm.nih.gov/locuslink/
Online Mendelian Inheritance in Man (OMIM), http://www.ncbi.nlm.nih.gov/Omim/
Acknowledgments
This study was supported by a grant-in-aid for scientific research in the priority area “Comprehensive Genomics” from the Ministry of Education, Culture, Sports, Science and Technology of Japan (MEXT) to K.T. This study was partially supported by the BioBank Japan Project on the Implementation of Personalized Medicine, MEXT (E.N.); a Health and Labor Sciences research grant for research on the human genome; grants for tissue engineering and food biotechnology from the Ministry of Health, Labour and Welfare of Japan (E.N.); Special Coordination Funds for Promoting Science and Technologies, MEXT (E.N.); the Satake Takako Award from Tokyo Women's Medical University; the Lilly Award from the Japan Diabetes Society; a Grant-in-aid for Scientific Research, MEXT (N.I.); and a grant-in-aid for scientific research in the priority area “Medical Genome Science,” MEXT (N.I. and K.T.).
The Danish study was supported by the Lundbeck Foundation Centre of Applied Medical Genomics for Personalized Disease Prediction, Prevention and Care and the Danish Diabetes Association. The Inter99 study was supported by the Danish Research Council; the Danish Centre for Health Technology Assessment of Novo Nordisk Inc.; the Research Foundation of Copenhagen County; the Ministry of Internal Affairs and Health; the Danish Heart Foundation; the Danish Pharmaceutical Association; the Augustinus Foundation; the Ib Henriksen Foundation; the National Health Services in the counties of Copenhagen, Aarhus, Ringkøbing, Ribe, and South Jutland; together with the Danish Research Foundation for General Practice; the Danish Centre for Evaluation and Health Technology Assessment; the Diabetes Fund of the National Board of Health; the Danish Medical Research Council; the Aarhus University Research Foundation; and the Novo Nordisk Foundation.
References
- 1.Office for Lifestyle-Related Disease Control, Ministry of Health and Welfare . Government of Japan, Ministry of Health and Welfare; Japan: 1999. Diabetes Survey 1997. [Google Scholar]
- 2.Zimmet P., Alberti K.G., Shaw J. Global and societal implications of the diabetes epidemic. Nature. 2001;414:782–787. doi: 10.1038/414782a. [DOI] [PubMed] [Google Scholar]
- 3.Duval S., Vazquez G., Baker W.L., Jacobs D.R., CODA study group The Collaborative Study of Obesity and Diabetes in Adults (CODA) project: meta-analysis design and description of participating studies. Obes. Rev. 2007;8:263–276. doi: 10.1111/j.1467-789X.2006.00263.x. [DOI] [PubMed] [Google Scholar]
- 4.Ehm M.G., Karnoub M.C., Sakul H., Gottschalk K., Holt D.C., Weber J.L., Vaske D., Briley D., Briley L., Kopf J., American Diabetes Association GENNID Study Group. Genetics of NIDDM Genomewide search for type 2 diabetes susceptibility genes in four American populations. Am. J. Hum. Genet. 2000;66:1871–1881. doi: 10.1086/302950. [DOI] [PMC free article] [PubMed] [Google Scholar]
- 5.Wong K.C., Wang Z. Prevalence of type 2 diabetes mellitus of Chinese populations in Mainland China, Hong Kong, and Taiwan. Diabetes Res. Clin. Pract. 2006;73:126–134. doi: 10.1016/j.diabres.2006.01.007. [DOI] [PubMed] [Google Scholar]
- 6.Davis T.M., Cull C.A., Holman R.R., U.K. Prospective Diabetes Study (UKPDS) Group Relationship between ethnicity and glycemic control, lipid profiles, and blood pressure during the first 9 years of type 2 diabetes: U.K. Prospective Diabetes Study (UKPDS 55) Diabetes Care. 2001;24:1167–1174. doi: 10.2337/diacare.24.7.1167. [DOI] [PubMed] [Google Scholar]
- 7.Sone H., Katagiri A., Ishibashi S., Abe R., Saito Y., Murase T., Yamashita H., Yajima Y., Ito H., Ohashi Y., JD Study Group Effects of lifestyle modifications on patients with type 2 diabetes: the Japan Diabetes Complications Study (JDCS) study design, baseline analysis and three year-interim report. Horm. Metab. Res. 2002;34:509–515. doi: 10.1055/s-2002-34791. [DOI] [PubMed] [Google Scholar]
- 8.Iwasaki N., Cox N.J., Wang Y.Q., Schwarz P.E., Bell G.I., Honda M., Imura M., Ogata M., Saito M., Kamatani N., Iwamoto Y. Mapping genes influencing type 2 diabetes risk and BMI in Japanese subjects. Diabetes. 2003;52:209–213. doi: 10.2337/diabetes.52.1.209. [DOI] [PubMed] [Google Scholar]
- 9.Frayling T.M. Genome-wide association studies provide new insights into type 2 diabetes aetiology. Nat. Rev. Genet. 2007;8:657–662. doi: 10.1038/nrg2178. [DOI] [PubMed] [Google Scholar]
- 10.Chen G., Adeyemo A.A., Zhou J., Chen Y., Doumatey A., Lashley K., Huang H., Amoah A., Agyenim-Boateng K., Eghan B.A. A genome-wide search for linkage to renal function phenotypes in West Africans with type 2 diabetes. Am. J. Kidney Dis. 2007;49:394–400. doi: 10.1053/j.ajkd.2006.12.011. [DOI] [PubMed] [Google Scholar]
- 11.Malhotra A., Elbein S.C., Ng M.C., Duggirala R., Arya R., Imperatore G., Adeyemo A., Pollin T.I., Hsueh W.C., Chan J.C. Meta-analysis of genome-wide linkage studies of quantitative lipid traits in families ascertained for type 2 diabetes. Diabetes. 2007;56:890–896. doi: 10.2337/db06-1057. [DOI] [PubMed] [Google Scholar]
- 12.Miao F., Wu X., Zhang L., Yuan Y.C., Riggs A.D., Natarajan R. Genome-wide analysis of histone lysine methylation variations caused by diabetic conditions in human monocytes. J. Biol. Chem. 2007;282:13854–13863. doi: 10.1074/jbc.M609446200. [DOI] [PubMed] [Google Scholar]
- 13.Saxena R., Voight B.F., Lyssenko V., Burtt N.P., de Bakker P.I., Chen H., Roix J.J., Kathiresan S., Hirschhorn J.N., Daly M.J., Diabetes Genetics Initiative of Broad Institute of Harvard and MIT, Lund University, and Novartis Institutes of BioMedical Research Genome-wide association analysis identifies loci for type 2 diabetes and triglyceride levels. Science. 2007;316:1331–1336. doi: 10.1126/science.1142358. [DOI] [PubMed] [Google Scholar]
- 14.Scott L.J., Mohlke K.L., Bonnycastle L.L., Willer C.J., Li Y., Duren W.L., Erdos M.R., Stringham H.M., Chines P.S., Jackson A.U. A genome-wide association study of type 2 diabetes in Finns detects multiple susceptibility variants. Science. 2007;316:1341–1345. doi: 10.1126/science.1142382. [DOI] [PMC free article] [PubMed] [Google Scholar]
- 15.Zeggini E., Weedon M.N., Lindgren C.M., Frayling T.M., Elliott K.S., Lango H., Timpson N.J., Perry J.R., Rayner N.W., Freathy R.M., Wellcome Trust Case Control Consortium (WTCCC) Replication of genome-wide association signals in UK samples reveals risk loci for type 2 diabetes. Science. 2007;316:1336–1341. doi: 10.1126/science.1142364. [DOI] [PMC free article] [PubMed] [Google Scholar]
- 16.Unoki H., Takahashi A., Kawaguchi T., Hara K., Horikoshi M., Andersen G., Ng D.P., Holmkvist J., Borch-Johnsen K., Jørgensen T. SNPs in KCNQ1 are associated with susceptibility to type 2 diabetes in East Asian and European populations. Nat. Genet. 2008;40:1098–1102. doi: 10.1038/ng.208. [DOI] [PubMed] [Google Scholar]
- 17.Organization W.H. World Health Org; Geneva: 1985. Diabetes Mellitus: Report of WHO Study Group. [PubMed] [Google Scholar]
- 18.Doi K., Doi H., Noiri E., Nakao A., Fujita T., Tokunaga K. High-throughput single nucleotide polymorphism typing by fluorescent single-strand conformation polymorphism analysis with capillary electrophoresis. Electrophoresis. 2004;25:833–838. doi: 10.1002/elps.200305721. [DOI] [PubMed] [Google Scholar]
- 19.Murakami Y., Isogai K., Tomita H., Sakurai-Yageta M., Maruyama T., Hidaka A., Nose K., Sugano K., Kaneko A. Detection of allelic imbalance in the gene expression of hMSH2 or RB1 in lymphocytes from pedigrees of hereditary, nonpolyposis, colorectal cancer and retinoblastoma by an RNA difference plot. J. Hum. Genet. 2004;49:635–641. doi: 10.1007/s10038-004-0201-0. [DOI] [PubMed] [Google Scholar]
- 20.Corey S., Clapham D.E. Identification of native atrial G-protein-regulated inwardly rectifying K+ (GIRK4) channel homomultimers. J. Biol. Chem. 1998;273:27499–27504. doi: 10.1074/jbc.273.42.27499. [DOI] [PubMed] [Google Scholar]
- 21.Matthews D.R., Hosker J.P., Rudenski A.S., Naylor B.A., Treacher D.F., Turner R.C. Homeostasis model assessment: insulin resistance and beta-cell function from fasting plasma glucose and insulin concentrations in man. Diabetologia. 1985;28:412–419. doi: 10.1007/BF00280883. [DOI] [PubMed] [Google Scholar]
- 22.Kamiyama M., Kobayashi M., Araki S., Iida A., Tsunoda T., Kawai K., Imanishi M., Nomura M., Babazono T., Iwamoto Y. Polymorphisms in the 3′ UTR in the neurocalcin delta gene affect mRNA stability, and confer susceptibility to diabetic nephropathy. Hum. Genet. 2007;122:397–407. doi: 10.1007/s00439-007-0414-3. [DOI] [PubMed] [Google Scholar]
- 23.Grarup N., Andersen G., Krarup N.T., Albrechtsen A., Schmitz O., Jørgensen T., Borch-Johnsen K., Hansen T., Pedersen O. Association testing of novel type 2 diabetes risk alleles in the JAZF1, CDC123/CAMK1D, TSPAN8, THADA, ADAMTS9, and NOTCH2 loci with insulin release, insulin sensitivity, and obesity in a population-based sample of 4,516 glucose-tolerant middle-aged Danes. Diabetes. 2008;57:2534–2540. doi: 10.2337/db08-0436. [DOI] [PMC free article] [PubMed] [Google Scholar]
- 24.Yasuda K., Miyake K., Horikawa Y., Hara K., Osawa H., Furuta H., Hirota Y., Mori H., Jonsson A., Sato Y. Variants in KCNQ1 are associated with susceptibility to type 2 diabetes mellitus. Nat. Genet. 2008;40:1092–1097. doi: 10.1038/ng.207. [DOI] [PubMed] [Google Scholar]
- 25.Parmley J.L., Hurst L.D. How do synonymous mutations affect fitness? Bioessays. 2007;29:515–519. doi: 10.1002/bies.20592. [DOI] [PubMed] [Google Scholar]
- 26.Yang T., McNally B.A., Ferrone S., Liu Y., Zheng P. A single-nucleotide deletion leads to rapid degradation of TAP-1 mRNA in a melanoma cell line. J. Biol. Chem. 2003;278:15291–15296. doi: 10.1074/jbc.M300954200. [DOI] [PubMed] [Google Scholar]
- 27.Doi K., Noiri E., Nakao A., Fujita T., Kobayashi S., Tokunaga K. Functional polymorphisms in the vascular endothelial growth factor gene are associated with development of end-stage renal disease in males. J. Am. Soc. Nephrol. 2006;17:823–830. doi: 10.1681/ASN.2005010094. [DOI] [PubMed] [Google Scholar]
- 28.Duan J., Wainwright M.S., Comeron J.M., Saitou N., Sanders A.R., Gelernter J., Gejman P.V. Synonymous mutations in the human dopamine receptor D2 (DRD2) affect mRNA stability and synthesis of the receptor. Hum. Mol. Genet. 2003;12:205–216. doi: 10.1093/hmg/ddg055. [DOI] [PubMed] [Google Scholar]
- 29.Zuker M. Mfold web server for nucleic acid folding and hybridization prediction. Nucleic Acids Res. 2003;31:3406–3415. doi: 10.1093/nar/gkg595. [DOI] [PMC free article] [PubMed] [Google Scholar]
- 30.Shuck M.E., Piser T.M., Bock J.H., Slightom J.L., Lee K.S., Bienkowski M.J. Cloning and characterization of two K+ inward rectifier (Kir) 1.1 potassium channel homologs from human kidney (Kir1.2 and Kir1.3) J. Biol. Chem. 1997;272:586–593. doi: 10.1074/jbc.272.1.586. [DOI] [PubMed] [Google Scholar]
- 31.Gloyn A.L., Pearson E.R., Antcliff J.F., Proks P., Bruining G.J., Slingerland A.S., Howard N., Srinivasan S., Silva J.M., Molnes J. Activating mutations in the gene encoding the ATP-sensitive potassium-channel subunit Kir6.2 and permanent neonatal diabetes. N. Engl. J. Med. 2004;350:1838–1849. doi: 10.1056/NEJMoa032922. [DOI] [PubMed] [Google Scholar]
- 32.Sagen J.V., Raeder H., Hathout E., Shehadeh N., Gudmundsson K., Baevre H., Abuelo D., Phornphutkul C., Molnes J., Bell G.I. Permanent neonatal diabetes due to mutations in KCNJ11 encoding Kir6.2: patient characteristics and initial response to sulfonylurea therapy. Diabetes. 2004;53:2713–2718. doi: 10.2337/diabetes.53.10.2713. [DOI] [PubMed] [Google Scholar]
- 33.Rasschaert J., Malaisse W.J. Expression of the calcium-sensing receptor in pancreatic islet B-cells. Biochem. Biophys. Res. Commun. 1999;264:615–618. doi: 10.1006/bbrc.1999.1577. [DOI] [PubMed] [Google Scholar]
- 34.Squires P.E., Harris T.E., Persaud S.J., Curtis S.B., Buchan A.M., Jones P.M. The extracellular calcium-sensing receptor on human beta-cells negatively modulates insulin secretion. Diabetes. 2000;49:409–417. doi: 10.2337/diabetes.49.3.409. [DOI] [PubMed] [Google Scholar]
- 35.Gray E., Muller D., Squires P.E., Asare-Anane H., Huang G.C., Amiel S., Persaud S.J., Jones P.M. Activation of the extracellular calcium-sensing receptor initiates insulin secretion from human islets of Langerhans: involvement of protein kinases. J. Endocrinol. 2006;190:703–710. doi: 10.1677/joe.1.06891. [DOI] [PubMed] [Google Scholar]
- 36.Hansen T., Drivsholm T., Urhammer S.A., Palacios R.T., Vølund A., Borch-Johnsen K., Pedersen O. The BIGTT test: a novel test for simultaneous measurement of pancreatic beta-cell function, insulin sensitivity, and glucose tolerance. Diabetes Care. 2007;30:257–262. doi: 10.2337/dc06-1240. [DOI] [PubMed] [Google Scholar]
Associated Data
This section collects any data citations, data availability statements, or supplementary materials included in this article.