

Abstract
Investigating, predicting, diagnosing and treating HIV-1-associated neurocognitive disorder (HAND) has been hindered by the lack of disease-related molecular markers. In this study, plasma from rhesus monkeys (n=6), before and after infection with simian immunodeficiency virus (SIV), was profiled to obtain differential fingerprints in protein expression during SIV-induced central nervous system (CNS) disease. A quantitative proteomic analysis was performed by means of isobaric tag for relative and absolute quantification (iTRAQ) labeling, using multidimensional liquid chromatography tandem mass spectrometry (LC-MS/MS) run on a linear ion trap mass spectrometer in an integrated mode comprising of pulsed-Q-dissociation (PQD) and CID. Amongst a panel of proteins showing differential expression following SIV infection, we identified afamin, a member of the albumin superfamily, to be significantly down regulated after infection. Validation by western blot confirmed this observation, and given its potential implication in neuroprotection by transport of alpha-tocopherol (αTocH), provides new avenues into further understanding HIV induced CNS disease. iTRAQ based LC-MS/MS provides a valuable platform for plasma protein profiling and has important implications in identifying molecular markers relevant for the pathogenesis of neurodegenerative diseases. Using such an approach, we show its successful application in identifying differential fingerprints in SIV/HIV induced CNS disease.
Keywords: Afamin, SIV, HIV, Proteomics, Vitamin E, rhesus monkey
1. INTRODUCTION
A critical gap in the field of HIV associated neurological disease (HAND, also known as neuroAIDS) research is the identification of molecules that will provide valuable insights into mechanisms of neuropathogenesis. While such indicators of disease can have great utility in diagnostic, prognostic, and therapeutic determinations, the unique cellular and phenotypic complexity of the brain has hindered their identification in neurological disorders. Advances have been made both in neuroimaging techniques that assess regional structure, function and biochemistry of the brain, as well as in methods to identify biochemical indices of brain dysfunction, measured in body fluids such as cerebrospinal fluid (CSF) and plasma and urine 1-4. These approaches however have achieved limited success.
Emerging technologies such as proteomics have garnered immense interest in terms of its applications and offer complementary insight into the full complexity of the disease phenotype. Although the CSF, which surrounds the brain and spinal cord, may provide an ideal platform to understand the ongoing pathological processes associated with neurodegeneration 5, 6, the utility of the CSF proteome poses a daunting task given the limited amount of protein and its relative unavailability. By contrast, plasma serves as much more accessible biofluid and can contain markers relevant for prediction, diagnosis, and/or further investigation into the cause and effects of neurological disorders.
Despite the ease in obtaining the plasma, a major challenge associated with its analysis is that it is a highly complex proteome. The relatively high expression of abundant proteins like serum albumin and immunoglobulins, which together constitute more than 85% of the total protein content, mask the lower abundant proteins, which may be potential biomarkers. To aid in this approach, research often involves removal of these high abundant proteins via affinity depletion columns.
Another necessary and informative step in protein biomarker discovery is to detect quantitative alterations of a protein under different disease and control settings. Development of novel quantitative proteomics approaches has greatly enhanced proteomics technologies. These methods include the use of chemical reactions to introduce isotopic tags at specific functional groups on peptides or proteins, such as ICAT 7 and iTRAQ 8, followed by multidimensional LC and MS/MS analysis. While ICAT labels the side chains of cysteinyl residues in two reduced protein samples using light or heavy reagents, iTRAQ is based on chemically tagging of the N-terminus of peptides generated from protein digests that have been isolated from samples in different disease and control groups. The iTRAQ technique allows for the identification and quantification of peptides as well as comparison of up to eight conditions simultaneously. However the ability to use high sensitivity mass spectrometers to examine such samples has been a technical challenge, obtaining high sensitivity with this method has been an issue. The recent application of PQD on linear ion traps (LTQ) is a potential solution 9-11, and PQD combined with CID, also known as collision-associated dissociation has been proposed to enable improved abilities to indentify and quantify proteins 12.
Nonhuman primate models are an obvious alternative to studying neuroAIDS directly in humans 13. SIV infects monkeys and causes and AIDS-like disease, and has many similarities in CNS involvement and neuropathology. Particularly useful experimentally is a subset of SIV-infected rhesus monkeys that manifest a relatively rapid disease course, and develop a high rate of CNS disease 14. A major advantage of studying disorders of the brain and other pathophysiological aspects in animal models is the greater control of the laboratory environment, minimizing confounds and the number of samples. Even more important is the ability to obtain samples especially biofluids from the same individual before and after infection.
The multiplexing ability afforded by the iTRAQ reagents is ideally suited for our study because it provides us with a means to perform a proteomics analysis of paired samples before and after infection and compare all data to a common standard. Using such a setting, and employing a five-plex approach with a hybrid PQD/CID strategy on an LTQ, we analyzed immunodepleted plasma samples from six monkeys that developed SIV-induced CNS disease both before and three months after infection revealing significant changes in the plasma proteome.
2. EXPERIMENTAL PROCEDURES
2.1 Rhesus macaques
Rhesus monkeys (Macaca mulatta), free of type D simian retroviruses, Cercopithecine Herpesvirus 1, simian T-cell leukemia virus type 1, and SIV, were acquired from Charles River (Key Lois, Florida) and Covance (Alice, Texas) and used for the experiments under IACUC approval from The Scripps Research Institute, following NIH/USDA guidelines. Rhesus monkeys were infected with a derivative of SIVmac251 as described in our previous studies 15, 16.
2.2 Rhesus monkey plasma collection
Plasma samples were collected under ketamine anesthesia. Blood was immediately placed in EDTA-treated tubes, kept on ice, and within 1 hour centrifuged for separation from cells and erythrocytes. Plasma was aliquoted and stored at −80° C until use.
2.3 Immunodepletion
For proteomic analysis, plasma samples from a group of monkeys that developed SIVE were subjected to immunodepletion of highly and medium abundant serum proteins using the IgY/SuperMix liquid chromatography columns (Genway Bio, San Diego, CA), which comprised of an LC10 (12.7 × 79 mm) and an LC2 (6.4 × 63 mm) columns with a capacity of 0.22 ml of plasma per cycle and optimized buffers for sample loading, washing, eluting and regenerating. Prior to chromatography samples were diluted 1:3 with dilution buffer (10 mM Tris-HCl, 0.15 M NaCl, pH 7.4) and filtered through 0.22 μm spin filters (Corning Life Sciences, Wilkes Barre, PA). Samples were then loaded at a flow rate of 0.5 mL/min and immunodepletion was performed with the two columns connected linearly using an Akta Purifier FPLC (GE Healthcare, Uppasala, Sweden) as follows: flow through fractions were collected for the first 15 min at 0.5 mL/min and at 1 mL/min for the next 10 min followed by concentration using Amicon Ultra-15 centrifugal filters (Millipore, Billerica, MA). The columns were disconnected and treated with stripping buffer (0.1M glycine-HCl pH 2.5) to remove the bound proteins. Following this, the columns were neurtralized with neutralization buffer (0.1 M Tris-HCl pH 8.0) and re-equilibrated with dilution buffer. Protein concentration of the flow through fraction was determined by Lowry’s method using BSA as a standard.
2.4 iTRAQ analysis
A pooled sample was made of the immunodepleted fractions from all samples. The proteins in each individual sample and the pool were digested with trypsin and labeled separately using the iTRAQ (Applied Biosystems, Foster City, CA) standard protocols for the 8-plex kit. For each group, the uninfected samples were labeled with 113, 117; infected with 115, 119 and the pool with 121. Samples from each group were combined together and subjected to individual off-line cleanup and fractionation using a strong cation exchange cartridge. Ammonium acetate buffer at 0, 10, 20, 60, 100, 500 mM, and finally the Elute Buffer (iTRAQ kit), was used to elute the peptides in 6 different fractions. Nano-LC ESI-MS/MS analysis was performed using PQD on the LTQ linear ion trap mass spectrometer (Thermo Scientific, Waltham, MA). For all experiments, 0.5 mg of total peptides from the standard iTRAQ reagent mixture was loaded onto a reverse phase column.
The nano-columns were fabricated using a fused silica capillary (75 μm internal diameter (ID), 360 μm outer diameter, 14 cm length) which was pulled to a narrow tip with the ID smaller than 5 μm using a Sutter P-2000 laser puller (Sutter Instrument Company, Novato, CA) and packed with 5 μm Zorbax SB-C18 packing material (Agilent Technologies, Santa Clara, CA). This served both as the analytical column and a nano-electrospray tip. The fractionated peptide mixtures were loaded at 80 μL/min onto a C18 trap cartridge using an Agilent 1100 m-well autosampler through a micro column switching value. Once the C18 trap cartridge was loaded, the column-switching valve was used to bring the nano-pump directly in line with the nano-column and the trap cartridge. This fully automated system ensures reproducible loading of samples using the autosampler that as a significant dead-volume which prevents it from being directly used at the 300 nL per minute flow rate. The gradient consisted of 5% acetonitrile (Fisher Scientific) for 30 min followed by a gradient to 35% acetonitrile for 85 min, 55% acetonitrile for 10 min, 70% acetonitrile for 15 min and re-equilibrated with 5% acetonitrile for 15 min. A wash step was included after each sample analysis to prevent any carryover.
An MS scan range of 400–2000 m/z was employed in the positive ion mode, followed by data-dependent MS/MS using both PQD and CID on the top three ions in the order of abundance. Both CID and PQD was used because while PQD is the best technique for the observation of the small molecular weight reporter ions from an iTRAQ experiment, the fragmentation patterns are compromised when compared to CID. The combination of the two techniques gives us robust peptide identification and quantitative information from the reporter ions. Settings specific to PQD were a Q activation setting optimized at 0.620, normalized collision energy of 35 and an activation time of 0.1 ms. The isolation width was set at 4.0 m/z, and the minimum precursor intensity for MS/MS acquisition was set to 10,000 counts. Other relevant instrumental settings were: capillary temperature, 180° C; source voltage, 2.0 V. Maximum fill time for MS scans was 50 microseconds, and the maximum fill time for each MS/MS microscan was 100 microseconds. For CID, normalized collision energy of 35, a Q of 0.250 and an activation time of 30 ms was employed. Dynamic exclusion was used to reduce the redundancy of the data. A repeat count of 2, a repeat duration of 30 seconds, an exclusion list size of 50 and exclusion duration of 60 seconds was used.
2.5 Analysis of MS/MS Data
Proteins from the NCBInr database (20080628) using the primates taxonomy were searched with Mascot 2.2 search engine (Matrix Science Limited, UK) with quantitation mode turned on. This mode directly provides the ratio of the iTRAQ 8-plex reporter ions from the data. For the summary report, the following quantitation options were selected: weighted protein ratio type, normalization was set to median ratio and automatic outlier removal was selected. Fixed modifications were set to Methylthio (C), iTRAQ 8plex (N-term) and iTRAQ 8plex (K), while variable comprised of iTRAQ_variable, under variable mode and iTRAQ 8plex (Y) modifications. Tolerances of 2.0 Da for precursor ions and 0.8 Da for fragment ions were used with a trypsin restriction and the maximum number of missed cleavages specified as 2. The searches were done by merging the data from the six LC-MS/MS runs on all the salt steps using Mascot Daemon (Matrix Science Limited, version 2.2.3). A Mascot score of 35 was used as the threshold peptide ion score for identification based on a <1% false discovery rates achieved using a search against a reversed concatenated decoy protein database. The minimum thresholds required for data quantitation comprised of the following: minimum precursor charge: 1; isolated precursor: no; minimum at (1): 0.0; peptide threshold type: at least homology and 0.05; exclusion: iTRAQ_variable.
2.6 Western blot analysis
SDS-PAGE electrophoresis was performed using NuPAGE gel system (Invitrogen, Carlsbad, CA) in 4–12% gradient gels under reducing conditions. For western blot analyses, 10 μg of plasma proteins were loaded per lane. Electrophoresis followed by transfer and immunodetection was performed as previously described 17. Nonspecific antibody binding was blocked using 5% nonfat dried milk for 1 hr at room temperature. Immunoblotting was carried out with antibodies against afamin (0.5 μg/mL, Genway Bio), followed by secondary antibody (1:20,000 HRP conjugated anti rabbit IgG; GE Healthcare, Little Chalfont, UK). Blots were developed with 1:1 solution of Super Signal West Pico Chemiluminescent Substrate and Luminol/Enhancer (Thermo Fisher Scientific, Rockford, IL, USA).
2.7 Measurement of alpha-tocoherol levels
Levels of alpha tocopherol (αTocH) in plasma samples were measured at the Nebraska Medical Center special chemistry laboratory using a high performance liquid chromatography (HPLC) method derived from a published method 18. Briefly, αTocH was extracted into 200 μL hexane after protein precipitation of the plasma sample using retinyl acetate as the internal standard. The extract was dried, reconstituted in methanol for injection, and analyzed by reverse phase liquid chromatography using the following conditions: column= C18 uBondapak, 3.9 mm × 30 cm, 10 μm (Waters Corp., Milford, MA); mobile phase = methanol:water (95:5); flow rate = 2.4 mL/min. αTocH was detected spectrophotometrically at 292 nm. Standards were calibrated using a National Institute of Standards and Technology αTocH standard 968d. Quantitative analysis was based on peak height ratio to internal standard peak height.
3. RESULTS
Our subjects consisted of six rhesus monkeys who, following infection with SIV, developed simian AIDS manifested largely by CNS symptomatology, and proven to have SIV encephalitis (SIVE) following necropsy. Our experimental design was to compare the plasma proteome in each animal before SIV infection to that after SIV infection. In order to avoid findings associated with severe disease, we analyzed samples two weeks prior to sacrifice, at a time point that it was not evident that the animals would require termination due untreatable disease.
LC-ESI-MS/MS signal suppression from high abundance proteins is a significant hindrance in analyzing complex biofluids such as plasma. Hence, immunoaffinity depletion of abundant proteins has proven to be one of the most effective approaches for overcoming the wide dynamic range of protein concentration, as well as enabling the detection of lower abundant proteins (LAP). Following high abundant protein (HAP) removal, the next level of abundant protein, medium abundant proteins (MAP), becomes an obstacle to access LAP, where the majority of biologically interesting and clinically important biomarkers reside. To circumvent this, we subjected samples to partitioning using IgY immunoaffinity columns connected in tandem, capable of depleting 14 HAP and 77 MAP respectively. The resulting immunodepleted flow-through fractions were concentrated and subjected to iTRAQ analysis.
A standard pool comprising of a mixture of equal amounts of protein derived from all samples served as an internal control. 100 μg of each sample and the standard pool was reduced, alkylated and trypsin digested. The tryptic digests were labeled with individual iTRAQ reagents, pooled and subjected to strong cation exchange (SCX) fractionation prior to reverse phase LC-ESI-MS/MS analysis. Three sets of experiments were performed, each with two samples from two monkeys plus the internal control, resulting in a 5-plex analysis (Figure 1).
Figure 1.

Experimental design for immunodepletion of plasma from rhesus monkeys before and after infection with SIV followed by labeling with iTRAQ reagents. A 5-plex strategy was adapted for protein identification and quantification by LC-MS/MS analysis run on a linear ion trap in a PQD/CID hybrid mode. iTRAQ reagents 113, 117 were used to label the pre-infection samples (indicated by U); 115, 119 the post-infection samples (indicated by I) and 121 for the pool. The numbers refer to the m/z of the reporter moiety on the different iTRAQ tags.
For proteomic analysis employing tandem mass spectrometry, linear ion trap instruments provide unsurpassed sensitivity but unreliably detect low mass peptide fragments, precluding their use with iTRAQ reagent-labeled samples. However, introduction of LTQ-PQD MS/MS operating mode, that functions on careful tuning of relative collision energy necessary for fragmenting iTRAQ reagent labeled peptides, has made such analysis possible. Additionally, the integration of PQD and CID fragmentation methods into a PQD-CID hybrid mode should further enhance the sensitivity and accuracy of an iTRAQ based proteomic workflow 12. Employing such settings, we identified 72, 76 and 77 proteins from the three 5-plex runs (Supplemental Table 1). Of these, 30 proteins were quantified in all samples (Table 1).
Table 1.
Proteins identified and relative iTRAQ ratios from the three runs along with the average fold change between pre- and post-infection. Each run comprised of two animals before (indicated by −) and after infection (indicated by +) along with the standard pool samples (which was labeled with 121); ratios in each run were determined by normalizing to the 121 signal. The numbers on the top panel represent the animals used in this study. The NCBI protein sequence record GI (GenInfo Identifier) number for each protein is listed
| Run 1 | Run 2 | Run 3 | ||||||||||||
|---|---|---|---|---|---|---|---|---|---|---|---|---|---|---|
| Protein Identified |
GI# | 427 (−) |
494 (−) |
427 (+) |
494 (+) |
521 (−) |
523 (−) |
521 (+) |
523 (+) |
553 (−) |
557 (−) |
553 (+) |
557 (+) |
Fold change |
| Vitamin D binding protein |
109074554 | 0.812 | 1.079 | 1.166 | 1.367 | 0.235 | 0.385 | 0.774 | 0.839 | 0.489 | 0.540 | 0.693 | 0.739 | 1.570 |
| Inter-alpha (globulin) inhibitor H3 |
109039132 | 1.097 | 0.655 | 0.315 | 1.128 | 0.481 | 0.637 | 1.608 | 1.023 | 0.399 | 0.478 | 1.013 | 0.697 | 1.544 |
| Serine (or cysteine) proteinase inhibitor, clade A, member 7 |
109131783 | 0.583 | 0.762 | 0.898 | 1.000 | 0.798 | 0.746 | 1.062 | 1.882 | 1.131 | 1.038 | 1.035 | 1.675 | 1.493 |
| Serum amyloid P component |
576259 | 0.683 | 0.756 | 0.977 | 1.060 | 0.811 | 1.061 | 1.421 | 1.708 | 0.748 | 0.896 | 0.957 | 0.950 | 1.427 |
| Fibrinogen, alpha polypeptide isoform 2 |
109075955 | 1.953 | 0.777 | 0.694 | 1.871 | 1.363 | 0.751 | 2.826 | 0.888 | 0.806 | 0.255 | 1.676 | 0.275 | 1.394 |
| Fibrinogen alpha chain |
85701319 | 0.629 | 0.395 | 0.842 | 0.652 | 0.483 | 0.378 | 1.982 | 0.915 | 2.635 | 1.768 | 2.455 | 1.659 | 1.353 |
| Extracellular matrix protein 1 |
109016069 | 1.021 | 1.004 | 2.323 | 0.905 | 0.916 | 0.878 | 1.192 | 0.992 | 1.184 | 0.641 | 0.572 | 1.596 | 1.343 |
| Unnamed protein product |
36573 | 0.885 | 0.774 | 0.534 | 0.903 | 0.666 | 0.535 | 1.391 | 0.850 | 0.592 | 0.598 | 1.067 | 0.645 | 1.331 |
| Serpin peptidase inhibitor, clade A |
109084779 | 1.596 | 0.369 | 0.570 | 1.015 | 0.235 | 0.385 | 0.774 | 0.839 | 0.489 | 0.540 | 0.693 | 0.739 | 1.281 |
| Complement C9 |
109077053 | 1.687 | 0.852 | 0.465 | 0.379 | 0.663 | 0.669 | 1.373 | 1.341 | 0.897 | 1.185 | 1.819 | 2.245 | 1.280 |
| Clusterin | 55846712 | 0.782 | 0.797 | 1.332 | 1.104 | 0.892 | 0.792 | 1.164 | 1.047 | 1.008 | 0.919 | 1.078 | 0.891 | 1.275 |
| Alpha 2-HS glycoprotein |
109042277 | 0.861 | 1.453 | 3.894 | 1.165 | 1.369 | 0.489 | 0.796 | 0.588 | 2.039 | 0.808 | 1.329 | 0.851 | 1.229 |
| Alpha 2 macroglobulin |
109095556 | 1.090 | 1.039 | 1.357 | 1.334 | 0.474 | 0.850 | 0.874 | 0.456 | 1.010 | 1.365 | 0.956 | 1.170 | 1.055 |
| C-type lectin domain family 3, member B |
156627579 | 1.147 | 1.234 | 1.757 | 0.867 | 1.555 | 1.230 | 1.039 | 1.263 | 2.178 | 1.582 | 2.722 | 1.337 | 1.007 |
| Complement C1 |
109095381 | 1.221 | 1.480 | 1.635 | 1.041 | 0.915 | 0.863 | 0.860 | 0.842 | 0.993 | 0.889 | 0.840 | 1.019 | −1.020 |
| Unnamed protein product |
90085196 | 0.649 | 1.200 | 0.839 | 0.827 | 1.401 | 1.032 | 0.950 | 1.284 | 1.298 | 1.208 | 1.392 | 1.212 | −1.044 |
| Hypothetical protein |
55725434 | 1.302 | 1.820 | 0.675 | 1.821 | 0.401 | 0.482 | 0.746 | 0.541 | 0.903 | 1.149 | 1.030 | 0.912 | −1.058 |
| Heparin cofactor II isoform 1 |
109093375 | 0.954 | 1.012 | 0.975 | 0.701 | 0.972 | 0.794 | 0.980 | 1.185 | 1.128 | 1.281 | 0.944 | 1.016 | −1.059 |
| Chain A, The S Variant Of Human Alpha1- Antitrypsin |
223039 | 1.308 | 1.839 | 0.663 | 1.832 | 0.399 | 0.481 | 0.745 | 0.539 | 0.893 | 1.139 | 1.019 | 0.906 | −1.062 |
| Amine oxidase Cu containing 3 |
109115435 | 0.860 | 1.704 | 1.491 | 1.095 | 0.858 | 1.148 | 0.877 | 0.846 | 2.003 | 1.753 | 1.670 | 1.514 | −1.111 |
| Serine proteinase inhibitor, clade A, member 1 |
109084715 | 1.391 | 1.553 | 0.597 | 1.540 | 0.415 | 0.581 | 0.697 | 0.522 | 0.881 | 0.959 | 0.832 | 0.842 | −1.149 |
| Coagulation factor II |
189011659 | 0.658 | 1.079 | 0.253 | 0.205 | 0.929 | 0.931 | 1.032 | 1.649 | 1.160 | 1.183 | 0.892 | 1.086 | −1.161 |
| Lumican isoform 1 |
109098188 | 2.472 | 2.216 | 2.528 | 1.612 | 1.385 | 1.478 | 1.908 | 0.710 | 1.581 | 1.815 | 0.904 | 1.616 | −1.180 |
| Insulin-like growth factor binding protein, acid labile subunit |
109127203 | 1.067 | 1.173 | 1.989 | 0.808 | 1.771 | 1.498 | 0.997 | 1.300 | 1.951 | 2.195 | 1.159 | 1.845 | −1.192 |
| Peptidoglycan recognition protein L isoform 1 |
109123738 | 0.995 | 0.677 | 0.822 | 0.408 | 0.932 | 0.920 | 0.767 | 0.767 | 0.618 | 0.878 | 0.516 | 0.904 | −1.200 |
| Apolipoprotei n A-IV |
461521 | 1.296 | 1.263 | 1.383 | 0.913 | 2.052 | 1.167 | 1.143 | 0.572 | 0.921 | 1.564 | 1.599 | 1.046 | −1.241 |
| Angiotensinog enisoform 1 |
109020030 | 1.327 | 0.876 | 1.144 | 0.801 | 1.658 | 1.579 | 0.857 | 1.483 | 1.543 | 1.347 | 0.694 | 1.536 | −1.279 |
| Complement C3 |
109123402 | 1.210 | 1.495 | 0.235 | 0.512 | 3.204 | 2.092 | 1.783 | 1.681 | 1.013 | 1.062 | 0.674 | 1.000 | −1.712 |
| Histidine rich glycoprotein |
109042262 | 1.350 | 2.594 | 0.731 | 0.588 | 3.098 | 3.779 | 1.315 | 1.692 | 2.819 | 2.813 | 1.810 | 0.911 | −2.330 |
| Afamin | 109074517 | 1.507 | 3.205 | 0.637 | 0.664 | 1.975 | 2.247 | 0.597 | 1.154 | 1.747 | 2.150 | 0.796 | 0.774 | −2.770 |
For a protein to be potentially linked to disease, there must be a biologically relevant level at which it is changed during the disease state compared to normal. While this level is in most cases unknown, a cutoff of 1.5–2 fold is frequently utilized in variety of studies. Here, we set a criterion of 1.5 fold as a cutoff. Adapting this criterion and quantification performed based on the unique peptides identified, we found five proteins whose level changed by at least 1.5 fold: two were increased with disease development: vitamin D binding protein and inter-alpha (globulin) inhibitor H3, whereas three were decreased: afamin, histidine rich glycoprotein and complement C3. Statistical analysis, using paired t-tests and the Bonferroni correction for multiple testing, revealed that three of these proteins reached significance: vitamin D binding protein, histidine rich glycoprotein and afamin (Table 2).
Table 2.
Plasma proteins significantly up and down regulated after SIV infection. The average iTRAQ ratios (± standard deviation) from the six monkeys before and after SIV infection were used to compute the fold changes and significance (as determined by a paired student’s t-test). For significance, alpha was set at 0.05; since five tests were performed, using the Bonferroni correction a p value of <0.01 was necessary for reaching significance
| Protein identified | iTRAQ ratios pre-infection |
iTRAQ ratios post-infection |
Fold change |
p-value |
|---|---|---|---|---|
| Vitamin D binding protein |
0.59±0.31 | 0.93±0.27 | +1.57 | 0.006 |
| Histidine rich glycoprotein |
2.74±0.80 | 1.17±0.51 | −2.33 | 0.001 |
| Afamin | 2.14±0.59 | 0.77±0.20 | −2.77 | 0.003 |
The identification of afamin, a member of the albumin superfamily, was intriguing due to its implication in neuroprotection by transport of αTocH, a member of the vitamin E family 19. Accordingly, we next validated the proteomic data by performing Western blot analysis. Indeed, a significant down regulation was found, confirming our proteomics analysis (Figure 2A). To evaluate if SIV infection in general had an effect on the downregulation, we performed Western blot analysis on plasma proteins from SIV infected monkeys that did not have CNS disease. No change in afamin expression was observed (Figure 2B) thus implying that the change is linked to the presence of SIV-induced CNS disease. Finally, since we hypothesized that it is the binding and transport of αTocH by afamin that may influence neuroprotection, we measured the levels of αTocH by HPLC analysis on the plasma samples. αTocH showed a general decrease in the post-infection samples from both groups of animals (Figure 3A and 3B), consistent with others’ observations that there is a decrease in vitamin E levels in HIV positive individuals20.
Figure 2.

Western blot analysis using anti-afamin antibody on 10 μg of total protein from SIVE (A) and SIV (B) plasmas from six monkeys before (indicated by −) and after infection (indicated by +). Loading control was confirmed by Ponceau S staining of membranes and data was normalized to an unknown band of lower molecular weight expressed equally in all samples (not shown). The average of the normalized levels of Afamin expression from the 6 monkeys from the two groups before and after infection are shown as a bar graph adjacent to the respective western blots. Data are represented as Mean±SEM. A paired t-test was used to compute the statistical significance.
Figure 3.
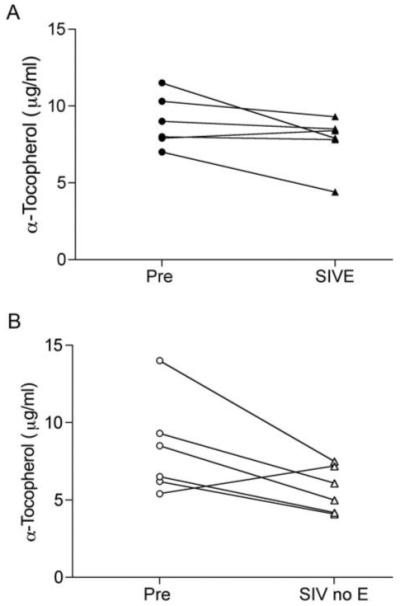
Plasma αTocH levels as measured by HPLC analysis. (A) SIVE monkeys before (black circles) and after infection (black triangles). (B) SIV monkeys before (white circles) and after infection (white triangles).
4. DISCUSSION
Identification of potential molecular markers that aid in elucidating the etiopathology associated with neurodegenerative diseases such as HIV induced neurodegeneration, are essential to facilitate disease diagnosis, monitor disease progression and assess response to existing and future treatments. Here, we hypothesized that a quantitative iTRAQ based proteomics approach would allow us to identify differential fingerprints in the plasma of monkeys, comparing immunodepleted samples before and after infection with SIV. Indeed, a number of significant differences were found. Of the differentially expressed proteins, we focused on afamin, a member of the albumin superfamily 21, which was significantly down regulated after SIV infection.
Interestingly a recent study employing 2D-DIGE based mass spectrometry also found afamin to be down regulated (by 2.25 fold, comparable to our 2.77 fold) in immunodepleted sera that when comparing a group of HIV infected individuals with dementia to HIV infected individuals without CNS disease 22. In our study, we also performed Western blot analysis using both immunodepleted and non-depleted plasmas from monkeys before and after SIV infection, which indeed revealed down-regulation of afamin, validating our proteomic data. Furthermore, analysis of plasma from monkeys that did not develop CNS disease revealed no alterations in the expression levels of afamin thus implying that the change not due to infection itself, and thus the decreased in afamin is linked to the presence of CNS disease
Several other proteomic studies have identified afamin as a potential biomarker in different disorders. Proteomic profiling of serum found afamin to be down regulated in patients with ovarian cancer 23. 2-DE proteomic analysis on serum from patients with congenital disorders of glycosylation found down regulation of afamin when compared to the normal controls 24. Another 2-DE based analysis afamin to be upregulated of maternal plasma from pregnant women with down syndrome fetuses in second trimester of pregnancy identified as compared to the controls with normal fetuses 25. Proteome analysis of human follicular fluid revealed higher concentrations of afamin in the follicular fluid compared to serum thus proposing its significant role in folliculogenesis 26. Thus alterations in afamin are not specific for HAND or these other conditions, but rather can be integrated with other measures in potential diagnostic, prognostic, and etiologic studies.
Afamin has been shown to be a specific binding protein for vitamin E 27. The central role of vitamin E, comprising a set of eight related tocopherols and tocotrienols, is to maintain physiological cellular and tissue function via their antioxidant properties, and αTocH is the dominant biologically active form of vitamin E. In line with αTocH binding properties of afamin and neuroprotective properties of αTocH, it has been shown that αTocH-loaded afamin displays neuroprotection on primary neuronal cultures challenged by hydrogen peroxide or amyloid β25–35 28.
To investigate the potential relationship of αTocH to our proteomic results on afamin, we measured the levels of αTocH via HPLC analysis in the plasma samples. The levels in five of the six monkeys that developed SIVE indeed dropped, but to varying degrees. However an identical result was found in animals that did not develop CNS disease. Thus the decrease in αTocH correlated with infection itself and not the development of CNS disease, in contrast to afamin that was decreased only in the animals that developed CNS disease. The independence of the levels of afamin and αTocH from each other in the plasma has indeed been reported by others 27.
Whether the decrease in afamin as well as αTocH in the plasma of monkeys with CNS disease reflects similar changes in the brain was not assessed in this study, as appropriate samples were not available for analysis. However the cerebrospinal fluid (CSF) of HIV infected individuals was assessed by others for vitamin E levels in relationship to changes in cognitive status 29. In this study, changes in CSF vitamin E were not associated directly with cognitive disorders, but increased CSF vitamin E preceded worsening of cognitive status. Whether this reflected an increased in the brain antioxidant defenses in the setting of incipient damage, or other potential causes, is unknown. In any case knowledge of the levels of αTocH and other forms of vitamin E in the brain itself during SIV/HIV induced CNS disease is a gap in our current knowledge.
Although advances in the search for biofluid-based biomarkers for neurodegenerative and other diseases have been made on several frontiers, limited success has been met. Amongst the emerging technologies, mass spectrometry based proteomics to assess CSF and plasma has greatly hastened the unbiased and high throughput for novel proteins as indicators of disease mechanisms and progression in a global manner. Further development of quantitative proteomics via differential tagging with isotopic reagents like ICAT and iTRAQ followed by multidimensional LC-MS/MS analysis has emerged as one of the most powerful methodologies in the quest for disease-linked proteins. Here we show the first successful application of the hybrid PQD/CID mode for iTRAQ analysis on an LTQ to identify disease-induced alterations in a disease model. PQD fragments peptides during MS/MS via a different mechanism than traditional CID, enabling the routine and reliable detection of ions. Peptide fragmentation occurs on a similar time scale compared to CID, thus producing high quality spectra peptide identification by sequence database searching.
Our cumulative data reveal that the antioxidant αTocH is decreased in the plasma following SIV infection, and that afamin is decreased in those infected monkeys that develop encephalitis. While afamin binds αTocH and other vitamin E molecules, the primary plasma transport of vitamin E is by lipoproteins 30. However other molecules are crucial in the transport of vitamin E across barriers and into cells 31. Interestingly a recent study has revealed that afamin is synthesized in the endothelial cells of the blood-brain barrier (BBB) and plays a role in αTocH transport across an in vitro model of the BBB 19. Given the neuroprotective role of αTocH-afamin during oxidative stress, further characterization of the role of afamin in SIV/HIV associated neurodegeneration, where the BBB can be compromised 32-35, could reveal mechanistic clues for therapeutic intervention.
Supplementary Material
Acknowledgments
We thank Ewa Kalisiak for technical assistance. This is manuscript #04 from the UNMC CITN. This work was supported by NIH grants P30 MH062261, R01 MH073490 and P01DA026146.
Abbreviations
- α-TocH
alpha tocopherol
- BBB
blood brain barrier
- CID
collision induced dissociation
- CNS
central nervous system
- CSF
cerebrospinal fluid
- HAP
high abundant proteins
- HAND
HIV associated neurocognitive disorder
- HIV
human immunodeficiency virus
- ICAT
isotope coded affinity tag
- ITRAQ
isobaric tag for relative and absolute quantification
- LAP
low abundant proteins
- LC-ESI-MS/MS
liquid chromatography electrospray ionization tandem mass spectrometry
- MAP
medium abundant proteins
- PQD
pulsed Q-dissociation
- SCX
strong cation exchange
- SIV
simian immunodeficiency virus
- SIVE
SIV encephalitis
Footnotes
Competing Interests
The authors declare that they have no competing interests.
References
- 1.Clark CM, Davatzikos C, Borthakur A, Newberg A, Leight S, Lee VM, Trojanowski JQ. Biomarkers for early detection of Alzheimer pathology. Neurosignals. 2008;16(1):11–8. doi: 10.1159/000109754. [DOI] [PMC free article] [PubMed] [Google Scholar]
- 2.Galasko D. Biomarkers for Alzheimer’s disease--clinical needs and application. J Alzheimers Dis. 2005;8(4):339–46. doi: 10.3233/jad-2005-8403. [DOI] [PubMed] [Google Scholar]
- 3.Shaw LM, Korecka M, Clark CM, Lee VM, Trojanowski JQ. Biomarkers of neurodegeneration for diagnosis and monitoring therapeutics. Nat Rev Drug Discov. 2007;6(4):295–303. doi: 10.1038/nrd2176. [DOI] [PubMed] [Google Scholar]
- 4.Sonnen JA, Keene CD, Montine KS, Li G, Peskind ER, Zhang J, Montine TJ. Biomarkers for Alzheimer’s disease. Expert Rev Neurother. 2007;7(8):1021–8. doi: 10.1586/14737175.7.8.1021. [DOI] [PubMed] [Google Scholar]
- 5.Simonsen AH, McGuire J, Hansson O, Zetterberg H, Podust VN, Davies HA, Waldemar G, Minthon L, Blennow K. Novel panel of cerebrospinal fluid biomarkers for the prediction of progression to Alzheimer dementia in patients with mild cognitive impairment. Arch Neurol. 2007;64(3):366–70. doi: 10.1001/archneur.64.3.366. [DOI] [PubMed] [Google Scholar]
- 6.Simonsen AH, McGuire J, Podust VN, Davies H, Minthon L, Skoog I, Andreasen N, Wallin A, Waldemar G, Blennow K. Identification of a novel panel of cerebrospinal fluid biomarkers for Alzheimer’s disease. Neurobiol Aging. 2008;29(7):961–8. doi: 10.1016/j.neurobiolaging.2007.01.011. [DOI] [PubMed] [Google Scholar]
- 7.Gygi SP, Rist B, Gerber SA, Turecek F, Gelb MH, Aebersold R. Quantitative analysis of complex protein mixtures using isotope-coded affinity tags. Nat Biotechnol. 1999;17(10):994–9. doi: 10.1038/13690. [DOI] [PubMed] [Google Scholar]
- 8.Ross PL, Huang YN, Marchese JN, Williamson B, Parker K, Hattan S, Khainovski N, Pillai S, Dey S, Daniels S, Purkayastha S, Juhasz P, Martin S, Bartlet-Jones M, He F, Jacobson A, Pappin DJ. Multiplexed protein quantitation in Saccharomyces cerevisiae using amine-reactive isobaric tagging reagents. Mol Cell Proteomics. 2004;3(12):1154–69. doi: 10.1074/mcp.M400129-MCP200. [DOI] [PubMed] [Google Scholar]
- 9.Armenta JM, Hoeschele I, Lazar IM. Differential Protein Expression Analysis Using Stable Isotope Labeling and PQD Linear Ion Trap MS Technology. J Am Soc Mass Spectrom. 2009 doi: 10.1016/j.jasms.2009.02.029. [DOI] [PubMed] [Google Scholar]
- 10.Bantscheff M, Boesche M, Eberhard D, Matthieson T, Sweetman G, Kuster B. Robust and sensitive iTRAQ quantification on an LTQ Orbitrap mass spectrometer. Mol Cell Proteomics. 2008;7(9):1702–13. doi: 10.1074/mcp.M800029-MCP200. [DOI] [PMC free article] [PubMed] [Google Scholar]
- 11.Griffin TJ, Xie H, Bandhakavi S, Popko J, Mohan A, Carlis JV, Higgins L. iTRAQ reagent-based quantitative proteomic analysis on a linear ion trap mass spectrometer. J Proteome Res. 2007;6(11):4200–9. doi: 10.1021/pr070291b. [DOI] [PMC free article] [PubMed] [Google Scholar]
- 12.Guo T, Gan CS, Zhang H, Zhu Y, Kon OL, Sze SK. Hybridization of pulsed-Q dissociation and collision-activated dissociation in linear ion trap mass spectrometer for iTRAQ quantitation. J Proteome Res. 2008;7(11):4831–40. doi: 10.1021/pr800403z. [DOI] [PubMed] [Google Scholar]
- 13.Burudi EM, Fox HS. Simian immunodeficiency virus model of HIV-induced central nervous system dysfunction. Adv Virus Res. 2001;56:435–68. doi: 10.1016/s0065-3527(01)56035-2. [DOI] [PubMed] [Google Scholar]
- 14.Westmoreland SV, Halpern E, Lackner AA. Simian immunodeficiency virus encephalitis in rhesus macaques is associated with rapid disease progression. J Neurovirol. 1998;4(3):260–8. doi: 10.3109/13550289809114527. [DOI] [PubMed] [Google Scholar]
- 15.Burdo TH, Marcondes MC, Lanigan CM, Penedo MC, Fox HS. Susceptibility of Chinese rhesus monkeys to SIV infection. Aids. 2005;19(15):1704–6. doi: 10.1097/01.aids.0000186823.76230.33. [DOI] [PubMed] [Google Scholar]
- 16.Watry D, Lane TE, Streb M, Fox HS. Transfer of neuropathogenic simian immunodeficiency virus with naturally infected microglia. Am J Pathol. 1995;146(4):914–23. [PMC free article] [PubMed] [Google Scholar]
- 17.Alirezaei M, Kiosses WB, Flynn CT, Brady NR, Fox HS. Disruption of neuronal autophagy by infected microglia results in neurodegeneration. PLoS ONE. 2008;3(8):e2906. doi: 10.1371/journal.pone.0002906. [DOI] [PMC free article] [PubMed] [Google Scholar]
- 18.Catignani GL, Bieri JG. Simultaneous determination of retinol and alpha-tocopherol in serum or plasma by liquid chromatography. Clin Chem. 1983;29(4):708–12. [PubMed] [Google Scholar]
- 19.Kratzer I, Bernhart E, Wintersperger A, Hammer A, Waltl S, Malle E, Sperk G, Wietzorrek G, Dieplinger H, Sattler W. Afamin is synthesized by cerebrovascular endothelial cells and mediates alpha-tocopherol transport across an in vitro model of the blood-brain barrier. J Neurochem. 2009;108(3):707–18. doi: 10.1111/j.1471-4159.2008.05796.x. [DOI] [PMC free article] [PubMed] [Google Scholar]
- 20.Pacht ER, Diaz P, Clanton T, Hart J, Gadek JE. Serum vitamin E decreases in HIV-seropositive subjects over time. J Lab Clin Med. 1997;130(3):293–6. doi: 10.1016/s0022-2143(97)90024-x. [DOI] [PubMed] [Google Scholar]
- 21.Lichenstein HS, Lyons DE, Wurfel MM, Johnson DA, McGinley MD, Leidli JC, Trollinger DB, Mayer JP, Wright SD, Zukowski MM. Afamin is a new member of the albumin, alpha-fetoprotein, and vitamin D-binding protein gene family. J Biol Chem. 1994;269(27):18149–54. [PubMed] [Google Scholar]
- 22.Rozek W, Horning J, Anderson J, Ciborowski P. Sera proteomic biomarker profiling in HIV-1 infected subjects with cognitive impairment. Proteomics - Clinical Applications. 2008;2(10–11):1498–1507. doi: 10.1002/prca.200780114. [DOI] [PMC free article] [PubMed] [Google Scholar]
- 23.Jackson D, Craven RA, Hutson RC, Graze I, Lueth P, Tonge RP, Hartley JL, Nickson JA, Rayner SJ, Johnston C, Dieplinger B, Hubalek M, Wilkinson N, Perren TJ, Kehoe S, Hall GD, Daxenbichler G, Dieplinger H, Selby PJ, Banks RE. Proteomic profiling identifies afamin as a potential biomarker for ovarian cancer. Clin Cancer Res. 2007;13(24):7370–9. doi: 10.1158/1078-0432.CCR-07-0747. [DOI] [PubMed] [Google Scholar]
- 24.Richard E, Vega AI, Perez B, Roche C, Velazquez R, Ugarte M, Perez-Cerda C. Congenital disorder of glycosylation Ia: new differentially expressed proteins identified by 2-DE. Biochem Biophys Res Commun. 2009;379(2):267–71. doi: 10.1016/j.bbrc.2008.12.036. [DOI] [PubMed] [Google Scholar]
- 25.Kolialexi A, Tsangaris GT, Papantoniou N, Anagnostopoulos AK, Vougas K, Bagiokos V, Antsaklis A, Mavrou A. Application of proteomics for the identification of differentially expressed protein markers for Down syndrome in maternal plasma. Prenat Diagn. 2008;28(8):691–8. doi: 10.1002/pd.2040. [DOI] [PubMed] [Google Scholar]
- 26.Angelucci S, Ciavardelli D, Di Giuseppe F, Eleuterio E, Sulpizio M, Tiboni GM, Giampietro F, Palumbo P, Di Ilio C. Proteome analysis of human follicular fluid. Biochim Biophys Acta. 2006;1764(11):1775–85. doi: 10.1016/j.bbapap.2006.09.001. [DOI] [PubMed] [Google Scholar]
- 27.Jerkovic L, Voegele AF, Chwatal S, Kronenberg F, Radcliffe CM, Wormald MR, Lobentanz EM, Ezeh B, Eller P, Dejori N, Dieplinger B, Lottspeich F, Sattler W, Uhr M, Mechtler K, Dwek RA, Rudd PM, Baier G, Dieplinger H. Afamin is a novel human vitamin E-binding glycoprotein characterization and in vitro expression. J Proteome Res. 2005;4(3):889–99. doi: 10.1021/pr0500105. [DOI] [PubMed] [Google Scholar]
- 28.Heiser M, Hutter-Paier B, Jerkovic L, Pfragner R, Windisch M, Becker-Andre M, Dieplinger H. Vitamin E binding protein afamin protects neuronal cells in vitro. J Neural Transm Suppl. 2002;(62):337–45. doi: 10.1007/978-3-7091-6139-5_32. [DOI] [PubMed] [Google Scholar]
- 29.Bandaru VV, McArthur JC, Sacktor N, Cutler RG, Knapp EL, Mattson MP, Haughey NJ. Associative and predictive biomarkers of dementia in HIV-1-infected patients. Neurology. 2007;68(18):1481–7. doi: 10.1212/01.wnl.0000260610.79853.47. [DOI] [PMC free article] [PubMed] [Google Scholar]
- 30.Behrens WA, Thompson JN, Madere R. Distribution of alpha-tocopherol in human plasma lipoproteins. Am J Clin Nutr. 1982;35(4):691–6. doi: 10.1093/ajcn/35.4.691. [DOI] [PubMed] [Google Scholar]
- 31.Yokota T, Igarashi K, Uchihara T, Jishage K, Tomita H, Inaba A, Li Y, Arita M, Suzuki H, Mizusawa H, Arai H. Delayed-onset ataxia in mice lacking alpha-tocopherol transfer protein: model for neuronal degeneration caused by chronic oxidative stress. Proc Natl Acad Sci U S A. 2001;98(26):15185–90. doi: 10.1073/pnas.261456098. [DOI] [PMC free article] [PubMed] [Google Scholar]
- 32.Annunziata P. Blood-brain barrier changes during invasion of the central nervous system by HIV-1. Old and new insights into the mechanism. J Neurol. 2003;250(8):901–6. doi: 10.1007/s00415-003-1159-0. [DOI] [PubMed] [Google Scholar]
- 33.Berger JR, Avison M. The blood brain barrier in HIV infection. Front Biosci. 2004;9:2680–5. doi: 10.2741/1427. [DOI] [PubMed] [Google Scholar]
- 34.Luabeya MK, Dallasta LM, Achim CL, Pauza CD, Hamilton RL. Blood-brain barrier disruption in simian immunodeficiency virus encephalitis. Neuropathol Appl Neurobiol. 2000;26(5):454–62. doi: 10.1046/j.1365-2990.2000.00275.x. [DOI] [PubMed] [Google Scholar]
- 35.Sasseville VG, Lackner AA. Neuropathogenesis of simian immunodeficiency virus infection in macaque monkeys. J Neurovirol. 1997;3(1):1–9. doi: 10.3109/13550289709015787. [DOI] [PubMed] [Google Scholar]
Associated Data
This section collects any data citations, data availability statements, or supplementary materials included in this article.