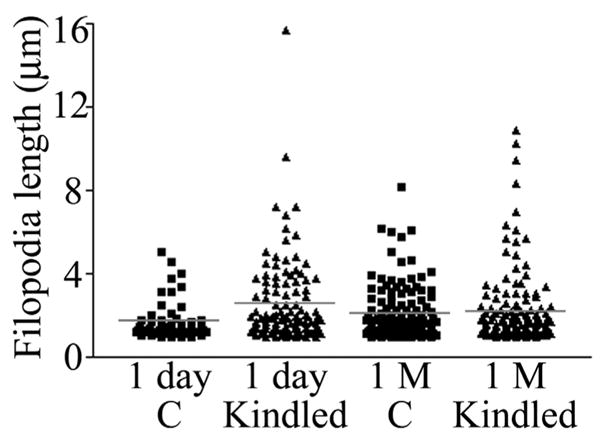
FIGURE 9.

Scatter plot depicting individual filopodia lengths from control animals (C) and kindled animals sacrificed 1 day and 1 month (1 M) after the last evoked seizure. Mean filopodia length (red bar) was significantly increased 1 day, but not 1 month, after the last evoked seizure. Notably, although mean filopodia length was increased, the longest filopodia were still only half the length of the longest filopodia observed in animals exposed to status epilepticus (compared with Fig. 3). [Color figure can be viewed in the online issue, which is available at www.interscience.wiley.com.]
