

Summary
Neuroblastoma (NB) is a heterogeneous pediatric tumor. To better understand the biological pathways involved in the development of high-risk neuroblastoma, we performed parallel global protein and mRNA expression profiling on NB tumors of stage4 MYCN-amplified (4+) and stage1 MYCN-not-amplified (1-) using isotope-coded affinity tags (ICAT) and Affymetrix U133plus2 microarray respectively. A total of 1461 proteins represented by 2 or more peptides were identified from the quantitative ICAT analysis, of which 433 and 130 proteins are up- or down-regulated respectively in 4+ tumor compared to the 1- tumor. Pathway analysis of the differentially expressed proteins showed the enrichment of glycolysis, DNA replication and cell cycle processes in the up-regulated proteins and cell adhesion, nervous system development and cell differentiation processes in the down-regulated proteins in 4+ tumor; suggesting a less mature neural and a more invasive phenotype of 4+ tumor. Myc targets and ribosomal proteins are over represented in the 4+ tumors as expected; functional gene sets reported to be enriched in neural and embryonic stem cells are significantly enriched in the 4+ tumor, indicating the existence of a stemness signature in MYCN-amplified stage 4 tumor. In addition, protein and mRNA expression are moderately correlated (r = 0.51, p < 0.0001), as approximately half of the up-regulated proteins in 4+ tumor have elevated mRNA level (n=208), and 1/3 of down regulated proteins have lower mRNA expression (n=47). Further biological network analysis revealed that the differentially expressed proteins closely interact with other proteins of known networks; the important role of MYCN is confirmed and other transcription factors identified in the network may have potential roles in the biology of NB tumor. We used global genomic and proteomic analysis to identify biologically relevant proteins and pathways important to NB progression and development that may provide new insights into the biology of advanced neuroblastoma.
Keywords: neuroblastoma, ICAT, pathway analysis, proteomics, genomics
Introduction
Neuroblastoma (NB) is one of the most common malignant solid tumors of childhood and arises from primitive cells of the sympathetic nervous systems. They are characterized by heterogeneity and diverse clinical behaviors, varying from spontaneous regression to malignant progression. Stage 1 disease is essentially curable, whereas patients with stage 4 disease, in particular those with MYCN-amplification, remain largely incurable despite advances in cancer therapeutics 1. Age, stage, MYCN-amplification, histology and ploidy of the tumor are clearly associated with poor prognosis. Genes such as NTRK1, NTRK2, ALK, BIRC5 and WSB1 have also been reported to associate with neuroblastoma prognosis 1-4. Several cytogenetic changes, including 2p24 amplification, 17q gain, 1p36 loss, and unbalanced 11q loss have been associated with a more aggressive neuroblastoma 1. During the past several years many studies utilized microarray-based high throughput technologies to investigate gene expression profiles and DNA copy number alterations in neuroblastoma 5-8. These studies identified prognostic markers and genomic alterations specific to high-risk neuroblastoma, and showed the capability of identifying signatures which predict patient outcome.
It has been noted that mRNA expression is not always indicative of corresponding protein expression since the abundance of specific proteins can be controlled by post-transcriptional translation and post-translational modifications 9, 10. Therefore, studies of global expression profiles of both mRNA and protein are necessary to reveal the important pathways for an enigmatic disease such as neuroblastoma. Quantitative proteomics has certain advantages over mRNA expression analysis, because it directly detects the actual biological effector molecules and should provide more accurate functional information about biological systems. In addition, direct quantitative analysis of protein expression is important, not only for the identification of clinically relevant biomarkers, but also for the biological investigation of cancers. Isotope-coded affinity tagging (ICAT) in combination with mass spectrometry allows accurate quantification and concurrent sequence identification of individual proteins in complex mixtures 11-16. In this study, the ICAT-based quantitative proteomic technology was used to compare the protein expression profiles of stage 4 MYCN-amplified (4+) and stage 1 MYCN-not-amplified (1-) neuroblastomas, for identification of the important biological pathways associated with high-risk disease. We also investigated the relative expression of the corresponding mRNA transcripts by examining the global mRNA expression change using Affymetrix U133 plus2 microarrays. Several differentially expressed proteins and mRNA were further validated on a larger panel of tumors. This combined quantitative mRNA/proteome approach enabled us to identify biologically relevant proteins and pathways important to the advanced neuroblastoma.
Materials and Methods
Tumor samples and preparation of RNA and protein
Two pretreated primary neuroblastoma samples from patients with tumors in stage I MYCN-not-amplified (1-) and stage IV MYCN-amplified (4+) were obtained from German Cancer Research Center, Heidelberg (DZNSG). The patient of stage 1- tumor was diagnosed at the age of 40 days with more than 5-year event-free survival while the patient of stage 4+ tumor was diagnosed at age of 19 months and died of disease in 14 months after diagnosis. These tumor samples were considered typical based on clinical presentation, presence of >70% tumor with no evidence of necrosis and high expression of known neuroblastoma genes such as PHOX2B, and high expression of MYCN for the amplified tumor. Additional 10 pretreated primary neuroblastoma samples from patients in stage 1- (n = 5) and 4+ (n = 5) were used for validation; their detailed clinical information is available in the Supplemental Table 1. Tumors were diagnosed as neuroblastoma by local centers experienced in the management of these cancers. Pretreatment tumor samples were snap-frozen in liquid nitrogen after removal. RNA preparation for microarray experiment was done as previously described 17. For protein sample preparation, the tumor tissues were lysed using a buffer containing 50 mM Tris-HCl (pH 7.4), 1% Triton X-100, and 1 mM EDTA with a proteinase inhibitor cocktail (Sigma-Aldrich, St. Louis, MO). The tissue lysates were homogenized using a potter and sonicated 5 times (10 sec each) (Branson digital sonifier 250, Danbury, CT) on ice, and centrifuged at 15000 × g for 15 min at 4°C. The supernatants were collected and desalted into 50 mM NH4HCO3, pH 8.3, using D-Salt Excellulose plastic desalting columns (Pierce, Rockford, IL). Protein concentration was determined using a BCA assay (Pierce, Rockford, IL). An aliquot of lysate containing 500 μg of solubilized protein from each tumor was lyophilized and stored at −80°C prior to cICAT labeling.
DNA microarray analysis
Biotinylated cRNA was synthesized and hybridized to Affymetrix Genechip human genome U133 plus 2.0 (Affymerix, Santa Clara, CA) according to the Affymetrix protocol. The CEL files were exported from Affymetrix GCOS software and normalized in dChip to the median intensity using the PM-only model 17. In case of multiple probe sets representing the same gene (unique GeneID), the median of intensity values was taken.
ICAT labeling
Equal amounts of protein (500 μg each) from stage 1- and stage 4+ tumors samples were labeled with the light (cICAT-12C9) and the heavy (cICAT-13C9) isotopic versions of the cICAT reagent (ABI, Framingham, MA), respectively, using the modified method described previously 14. Briefly, each sample was dissolved in 400 μL of 6 M Gdn·HCl in 50 mM Tris-HCl, pH 8.3, and reduced by adding 5 μL of 100 mM TCEP·HCl and boiling in a water bath for 10 min. Each reduced sample was transferred to 5 vials containing either cICAT-12C9 or cICAT-13C9 dissolved in 20 μL of CH3CN and incubated at 37°C for 2 h. The two samples were combined, buffer-exchanged into 50 mM NH4HCO3, pH 8.3, using D-Salt Excellulose plastic desalting columns (Pierce, Rockford, IL) and digested with trypsin (Promega, Madison, WI) overnight at 37°C, using an enzyme to protein ratio of 1:50 (w/w). The digestion was quenched by boiling the sample in a water bath for 10 min and adding PMSF to a final concentration of 1 mM.
Affinity purification and Strong cation exchange fractionation
UltraLink immobilized monomeric avidin columns with 1.5 mL bed volume were slurry-packed in glass Pasteur pipettes and equilibrated with 2×PBS (0.2 M sodium phosphate, 0.3 M NaCl, pH 7.2). The stationary phase was blocked with 2 mM D-biotin in 2×PBS, pH 7.2, and reversible biotin binding sites were stripped, using 30% CH3CN/0.4% formic acid, and the columns were re-equilibrated with 2 × PBS, pH 7.2. The samples containing the cICAT-labeled peptides were boiled for 5 min, cooled to room temperature, loaded onto the avidin columns, and allowed to incubate for 30 min at ambient temperature. After washing the columns with 2 × PBS, pH 7.2, 1 × PBS, pH 7.2, and 50 mM NH4HCO3/20% CH3CN, pH 8.3, the cICAT-labeled peptides were eluted with 30% CH3CN/0.4% formic acid and lyophilized. The biotin moiety was cleaved from the cICAT-labeled peptides by treatment with the cleaving reagents provided by the manufacturer for 2 h at 37°C, and lyophilized.
Strong cation exchange fractionation
Each cICAT-labeled sample was dissolved in 120 μL of 25% CH3CN/0.1% TFA, and resolved into 96 fractions using strong cation exchange liquid chromatography (SCXLC). The peptides were loaded onto a 1 mm × 150 mm Polysulfoethyl A column (PolyLC Inc., Columbia, MD) and eluted at a flow rate of 50 μL/min using the following HCO2NH4/CH3CN multistep gradient: 3% mobile phase B for 3 min, followed a linear increase to 10% B in 43 min, a linear increase to 45% B in 40 min, then a linear increase to 100% B in 1 min and maintained at 100% B for 9 min. Mobile phase A was 25% CH3CN, and mobile phase B was 25% CH3CN/0.5 M HCO2NH4, pH 3.0. The separation was monitored by native fluorescence at an emission wavelength of 340 nm with an excitation wavelength of 266 nm. The SCXLC fractions were collected at one minute intervals, pooled into 31 aliquots, which were then lyophilized to dryness and reconstituted in 2% CH3CN/0.1% TFA prior to microcapillary reversed-phase liquid chromatography (μRPLC)-MS/MS.
μRPLC-MS/MS of cICAT-labeled peptides
A 10 cm-long μRPLC-electrospray ionization (ESI) column was coupled online with a 7-tesla hybrid linear ion trap-Fourier transform ion cyclotron resonance MS (LTQ-FT, Thermo Electron, San Jose, CA) to analyze each SCXLC fraction. To construct the μRPLC-ESI columns, 75 μm i.d. fused-silica capillaries (Polymicro Technologies, Phoenix, AZ) were flame-pulled to construct a 10 cm-fine i.d. (i.e., 5-7 μm) tip against which 3 μm, 300 Å pore size C18 RP particles (Vydac, Hercules, CA) were slurry-packed using a slurry-packing pump (Model 1666, Alltech Associates, Deerfield, IL). The column was connected via a stainless steel union to an Agilent 1200 nanoflow LC system (Agilent Technologies, Paolo Alto, CA), which was used to deliver mobile phases A (0.1% formic acid in water) and B (0.1% formic acid in CH3CN). Each SCXLC fraction was analyzed by μRPLC-MS/MS. After 15-min loading of one-third content of each SCXLC fraction, the LTQ-FT MS began to acquire data while the column was maintained with 2% solvent B for another 15 min at a flow rate of ∼200 nL/min, followed by a step gradient to elute the peptides: 2%-40% solvent B for 110 min and 40%-98% solvent B for 30 min. For LTQ-FT MS, the MS survey scan was performed in the FTICR part with a resolution of 1×10⁵, and the MS/MS scans were acquired in the LTQ part. The instrument was operated in a data-dependent MS/MS mode in which the five most intense peptide molecular ions in the MS scan were sequentially and dynamically selected for subsequent collision-induced dissociation (CID) using a normalized collision energy of 35%. Dynamic exclusion was enabled with duration of 1 min to prevent repeated acquisition of MS/MS spectra of the same peptide for which the MS/MS spectrum had been acquired in the previous scan. The voltage and temperature for the capillary of the ion source were set at 10 V and 160°C, respectively.
Peptide identification and quantification
The raw MS/MS data was deposited in a public Tranche database (https://proteomecommons.org/dataset.jsp?i=74083) that is hosted by Indiana University and University of Michigan. The raw MS/MS data were searched using TurboSEQUEST (ThermoElectron, San Jose, CA) against the human protein database (downloaded on 01/04/2005) from the European Bioinformatics Institute (EBI) (www.ebi.ac.uk) to identify light and heavy cICAT-labeled peptides. The number of total protein entries searched in the database is 36761. Static modification of Cys by mass addition of the cleaved light ICAT label (227.1270 Da) and dynamic modification of Cys by mass addition of 9.0302 Da were set in a single search to search for both light and heavy cICAT-labeled peptides. Peptide mass tolerance of 0.08 Da and fragment ion tolerance of 0.5 Da were allowed with tryptic specificity allowing two missed cleavages. SEQUEST criteria were Xcorr >= 1.9 for [M+H]1+ ions, >= 2.2 for [M+2H]2+ ions and >= 2.9 for [M+3H]3+ ions, and ΔCn >= 0.08 for identification of fully tryptic peptides. The relative abundance of identified peptides was calculated using XPRESS (ThermoElectron, San Jose, CA), by which peak areas were integrated from their extracted ion chromatograms (XIC) using a minimum intensity threshold of 500 counts and smoothing point of 5. The cICAT dataset was further normalized by the mean ratio according to the method described previously 14. We excluded proteins identified solely from a single peptide; Supplemental Table 7 shows the identification of proteins as well as the peptide sequences for the proteins with at least 2 peptide identifications after removing the redundant identifications. There are a total of 1461 unique proteins; the unique proteins and the number of peptides used for protein quantitation measurements are shown in Supplemental Table 8. The values of median ratio, mean ratio, median absolute deviation and standard deviation are available in Supplemental Table 8. In this study we use median ratio for all further analyses.
Pathway and network analysis
To investigate the pathways and gene sets that are differentially regulated in 1- and 4+ tumors, Gene Set Enrichment Analysis (GSEA) method 18 (http://www.broad.mit.edu/gsea/) was applied to the global protein expression profiles with a weighted enrichment statistic corresponding to a weighted Kolmogorov-Smirnov-like statistics, and proteins were ranked using log2 ratio of protein expressions in 4+ and 1- tumor. A minimal size of 15 overlapping genes in each set was required and a collection of curated gene sets in MSigDB (http://www.broad.mit.edu/gsea/msigdb/) was used in this analysis. Because of the limited number of samples, permutation tests were performed on gene sets with 1000 permutations for obtaining FDR q-values. Gene sets with a FDR q-value < 0.1 were considered significant. The network analysis was performed using the network building tool MetaCore (GeneGo, St. Joseph, MI). MetaCore is an integrated software suite for functional analysis of experimental data and it contains curated protein interaction networks on the basis of manually curated database of human protein-protein, protein-DNA, protein-RNA and protein-compound interactions. The differentially expressed proteins from our experiment and the proteins from the MetaCore database were used for generating network. Networks were generated using Dijkstara's shortest paths algorithm to find the shortest directed paths between the selected objects.
Functional annotation and statistical analysis
Gene ontology (GO) analysis was performed using David bioinformatics resource (http://david.abcc.ncifcrf.gov/). The analyses were conducted using genes up- or down-regulated in 4+ cells (vs. 1-), comparing to all genes detected by ICAT. GO terms with P values < 0.01 and FDR < 0.1 are provided in Supplemental Tables. The classification of proteomes (all ICAT identified proteins as well as differential expressed proteins in 4+ and 1- tumors) is performed according to the assignment of proteins to GO Slim, a selection of high level terms from GO, which was obtained from EMBL-EBI (http://www.ebi.ac.uk/). A functional classification of the proteins for biological processes within each proteome set has been generated to show the proportion of proteins involved in. R statistical package (http://www.r-project.org/) has been used for statistical analysis.
SDS-PAGE and western blotting
To determine the expressional levels of proteins, 10 μg of protein was separated on SDS-PAGE and transferred to nitrocellulose membrane. The membranes were blocked with 5% nonfat dry milk in TBST (50 mM Tris, pH 7.5, 150 mM NaCl, 0.05% Tween-20) for 1h, washed, and subsequently incubated overnight at 4°C in TBST with 5% BSA containing the following antibodies; anti-L1CAM(Abcam, Clon# UJ127.11, 1:1,000), anti-NRCAM (R&D, Clone# 297906, 1:500), anti-Clusterin (BD Pharmingen, Clone#E5, 1:500), anti-PCNA (Dako, Clone# PC10, 1:500), or anti-GAPDH (Chemicon, Clone# 6C5, 1:5,000). Specific molecules were detected with horseradish peroxidase-labeled anti-mouse or anti-rabbit secondary antibodies (Chemicon International) and enhanced with SuperSignal Chemiluminescence kit (Pierce Biotechnology) or ECL kit (Amersham Biosciences). Signal was detected on KODAK BIOMAX MR X-ray film (Kodak). Quantative analysis of the western blotting was performed by analysis of the scanned X-ray films with ImageQuant (Ver. 5.2, Molecular Dynamics, Sunnyvale, CA).
Results
Protein identification and quantification in neuroblastoma
To globally identify proteins important for the neuroblastoma progression, ICAT-based quantitative technology was used to assess the overall protein expression profiles by comparing a low-risk neuroblastoma sample in stage 1 without MYCN-amplification (1-) and a high-risk neuroblastoma sample in stage 4 with MYCN-amplification (4+). Peptide identification was obtained at a confidence level greater than 95% evaluated by searching a randomized sequence databases as described previously 15. After excluding proteins identified solely from a single peptide and redundant protein identifications, a total of 1461 unique proteins remained for the further analysis (Supplemental Table 7 and 8). The data processing and normalization procedure was described in the section of Materials and Methods. The protein expression ratios (log2 transformed) between 4+ tumor and 1-tumor are in a normal distribution (Supplemental Fig1)
Pathway analysis of protein expression changes in neuroblastoma
Gene set enrichment analysis (GSEA) is a powerful analytical method and has been used on gene expression data to identify pathways and processes 18; it focuses on groups of genes that share common biological functions or mechanisms. In this study, we applied GSEA on the protein expression ratios between 4+ tumor and 1- tumor to examine if there is any enrichment of functional protein sets whose abundance correlated with high-risk stage 4 MYCN amplified NB tumor (top panel of Fig 1A and Supplemental Table 2, FDR q-value < 0.1). As we expected, the top ranked enriched gene sets in 4+ tumor contain Myc-responsive genes and ribosomal proteins (Fig 1B). Interestingly, the gene sets enriched in embryonic and neural stem cells are significantly enriched in 4+ NB tumor at the protein level (Fig 1A and Supplemental Table 2), which may imply the “stemness” nature of a cluster of cells in high-stage neuroblastoma compared to low-stage tumor. The details of the GSEA leading edge subset of neural stem cell proteins are shown in Supplemental Table 3. GSEA also identified the enriched gene sets in low stage NB (or depleted in high stage NB). The bottom panel of Fig 1A shows the top 5 of these gene sets, containing genes involved in axon guidance and cell adhesion (Fig 1C). The down-regulation of axon guidance proteins in 4+ tumor suggests the suppression of neural development in high stage NB tumor, whereas suppression of cell adhesion proteins in 4+ tumor indicates the metastatic nature of stage 4 NB tumors.
Fig 1. GSEA analysis of protein expression changes in neuroblastoma.
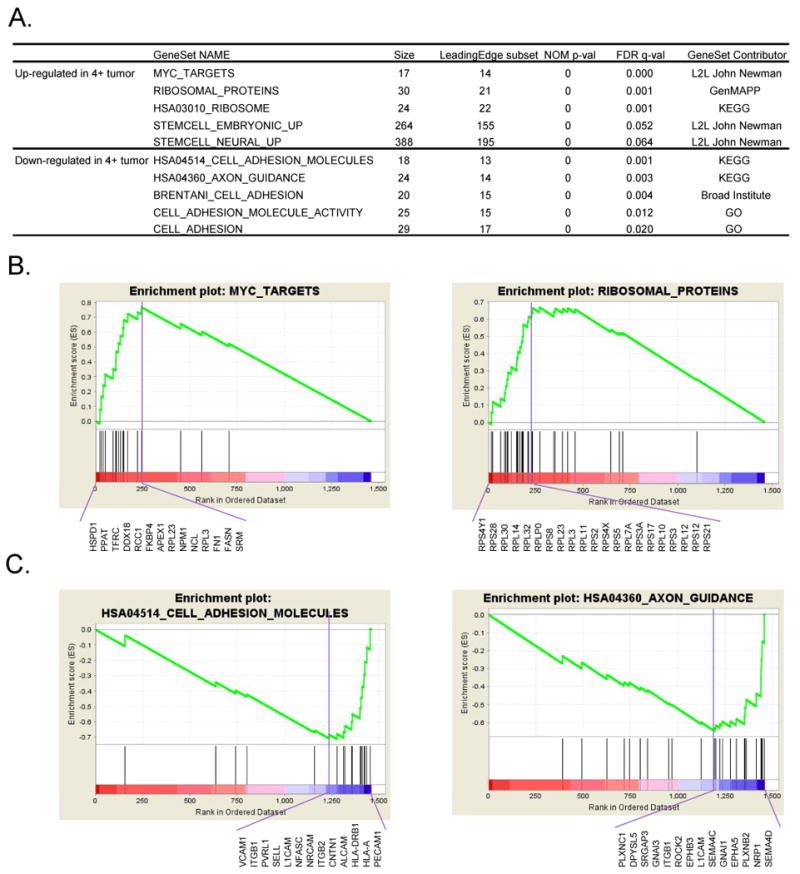
A. List of top significantly enriched protein sets. GSEA analysis was performed on the ranked proteins according to the log2 ratio of protein expression between 4+ and 1- NB tumors. Gene sets with a FDR q-value of < 0.1 were considered significant. A complete list of significantly enriched protein sets is available in Supplemental Table 2. B. Enrichment plots of myc_targets and ribosomal_proteins. Proteins in these functional sets are significantly enriched in 4+ tumor. The green curve shows the running sum of enrichment score (ES) for the ranked proteins. The purple vertical line specifies the maximum ES score. The proteins listed under the plot are the leading edge subset of proteins. C. Enrichment plots of hsa04360_axon_guidance and hsa04514_cell_adhesion_molecules. Proteins in these functional sets are significantly suppressed in 4+ tumor.
Differentially expressed proteins in 4+ vs. 1- neuroblastoma
We then examined the differentially expressed proteins in 4+ tumor compared to 1-tumor using a cutoff of 2-fold protein expression changes based on the previous published studies 9, 14-16. A total of 433 proteins have an elevated expression and 130 have a reduced expression in 4+ tumor. Supplemental Fig 2 shows the GO functional categories of all quantified proteins as well as the differential proteins by using representation of GOSlim terms, which are a subset of the GO terms providing a higher level of annotation than the standard GO (http://www.geneontology.org). Cellular process, metabolism, biosynthesis, regulation of biological processes are prominently represented in both up- and down-regulated protein groups. Processes involved in development, cell differentiation, cell death, and cell communication are prominently represent in the down-regulated protein group, in agreement with the GSEA result described above. We performed GO analysis on these differentially expressed proteins using the David bioinformatics resource (http://david.abcc.ncifcrf.gov/). Proteins with biological processes of biogenesis, metabolism, and RNA processing are dramatically enriched in the up-regulated proteins as expected (Supplemental Table 4). In agreement with the GSEA results above, proteins involved in ribosome biogenesis and assembly is highly up-regulated (Table 1). In addition, the proteins involved in glycolysis, DNA replication and cell cycle are also significantly enriched in the up-regulated proteins. In the GO analysis of down-regulated proteins (Table 1 and Supplemental Table 4), cell adhesion is the most highly represented function, consistent with our pathway analysis results. The enrichment of the processes of system development, nervous system development and cell differentiation associated with the down-regulated proteins suggests the suppression of neural development and a less mature phenotype in 4+ tumor.
Table 1. Selected significant GO processes of differential expressed proteins.
| GO Term | Pvalue | FDR | List of Hits | |
|---|---|---|---|---|
| Up-regulated | GO:0042254:ribosome biogenesis and assembly | 4.3E-11 | 8.2E-10 | BOP1,DIS3,DKC1,EXOSC2,EXOSC7,EXOSC8,EXOSC9,FBL,GTPBP4,MRTO4, N HP2L1,NOL5A,NOLA2,NOP5/NOP58,NPM1,PA2G4,RPL7A,RPLP0 |
| GO:0006096:glycolysis | 1.5E-05 | 2.9E-04 | ALDOA,GAPDH,HK2,HYOU1,LDHAL6A,MDH2,PDHA1,PFKM,PGK1,PKM2 | |
| GO:0006260∼DNA replication | 3.3E-05 | 6.4E-04 | DKC1,DUT,GTPBP4,HMGB1,HMGB2,MCM2,MCM4,MCM5,MCM6,NASP,PCNA, PHB,RBBP4,RRM1,RRM2,SSRP1,SUPT16H,TNKS1BP1,TOP1 |
|
| GO:0007049:cell cycle | 2.8E-03 | 5.2E-02 | CALR,CKAP5,DKC1,DTYMK,GTPBP4,HGF,HK2,ILF3,MCM2,MCM5,MCM6,MCTS 1,NASP,NEK9,NHP2L1,NPM1,NUMA1,PA2G4,PCNA,PHB,PPP5C,PTN,PTPN11, RAD21,RANBP1,RBBP4,RCC1,RCC2,RPS4X,SART1,SMC1A,SMC4,SPIN1, TR IAP1,TUBG1,UHRF1 |
|
| Down-regulated | GO:0007155:cell adhesion | 2.6E-07 | 4.9E-06 | ALCAM,AMBP,ARVCF,ATP2C1,CADM1,CD44,CNTN1,ITGB2,L1CAM,NFASC, NP TN,NRCAM,NRP1,PECAM1,PLEKHC1,RHOB,SELL,SEMA4D,TGFB1I1, TGM2,TL N2,TNC,TSTA3 |
| GO:0048731:system development | 2.9E-06 | 5.6E-05 | ABR,AHSG,ANXA2,APOE,ATP2C1,BPGM,CD44,CLU,COL4A2,CRIP2,DPYSL3, ECGF1,EPB42,EPHB3,FGA,GFRA3,KRT10,L1CAM,MAPT,NFASC,NPTN,NRCAM, NRP1,NTRK1,OSTF1,PPP2R5D,RHOB,SEMA4C,SEMA4D, SPP2,TAGLN2,TGM2,TNC,TRAPPC4 |
|
| GO:0007399∼nervous system development | 5.9E-04 | 1.1E-02 | ABR,APOE,CLU,DPYSL3,EPHB3,GFRA3,L1CAM,MAPT,NFASC,NPTN,NRCAM, N RP1,NTRK1,PPP2R5D,SEMA4C,SEMA4D,TRAPPC4 |
|
| GO:0030154∼cell differentiation | 1.5E-03 | 2.9E-02 | APOE,BPGM,BRUNOL4,CADM1,CLU,ECGF1,EPB42,EPHB3,GFRA3,HSP90B1, I TGB2,L1CAM,MAPT,NFASC,NPTN,NRCAM,NRP1,NTRK1,PRKCE,RHOB,SEMA4C, SEMA4D,TGFB1I1,TGM2,TNC,TRAPPC4,TUBB,YARS |
|
Correlation of mRNA and protein expression
To investigate if the levels of protein abundance reflect in mRNA expression, global mRNA expression was measured using Affymetrix U133plus2 microarrays. The mRNA expression ratios of the 4+ and 1- NB tumors were then compared to the expression ratios of the proteins identified by ICAT (Fig 2A). A 1.5-fold cutoff was used for mRNA expression to retrieve a similar amount of differentially expressed transcripts as proteins. Approximately half of the up-regulated proteins (n = 208) in the 4+ tumor also have enhanced mRNA expression, while 36% of the down-regulated proteins (n=47) have a reduced mRNA levels (Fig 2B). Protein expression ratios moderately correlate with their mRNA expression (Spearman rank correlation r = 0.51, p < 0.0001) as shown in the scatter plot of protein expression ratios versus the corresponding mRNA-expression ratios in Fig2C. Based on our cutoffs only 21 genes are discordantly expressed between protein and mRNA expression, suggesting that these proteins may be regulated post-transcriptionally. We further explored the functionality of those genes whose protein expression agreed with their mRNA expression. The significant GO processes identified using both mRNA and protein expression information (Supplemental Table 5) significantly overlaps with the previous GO analysis results using protein information alone. This correlation suggests that the genes involved in these biological processes are primarily regulated at the transcriptional level. The up-regulated genes have functions in the cell cycle, DNA replication, glycolysis, and ribosome biogenesis and assembly; whereas down-regulated genes are involved in nervous system development, cell adhesion, and cell differentiation (Fig2C). Interestingly, among these up- and down-regulated genes, low expression of NTRK1, CD44, NRCAM, CADM1 and high expression of ALK have been previously reported to predict poor NB prognosis 1, 2, 5, 6, 19, 20. Indeed, we have observed these changes in the 4+ NB samples both at mRNA and protein levels (Fig 2C). The complete mRNA and protein expression data is available in the Supplemental Table 6.
Fig 2. Correlation of mRNA and protein expression.
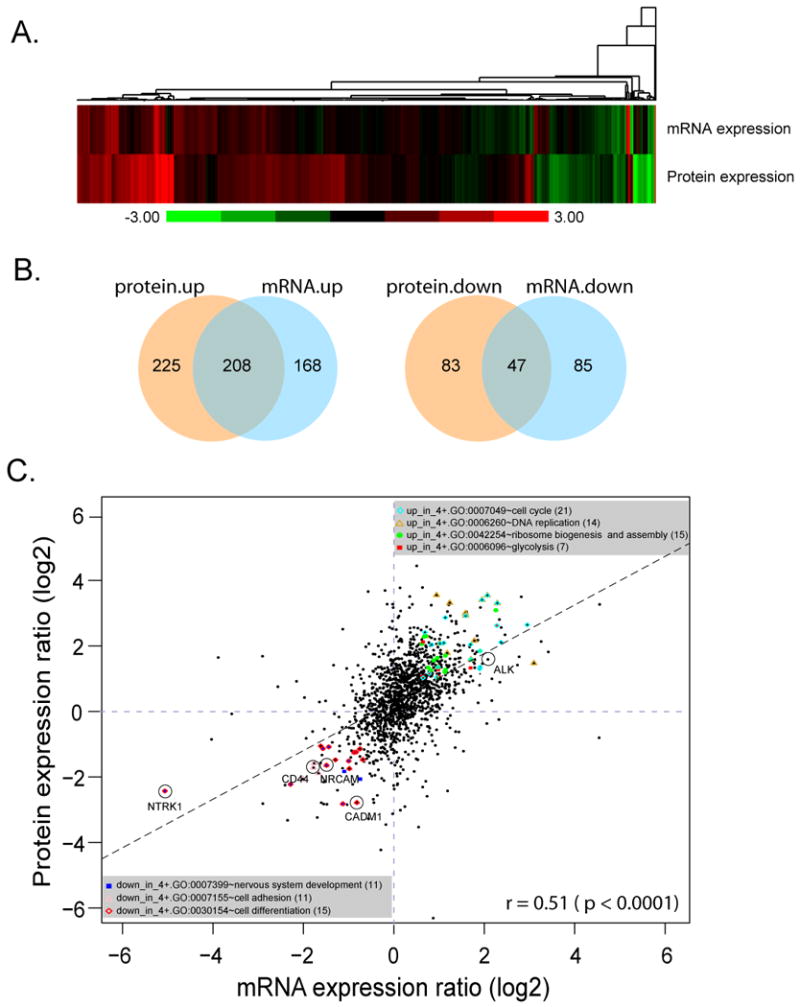
A. The heatmap of mRNA and protein expression ratio of 4+ vs. 1- tumor. B. Venn diagrams show the overlapping of differential up- and down-regulated genes in mRNA and protein expression. C. Scatter plot of protein expression vs. mRNA expression ratios. Ratios of 4+ to 1- tumor protein expression measured by ICAT are plotted against the corresponding mRNA expression ratios measured by Affymetrix genechip, the correlation coefficient is 0.51 (p < 0.0001). The linear regression line is shown as a dashed black line. Many genes with elevated mRNA or protein expression in 4+ tumor were involved in ribosome biogenesis, cell cycle, DNA replication and glycolysis, whereas genes involved in nervous system development, cell adhesion, and cell differentiation had reduced expression levels. The color codes for the genes involved in different biological processes are indicated in the figure. Genes ALK, NTRK1, CD44, NRCAM and CADM1 known to relate with neuroblastoma prognosis are marked in circle.
Validation of ICAT result in independent neuroblastoma samples
To validate the ICAT and microarray findings on this paired samples, we examined mRNA and protein expression for additional 10 neuroblastoma samples: 5 samples in stage 1 without MYCN-amplification (1-) and 5 samples in stage 4 with MYCN-amplification (4+). We first measured the mRNA expression of these 10 new samples using Affymetrix U133plus2 microarrays. We compared mRNA expression in these two groups of tumors using 4 sets of differential genes involved in GO processes identified from ICAT and microarray data of the paired 4+ and 1- NB tumor (Fig 2C): genes involved in cell cycle (n=21), ribosome biogenesis and assembly (n=15), nervous system development (n=11) and cell adhesion (n=11). Hierarchical clustering using genes selected from the ICAT study are able to separate these additional neuroblastoma samples according to their stage and MYCN status (Fig 3A). Therefore, the mRNA expression profiles of the new NB samples are in accordance with the observation derived from the initial two 1- and 4+ paired NB samples.
Fig 3. Validation of ICAT results in additional neuroblastoma samples.
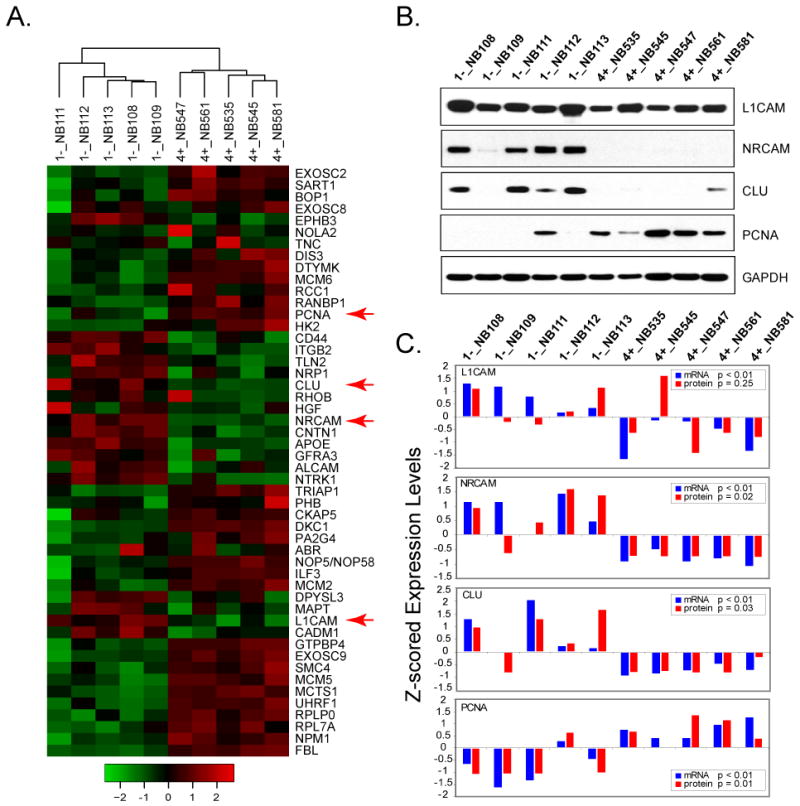
A. Hierarchical clustering analysis of mRNA expression data using the differential genes involved in 4 functional categories of GO biological processes showed neuroblastoma samples are separated according to the stage and clinical outcome. Their overall expression is consistent with the ICAT results. The row z-scored color map is shown at the bottom. The genes with red arrow are tested in western blotting analysis. B. Protein expression level of L1CAM, NRCAM, CLU and PCNA are confirmed in western blotting analysis. C. Comparison of mRNA and protein levels in a panel of neuroblastomas. The western blotting result is quantified and the protein level of each specific gene is normalized by GAPDH expression. The mRNA and protein levels between 1- and 4+ tumor groups are compared using t-test.
Next, we selected 4 proteins, L1CAM (nerve development and cell adhesion), NRCAM (nerve development and cell adhesion), CLU (nerve development) and PCNA (cell cycle), for validation using western blotting based on the availability of high quality antibodies (Fig3B). The normalized protein levels of L1CAM, NRCAM and CLU are higher in 1- NB tumors (p=0.25 for L1CAM; p<0.05 for NRCAM and CLU; t-test), whereas the expression of PCNA is significantly higher in 4+ tumors (p<0.05) (Fig 3B-C). In addition, the mRNA expression of these 4 genes is significantly different between 1- and 4+ tumors (Fig 3C, p<0.01). Therefore, these results validated the findings obtained from the ICAT study.
Protein networks in neuroblastoma
In order to identify the deregulated pathways in the stage 4+ tumors, we next investigated the interactions of differentially expressed proteins identified in this study using the MetaCore analysis tool and a shortest paths algorithm. The proteins of known networks in the MetaCore database were used as well for generating protein networks. Using a total of 255 proteins (208 up-regulated and 47 down-regulated in 4+ tumor at both protein and mRNA levels), we obtained a network consisting of 406 proteins (data not shown), and observed sub-networks centered on regulatory transcription factors such as c-Myc, HNF4-alpha, SP1, p53, E2F1, YY1 and N-Myc, suggesting the importance of these regulatory proteins in the pathogenesis of high-risk NB. The complexity of a network with 406 protein nodes makes it difficult to view; therefore we applied more stringent criteria of differential expression threshold of 4-fold for protein and 2-fold for mRNA. These more stringent criteria resulted in a total of 56 proteins representing 42 up-regulated and 14 down-regulated in 4+ tumor at both protein and mRNA levels. When we built protein-protein interaction networks using these 56 proteins and a shortest path algorithm, a network of 48 proteins is observed after the removal of the proteins that revealed no connection (Fig 4). In this network, 27 nodes were identified in the ICAT study and 21 nodes originate from the MetaCore database. Although MYCN was not detected by the ICAT method, our ICAT study identified 5 proteins (MCM5, MCM6, Prohibitin, PTBP1 and APEX) that directly interact with MYCN in this network, suggesting the important role of MYCN in the transcriptional activation of the pathways in stage 4 MYCN-amplified neuroblastoma (4+). This network also suggests that other transcription factors including E2F1, p53, YY1, STAT1, STAT3, c-jun, GATA-4, HIF-1 and the androgen receptor may be involved in the regulation of 4+ NB tumors.
Fig 4. Protein networks associated with the proteins differentially expressed in 4+ and 1- neuroblastoma.
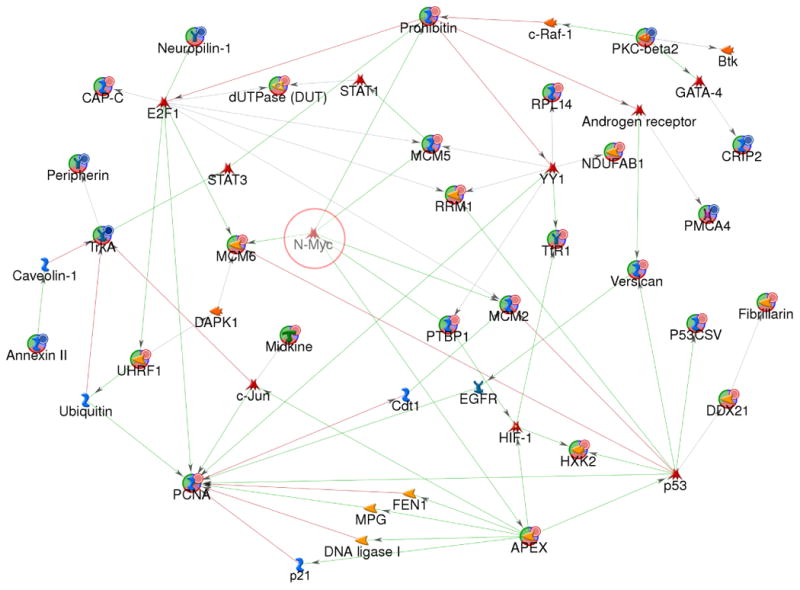
The network was generated by a shortest paths algorithm of MetaCore (GeneGo) software using the list of differentially expressed proteins identified ICAT and Affymetrix microarray analysis. Nodes represent proteins; lines between nodes indicate the interaction between proteins; the arrowheads indicate the direction of the interaction. Different shapes of the nodes represent the functional class of the proteins. The nodes with circular symbol represent the differential expressed proteins obtained from our experiment; otherwise obtained from MetaCore database. The lines between the nodes indicate the interactions of the nodes; the arrowheads indicate the direction of the interaction. The color of lines between nodes describes activation (green), inhibition (red), and unspecified (gray) interactions.  : over-expressed;
  : under-expressed;
  : transcription factor.
Discussion
Neuroblastoma is the most common solid extra-cranial tumor of childhood. In infants these tumors occasionally regress spontaneously; however most children older than 1 year of age present with metastatic disease and have a poor prognosis despite multimodal therapies 1. Many genetic alterations in NB have been identified and provide insight into mechanisms of malignant transformation and progression 1. In this study we explored the potential mechanisms involved in NB progression at the proteome level. We compared the protein expression profiles of NB tumors in stage 4 MYCN-amplified and stage 1 MYCN-not amplified using the ICAT-based quantitative proteomic approach and identified multiple changes in the protein expression that are consistent with the NB development. The enrichment of down-regulated proteins involved in functional processes of axon guidance, nervous system development and cell differentiation suggests a suppression of neural development and a more primitive phenotype in 4+ tumors. The expression of cell adhesion proteins is significantly suppressed, whereas glycolysis proteins are significantly elevated in 4+ tumors. Recent experimental results indicate that cell adhesion molecules directly modulate signal transduction, and changes in the expression or function of cell adhesion molecules can contribute to tumor progression by affecting cell signaling resulting from altering the adhesion status of cells. Additionally, a reduction in cell adhesion will promote tumor invasion and metastasis 21. Alterations in cell adhesion within tumors and cancer interactions with immune cells or endothelial cells are critical to tumor growth and spread 22. Glycolysis has been implicated in metastasis, as cell populations with enhanced glycolysis have a great growth advantage that promotes unconstrained proliferation and invasion 23. Taken together, it suggests that the reduced cell adhesion and induced glycolysis are involved in tumor invasion and metastasis of high stage NB tumors. Furthermore, up-regulation of DNA replication and cell cycle processes are shown to be important in 4+ tumor progression. Our ICAT analysis confirmed previous reports of down-regulation of NTRK1, CD44, CADM1, NRCAM expression and up-regulation of ALK expression 1, 2, 5, 6, 19, 20 in aggressive NB corroborating the reliability of this method for detecting differential protein expression. Several proteins identified in this study were recently also detected by another group using proteomics and validated as potential markers for neuroblastoma 24. Other transcription factors such as E2F1, p53, YY1, STAT1, STAT3, GATA-4, and HIF-1 were identified from the network built from differentially expressed proteins, suggesting that these proteins may regulate 4+ tumors together with MYCN.
It is well-known that amplification of MYCN leads to over-expression of MYCN protein in MYCN-amplified NB, which correlates with advanced diseases and a poor prognosis 1. We expected to see higher expression of MYCN protein in 4+ tumors compared to 1; however, we could not identify MYCN using mass spectrometry in this study, probably for the reasons that the tryptic Cys-containing peptides were too big or small to be detected in the experimental mass range, the ionization efficiency of the peptides could be low, and the protein level could not be high enough although the gene was amplified in tumors. Nevertheless, the ICAT analyses identified many proteins that are regulated by MYCN. The GSEA analysis on ICAT data showed the enrichment of functional protein sets in 4+ tumor containing Myc-responsive genes (MYC_targets) and genes involved in ribosome assembly. The gene set MYC_targets was originally obtained from MYC target gene database, which includes all myc-responsive genes 25. Both MYC and MYCN belong to the myc oncogene family and their protein products show significant homology 26. It is not surprising therefore to see enhanced expression of MYC_targets in the MYCN-amplified neuroblastoma sample. In addition, there is also evidence showing MYCN enhances the expression of a large set of ribosome biogenesis genes at the mRNA level 27. Therefore the top three most significantly enriched protein sets, MYC_TARGETS, RIBOSOMAL_PROTEINS and HSA03010_RIBOSOME, are clearly related to MYCN function although MYCN itself was not identified in this study. Next in the network analysis, the observed interaction between MYCN protein and other ICAT identified proteins confirmed the important role of MYCN in stage 4 MYCN-amplified neuroblastoma.
Interestingly we found that the proteins involved in neural stem cells and embryonic stem cells 28 are also significantly enriched in 4+ NB. This observation may imply the existence of a “stemness” signature in MYCN-amplified stage 4 high-risk tumors. Cells with tumor-initiating capacity have been identified recently in a number of solid tumors, it has also been reported that high-risk NB contains tumor-initiating cells with cancer stem cell properties 29. Therefore, it is possible that MYCN-amplified stage 4 tumor contains a higher proportion of cancer stem cells. In addition, MYC is one of the key mediators in the self-renewal and proliferation of embryonic stem cells 30, and MYC is also required to maintain the state of cancer stem cells, just as required for normal stem-cell self-renewal 31. The up-regulated stemness signature in MYCN-amplified stage 4 tumor suggests that MYCN may have a similar role as MYC, but further biological studies are needed.
Our study has demonstrated the importance of analyzing global protein expression in neuroblastoma using ICAT. Identification of those genes with concordant mRNA and protein expression is important for understanding neuroblastoma biology. It is also critical and more meaningful to investigate the groups of proteins that are in the same pathway and share common biological functions or mechanism. Targeting these pathways in neuroblastoma might be a systematic approach to the discovery of novel therapeutics for patients with neuroblastoma.
Supplementary Material
Acknowledgments
We thank Drs. Frank Westermann and Frank Berthold of German Cancer Research Center, Heidelberg (DZNSG), Drs. John Maris, Wendy London of the Children's Oncology Group (COG), Steven Qualman of the Cooperative Human Tissue Network (CHTN) for the tumor samples and patient demographic information. We thank Dr. Thomas Badgett for his critical reading and helpful comments on the manuscript. This research was supported by the Intramural Research Program of the NIH, National Cancer Institute, Center for Cancer Research. It has been funded in part with federal funds from the National Cancer Institute, National Institutes of Health, under contract HHSN261200800001E. The content of this publication does not necessarily reflect the views or policies of the Department of Health and Human Services, nor does mention of trade names, commercial products, or organizations imply endorsement by the U.S. Government. This research was supported in part by the Developmental Therapeutics Program in the Division of Cancer Treatment and Diagnosis of the National Cancer Institute.
References
- 1.Brodeur GM. Neuroblastoma: biological insights into a clinical enigma. Nat Rev Cancer. 2003;3(3):203–16. doi: 10.1038/nrc1014. [DOI] [PubMed] [Google Scholar]
- 2.Osajima-Hakomori Y, Miyake I, Ohira M, Nakagawara A, Nakagawa A, Sakai R. Biological role of anaplastic lymphoma kinase in neuroblastoma. Am J Pathol. 2005;167(1):213–22. doi: 10.1016/S0002-9440(10)62966-5. [DOI] [PMC free article] [PubMed] [Google Scholar]
- 3.Adida C, Berrebi D, Peuchmaur M, Reyes-Mugica M, Altieri DC. Anti-apoptosis gene, survivin, and prognosis of neuroblastoma. Lancet. 1998;351(9106):882–3. doi: 10.1016/S0140-6736(05)70294-4. [DOI] [PubMed] [Google Scholar]
- 4.Chen QR, Bilke S, Wei JS, Greer BT, Steinberg SM, Westermann F, Schwab M, Khan J. Increased WSB1 copy number correlates with its over-expression which associates with increased survival in neuroblastoma. Genes Chromosomes Cancer. 2006;45(9):856–62. doi: 10.1002/gcc.20349. [DOI] [PubMed] [Google Scholar]
- 5.Berwanger B, Hartmann O, Bergmann E, Bernard S, Nielsen D, Krause M, Kartal A, Flynn D, Wiedemeyer R, Schwab M, Schafer H, Christiansen H, Eilers M. Loss of a FYN-regulated differentiation and growth arrest pathway in advanced stage neuroblastoma. Cancer Cell. 2002;2(5):377–86. doi: 10.1016/s1535-6108(02)00179-4. [DOI] [PubMed] [Google Scholar]
- 6.Wei JS, Greer BT, Westermann F, Steinberg SM, Son CG, Chen QR, Whiteford CC, Bilke S, Krasnoselsky AL, Cenacchi N, Catchpoole D, Berthold F, Schwab M, Khan J. Prediction of clinical outcome using gene expression profiling and artificial neural networks for patients with neuroblastoma. Cancer Res. 2004;64(19):6883–91. doi: 10.1158/0008-5472.CAN-04-0695. [DOI] [PMC free article] [PubMed] [Google Scholar]
- 7.Ohira M, Oba S, Nakamura Y, Isogai E, Kaneko S, Nakagawa A, Hirata T, Kubo H, Goto T, Yamada S, Yoshida Y, Fuchioka M, Ishii S. Nakagawara, A., Expression profiling using a tumor-specific cDNA microarray predicts the prognosis of intermediate risk neuroblastomas. Cancer Cell. 2005;7(4):337–50. doi: 10.1016/j.ccr.2005.03.019. [DOI] [PubMed] [Google Scholar]
- 8.Chen QR, Bilke S, Wei JS, Whiteford CC, Cenacchi N, Krasnoselsky AL, Greer BT, Son CG, Westermann F, Berthold F, Schwab M, Catchpoole D, Khan J. cDNA array-CGH profiling identifies genomic alterations specific to stage and MYCN-amplification in neuroblastoma. BMC Genomics. 2004;5(1):70. doi: 10.1186/1471-2164-5-70. [DOI] [PMC free article] [PubMed] [Google Scholar]
- 9.Ideker T, Thorsson V, Ranish JA, Christmas R, Buhler J, Eng JK, Bumgarner R, Goodlett DR, Aebersold R, Hood L. Integrated genomic and proteomic analyses of a systematically perturbed metabolic network. Science. 2001;292(5518):929–34. doi: 10.1126/science.292.5518.929. [DOI] [PubMed] [Google Scholar]
- 10.Griffin TJ, Gygi SP, Ideker T, Rist B, Eng J, Hood L, Aebersold R. Complementary profiling of gene expression at the transcriptome and proteome levels in Saccharomyces cerevisiae. Mol Cell Proteomics. 2002;1(4):323–33. doi: 10.1074/mcp.m200001-mcp200. [DOI] [PubMed] [Google Scholar]
- 11.Gygi SP, Rist B, Gerber SA, Turecek F, Gelb MH, Aebersold R. Quantitative analysis of complex protein mixtures using isotope-coded affinity tags. Nat Biotechnol. 1999;17(10):994–9. doi: 10.1038/13690. [DOI] [PubMed] [Google Scholar]
- 12.Han DK, Eng J, Zhou H, Aebersold R. Quantitative profiling of differentiation-induced microsomal proteins using isotope-coded affinity tags and mass spectrometry. Nat Biotechnol. 2001;19(10):946–51. doi: 10.1038/nbt1001-946. [DOI] [PMC free article] [PubMed] [Google Scholar]
- 13.Shiio Y, Aebersold R. Quantitative proteome analysis using isotope-coded affinity tags and mass spectrometry. Nat Protoc. 2006;1(1):139–45. doi: 10.1038/nprot.2006.22. [DOI] [PubMed] [Google Scholar]
- 14.Yu LR, Conrads TP, Uo T, Issaq HJ, Morrison RS, Veenstra TD. Evaluation of the acid-cleavable isotope-coded affinity tag reagents: application to camptothecin-treated cortical neurons. J Proteome Res. 2004;3(3):469–77. doi: 10.1021/pr034090t. [DOI] [PubMed] [Google Scholar]
- 15.Yu LR, Chan KC, Tahara H, Lucas DA, Chatterjee K, Issaq HJ, Veenstra TD. Quantitative proteomic analysis of human breast epithelial cells with differential telomere length. Biochem Biophys Res Commun. 2007;356(4):942–7. doi: 10.1016/j.bbrc.2007.03.069. [DOI] [PMC free article] [PubMed] [Google Scholar]
- 16.Chen R, Brentnall TA, Pan S, Cooke K, Moyes KW, Lane Z, Crispin DA, Goodlett DR, Aebersold R, Bronner MP. Quantitative proteomics analysis reveals that proteins differentially expressed in chronic pancreatitis are also frequently involved in pancreatic cancer. Mol Cell Proteomics. 2007;6(8):1331–42. doi: 10.1074/mcp.M700072-MCP200. [DOI] [PubMed] [Google Scholar]
- 17.Chen QR, Song YK, Wei JS, Bilke S, Asgharzadeh S, Seeger RC, Khan J. An integrated cross-platform prognosis study on neuroblastoma patients. Genomics. 2008;92(4):195–203. doi: 10.1016/j.ygeno.2008.05.014. [DOI] [PMC free article] [PubMed] [Google Scholar]
- 18.Subramanian A, Tamayo P, Mootha VK, Mukherjee S, Ebert BL, Gillette MA, Paulovich A, Pomeroy SL, Golub TR, Lander ES, Mesirov JP. Gene set enrichment analysis: a knowledge-based approach for interpreting genome-wide expression profiles. Proc Natl Acad Sci U S A. 2005;102(43):15545–50. doi: 10.1073/pnas.0506580102. [DOI] [PMC free article] [PubMed] [Google Scholar]
- 19.Michels E, Hoebeeck J, De Preter K, Schramm A, Brichard B, De Paepe A, Eggert A, Laureys G, Vandesompele J, Speleman F. CADM1 is a strong neuroblastoma candidate gene that maps within a 3.72 Mb critical region of loss on 11q23. BMC Cancer. 2008;8:173. doi: 10.1186/1471-2407-8-173. [DOI] [PMC free article] [PubMed] [Google Scholar]
- 20.Nowacki S, Skowron M, Oberthuer A, Fagin A, Voth H, Brors B, Westermann F, Eggert A, Hero B, Berthold F, Fischer M. Expression of the tumour suppressor gene CADM1 is associated with favourable outcome and inhibits cell survival in neuroblastoma. Oncogene. 2008;27(23):3329–38. doi: 10.1038/sj.onc.1210996. [DOI] [PubMed] [Google Scholar]
- 21.Cavallaro U, Christofori G. Cell adhesion and signalling by cadherins and Ig-CAMs in cancer. Nat Rev Cancer. 2004;4(2):118–32. doi: 10.1038/nrc1276. [DOI] [PubMed] [Google Scholar]
- 22.Lafrenie RM, Buckner CA, Bewick MA. Cell adhesion and cancer: is there a potential for therapeutic intervention? Expert Opin Ther Targets. 2007;11(6):727–31. doi: 10.1517/14728222.11.6.727. [DOI] [PubMed] [Google Scholar]
- 23.Gatenby RA, Gillies RJ. Why do cancers have high aerobic glycolysis? Nat Rev Cancer. 2004;4(11):891–9. doi: 10.1038/nrc1478. [DOI] [PubMed] [Google Scholar]
- 24.Garcia J, Faca V, Jarzembowski J, Zhang Q, Park J, Hanash S. Comprehensive profiling of the cell surface proteome of Sy5Y neuroblastoma cells yields a subset of proteins associated with tumor differentiation. J Proteome Res. 2009;8(8):3791–6. doi: 10.1021/pr800964v. [DOI] [PubMed] [Google Scholar]
- 25.Zeller KI, Jegga AG, Aronow BJ, O'Donnell KA, Dang CV. An integrated database of genes responsive to the Myc oncogenic transcription factor: identification of direct genomic targets. Genome Biol. 2003;4(10):R69. doi: 10.1186/gb-2003-4-10-r69. [DOI] [PMC free article] [PubMed] [Google Scholar]
- 26.Kohl NE, Legouy E, DePinho RA, Nisen PD, Smith RK, Gee CE, Alt FW. Human N-myc is closely related in organization and nucleotide sequence to c-myc. Nature. 1986;319(6048):73–7. doi: 10.1038/319073a0. [DOI] [PubMed] [Google Scholar]
- 27.Boon K, Caron HN, van Asperen R, Valentijn L, Hermus MC, van Sluis P, Roobeek I, Weis I, Voute PA, Schwab M, Versteeg R. N-myc enhances the expression of a large set of genes functioning in ribosome biogenesis and protein synthesis. EMBO J. 2001;20(6):1383–93. doi: 10.1093/emboj/20.6.1383. [DOI] [PMC free article] [PubMed] [Google Scholar]
- 28.Ramalho-Santos M, Yoon S, Matsuzaki Y, Mulligan RC, Melton DA. “Stemness”: transcriptional profiling of embryonic and adult stem cells. Science. 2002;298(5593):597–600. doi: 10.1126/science.1072530. [DOI] [PubMed] [Google Scholar]
- 29.Hansford LM, McKee AE, Zhang L, George RE, Gerstle JT, Thorner PS, Smith KM, Look AT, Yeger H, Miller FD, Irwin MS, Thiele CJ, Kaplan DR. Neuroblastoma cells isolated from bone marrow metastases contain a naturally enriched tumor-initiating cell. Cancer Res. 2007;67(23):11234–43. doi: 10.1158/0008-5472.CAN-07-0718. [DOI] [PubMed] [Google Scholar]
- 30.Cartwright P, McLean C, Sheppard A, Rivett D, Jones K, Dalton S. LIF/STAT3 controls ES cell self-renewal and pluripotency by a Myc-dependent mechanism. Development. 2005;132(5):885–96. doi: 10.1242/dev.01670. [DOI] [PubMed] [Google Scholar]
- 31.Jain M, Arvanitis C, Chu K, Dewey W, Leonhardt E, Trinh M, Sundberg CD, Bishop JM, Felsher DW. Sustained loss of a neoplastic phenotype by brief inactivation of MYC. Science. 2002;297(5578):102–4. doi: 10.1126/science.1071489. [DOI] [PubMed] [Google Scholar]
Associated Data
This section collects any data citations, data availability statements, or supplementary materials included in this article.