Summary
Hyperglycemia-induced mitochondrial dysfunction contributes to sensory neuron pathology in diabetic neuropathy. Although Schwann cells (SCs) also undergo substantial degeneration in diabetic neuropathy, the effect of hyperglycemia on SC mitochondrial proteome and mitochondrial function has not been examined. Stable isotope labeling with amino acids in cell culture (SILAC) was used to quantify the temporal effect of hyperglycemia on the mitochondrial proteome of primary SCs isolated from neonatal rats. Of 317 mitochondrial proteins identified, about 78% were quantified and detected at multiple time points. Pathway analysis indicated that proteins associated with mitochondrial dysfunction, oxidative phosphorylation, the TCA cycle and detoxification were significantly increased in expression and over-represented. Assessing mitochondrial respiration in intact SCs indicated that hyperglycemia increased the overall rate of oxygen consumption but decreased the efficiency of coupled respiration. Although a glucose-dependent increase in superoxide production occurs in embryonic sensory neurons, hyperglycemia did not induce a substantial change in superoxide levels in SCs. This correlated with a 1.9 fold increase in Mn superoxide dismutase expression which was confirmed by immunoblot and enzymatic activity assays. These data support that hyperglycemia alters mitochondrial respiration and can cause remodeling of the SC mitochondrial proteome independent of significant contributions from glucose-induced superoxide production.
Keywords: diabetes, hyperglycemia, SILAC, Schwann cells, mitochondria, superoxide dismutase, oxidative stress
Introduction
A severe and prevalent complication of diabetes is the development of diabetic peripheral neuropathy (DPN) 1. Hyperglycemia and poor control of blood glucose are precipitating events that initiate a series of complex and inter-related metabolic and vascular insults that underlie the etiology of diabetic neuropathy. Two pathogenetic components that contribute to DPN are enhanced oxidative stress and mitochondrial dysfunction in both sensory neurons and Schwann cells (SCs) 2, 3. Using cultured endothelial cells, Brownlee and colleagues were the first to suggest that increased mitochondrial superoxide production may be a unifying biochemical lesion which promotes hyperglycemia-induced increases in polyol synthesis, protein kinase C activity, protein modification by N-acetyl glucosamine and formation of advanced glycation end products in endothelial cells 4, 5. Consistent with this hypothesis, pharmacological interventions that decrease superoxide production and protein nitration in peripheral nerve improve morphological and physiological indices of nerve damage that contribute to diabetic neuropathy 6–9.
Although hyperglycemia can increase oxidative stress in mitochondria10, it is unclear whether glucose-induced superoxide production may contribute to changes in mitochondrial protein expression and function. SCs undergo substantial degeneration in DPN but the broad effect of hyperglycemia on the SC mitochondrial proteome has not been examined. To this end, we used stable isotope labeling of cells in culture (SILAC) to establish an unbiased and temporally dynamic assessment of the effect of hyperglycemia on the SC mitochondrial proteome. SILAC has been used extensively for quantifying changes in organellar proteomes 11 and requires at least two distinct populations of SCs that are differentially labeled with, for example, 12C-Lys or 13C6-Lys. After 5–6 population doublings, the SCs readily incorporate the 13C6-Lys into their proteome such that at least 95% incorporation is obtained within 10 days 12. After the labeling period, one population of the cells serves as a control and the other is subjected to hyperglycemic stress for various periods of time. Cell lysates are then prepared, mixed together in a 1:1 mass ratio and specific sub-proteomes are enriched prior to analysis 13.
In the present study, SCs subjected to hyperglycemic stress for 2, 6 or 16 days exhibited an overall increase in the expression of numerous mitochondrial proteins associated with a broad range of biochemical functions. Although hyperglycemia increased the expression of protein components of the respiratory chain, this correlated with a decreased mitochondrial efficiency toward ATP generation. Concurrent measures of the rate of extracellular acidification indicated a shift toward glycolysis. Unexpectedly, we found that hyperglycemia did not significantly increase superoxide production either acutely (< 6 hrs) or under conditions of more prolonged hyperglycemia (6 days) using two fluorimetric dyes. The lack of glucose-induced superoxide generation may arise in part from an increase in mitochondrial Mn-SOD. These data suggest that neonatal rat SCs are rather insensitive to glucose-induced superoxide generation in the mitochondria and that hyperglycemia affects the mitochondrial proteome independent of this marker of oxidative stress.
Experimental Section
Schwann Cell Isolation and Metabolic Labeling
Schwann cells (SCs) were isolated as described and were cultured in low glucose (5.5 mM) DMEM that was custom prepared conformed to Gibco DMEM (#12320), with the exception that L-arginine and L-lysine were omitted12. Complete medium contained the specified isotopic forms of Lys or Arg, 100 U/ml penicillin, 100 µg/ml streptomycin, 10% dialyzed FCS (dFCS, Atlas Biologicals, Fort Collins, CO) and 2 µM forskolin. In experiments not requiring stable isotopes, the medium was supplemented with 84 mg/l 12C-Arg and 125 mg/l 12C-Lys (K0). For SILAC analysis, the cells were also incubated in medium supplemented with 12C-Arg and U-[13C6]-L-Lys (13C6-Lys, K6). Primary SCs were used for 5 passages and were maintained in the labeling medium for at least 10 days prior to mass spectrometric analysis since this is the minimal labeling period necessary to obtain about 95% isotopic enrichment of the proteome 12. All the amino acids were prepared as 100x stock solutions in serum-free Arg/Lys deficient DMEM, sterile filtered and added to working volumes of medium. Unlabeled amino acids were obtained from Sigma Chemicals (St. Louis, MO) and >98% isotopically enriched amino acids were a product of Cambridge Isotopes (Andover, MA); no correction for isotopic purity was made in the quantitative measures.
Cell Fractionation for SILAC Analysis
For proteomic analysis, 10 ×15 cm plates of SCs were expanded in K0 or K6 complete medium yielding about 4 × 10⁷ cells per treatment. Since it was necessary to passage the primary SCs twice to obtain a sufficient cell number to seed into the ten plates, they have already been labeled to metabolic equilibrium. At this point, the Lys concentration was also decreased to 62.5 mg/l in both the K0 and K6 cultures to conserve the metabolic label and forskolin was not added to the medium to avoid possible confounding effects due to the growth promoting activity of the drug. After the cells became established, hyperglycemia was induced by adjusting the glucose concentration to 30 mM in the K6 or cultures (K0 in the reverse labeling experiment) and both sets of cells were incubated for 2, 6 or 16 days with a medium change every third day. The cells were trypsinized, washed twice with ice-cold phosphate-buffered saline (PBS) and resuspended in 10 ml of mitochondrial isolation buffer (MIBA) containing 10 mM Tris-HCl, pH 7.4, 1 mM EDTA, 0.2 M D-mannitol, 0.05 M sucrose, 0.5 mM sodium orthovanadate, 1 mM sodium fluoride and 1× Complete® Protease Inhibitors (Roche Diagnostics) 14. The cells were homogenized with the aid of a Teflon pestle and lysis was confirmed microscopically. The protein concentration of each lysate was measured in quadruplicate using the Bradford assay and bovine serum albumin as the standard. The coefficient of variation was determined for each set of quadruplicate measures and if the variability exceeded 5%, the protein assay was repeated for that set of samples. The samples were then mixed together in a 1:1 mass ratio yielding 24–30 mg of protein.
Nuclei were isolated from the pooled lysates by centrifugation at 500 × g at 4°C for 5 min. The crude nuclei were washed with PBS and further purified as described below. The remaining S1 supernatant was centrifuged at 8,000 × g for 10 min at 4°C, yielding the S2 supernatant and the heavy mitochondrial (HM) fraction. The HM fraction was washed twice with MIBA and resuspended in 3 ml of 25% Nycodenz prepared in 10 mM Tris-HCl, pH 7.4,1 mM EDTA, 0.25M sucrose. Mitochondria were purified by centrifugation at 50,000×g for 90 min at 4°C in a SW41 rotor over a discontinuous gradient of 40%, 34%, 30%, 25% (HM), 23% and 20% Nycodenz as described 14. The mitochondria that sedimented at the 25%–30% interface were recovered, the fraction was diluted with MIBA and the mitochondria pelleted by centrifugation at 10,000 × g for 10 min at 4°C. The final mitochondrial pellet was resuspended in 0.1–0.15 ml MIBA.
A cytosolic fraction was obtained from the S2 supernatant by centrifugation at 100,000 × g for 60 min at 4°C. The resulting cytosol was concentrated at 4°C to less than 0.5 ml using an Amicon Ultra filter device with a 10,000 nominal molecular weight limit. Nuclei were purified following the procedure of Hwang et al. 15. Briefly, the crude nuclei were resuspended in 20 mM HEPES-KOH, pH 7.5, 10 mM KCl, 1 mM EDTA, 1 mM DTT, 0.25 M sucrose and mixed with an equal volume of 20 mM HEPES-KOH, pH 7.5, 10 mM KCl, 1 mM EDTA, 1 mM DTT, 2.3 M sucrose (both buffers contained the Complete protease inhibitor cocktail). The nuclei sample was then layered directly over the 2.3 M sucrose buffer and centrifuged at 60,000 × g for 90 min at 4°C in a SW41 rotor. The nuclear pellet was washed with MIBA and resuspended in 0.1–0.15 ml of this buffer.
To assess organelle enrichment, 3 µg of protein was fractionated by SDS-PAGE. After transfer to nitrocellulose, immunoblot analysis was performed using the following antibodies against marker proteins for mitochondria, MnSOD (Upstate Biotechnology, Lake Placid, NY) and prohibitin-1 (Neomarkers, Freemeont, CA); nuclei, p62 nucleoporin (BD Transduction Labs, Lexington, KY); endoplasmic reticulum, GRP 78 (Santa Cruz Biotechnology, Santa Cruz, CA); and cytosol, lactate dehydrogenase (Sigma-Aldrich, St. Louis, MO).
Mass Spectrometry and Protein Identification
Proteins were identified following one-dimensional SDS-PAGE coupled to RP-HPLC linear quadrupole ion trap Fourier transform ion cyclotron resonance tandem mass spectrometry (GeLC-LTQ-FT MS/MS) 16. About 75–100 µg of protein was fractionated by SDS-PAGE, the proteins were visualized by staining the gel and the lane was cut into 12–15 sections for in-gel tryptic digestion.
The gel pieces were placed in silanized microfuge tubes and destained with 100mM ammonium bicarbonate in 50% acetonitrile 17. Following reduction (10mM dithiothreitol at 55°C for 1 hr) and alkylation (55mM iodoacetamide for 30 min in the dark at room temperature), the gel pieces were washed with 100mM ammonium bicarbonate in 50% acetonitrile, dehydrated with 100% acetonitrile and dried. The gel pieces were rehydrated on ice in a minimal volume of 25 mM ammonium bicarbonate, pH 7.5 containing 12.5 ng/µl Trypsin Gold (Promega Corp., Madison, WI), covered with a sufficient volume of 25 mM ammonium bicarbonate, pH 7.5 and the proteins were digested overnight at 37°C. The peptides were extracted from the gel particles with 5% formic acid in 100 mM ammonium bicarbonate and 5% formate in 100% acetonitrile. The combined supernatants were concentrated to ~25 µl in a Speed-Vac prior to analysis.
Peptides were separated on a micro-capillary reverse-phase column (either 0.30 × 150 mm, Pepmap C18, or 0.32 × 50 mm, MicroTech Scientific) at a flow rate of 5 –10 µl/min with a linear gradient from 5 to 65% acetonitrile in 0.06% aqueous formic acid (v/v) over 55 min and the eluate was introduced into the LTQ-FT tandem mass spectrometer (ThermoFinnigan, Waltham, MA). All experiments were performed in data-dependent mode using dynamic exclusion with survey MS spectra (m/z 300–2000) acquired in the FT-ICR cell with resolution R = 25,000 at m/z 400 and accumulation to a target value of 5×10⁵ charges or a maximum ion accumulation time of 2000 ms. The three most intense ions were isolated and fragmented with a target value of 2 ×10³ accumulated ions and an ion selection threshold of 3000 counts. Dynamic exclusion duration was typically 200 sec with early expiration if ion intensity fell below a S/N threshold of 2. The ESI source was operated with a spray voltage of 2.8 kV, a tube lens offset of 170 V and a capillary temperature of 200 °C. All other source parameters were optimized for maximum sensitivity of a synthetic YGGFL peptide ion at m/z 556.27.
The MS/MS peak list was generated from the Xcalibur raw files using DTA Supercharge (v 1.17) (http://msquant.sourceforge.net). The individual text files were linked to their corresponding LTQ-FT raw file and concatenated with the aid of an in-house modified Perl script (MultRawPrepare) originally obtained from the MSQUANT web address. The concatenated file was submitted to Mascot (v. 2.1, Matrix Science, London, United Kingdom) and proteins were identified by searching a combined IPI mouse/rat (v3.26) database concatenated with their reverse sequences (188,450 total sequences). Search parameters specified a maximum mass deviation of 10 ppm, a fragment tolerance of 0.5 Da, up to1 missed cleavage and carboxyamidomethylated cysteine as a fixed modification. Variable modifications were set to consider protein N-terminal acetylation, N-terminal pyro-glutamine, methionine oxidation and the presence of 13C6-Lys. The Mascot search results were imported into Scaffold Protein Identification software (v 2.0, Proteome Software, Portland, OR) and reanalyzed using the X! Tandem search algorithm to enhance and further validate peptide and protein identification. The peptide filter was set to a 95% confidence level and proteins validated by Scaffold at this confidence level or greater were considered identified without further verification. Manual verification of other proteins, especially those identified by a single peptide, followed an acceptance criteria which required a fully tryptic peptide that was at least 7 amino acids in length, had a detected series of at least 4 consecutive y-ions or b-ions and a Mascot ion score of 25 or greater at a mass deviation of ≤ 6 ppm (3 times the dispersion of the mass deviations). Using these criteria for peptide identification, the overall false positive rate was estimated18 as <0.5% between the various time points used in the proteomic analyses.
To asses the statistical mass accuracy between the experiments, the distribution of calibrated mass errors for all peptides initially identified in the search was obtained from MSQUANT and the errors were binned by 2 ppm intervals 19. The errors between the mitochondrial analyses followed a normal distribution and the average calibrated absolute mass deviation was 2.63 ± 0.21 ppm and the average dispersion was 1.97 ± 0.19 ppm. (Supplemental Fig. 1).
Protein Quantification, Statistical and Bioinformatic Analyses
The expression ratio of individual peptide pairs was obtained using MSQUANT 20. However, it was also necessary to manually quantify peptide pairs and verify a subset of the MSQUANT results using peak intensities from Xcalibur software (v2.0 SR1). If similar peptides of different charge states were detected, only the peptide with the highest ion score was counted toward identification and quantified. Similarly, redundant peptides containing a modification were only counted toward identification and quantified if an un-modified peptide was not detected. If multiple peptide pairs were quantified for the same protein, an overall protein expression ratio was taken as the average of these measures and the standard deviation was determined. The protein lists from MSQUANT were imported into Protein Center (Proxeon Bioinformatics, Odense, Denmark) and redundant mouse-rat orthologs and database entries were removed after clustering at 60% homology. The anchor protein used for clustering a given group of proteins is indicated in Supplementary Tables 1–3.
As previously reported, 3 times the average standard deviation of all the expression ratios at a given time point was assigned as the threshold for indicating a significant change 21. For example, of 1,251 proteins identified at all times points in the mitochondrial fractions, 991 (79%) were quantified and 556 were quantified by ≥2 unique peptides. The average standard deviation obtained in these three separate experiments was 0.111 ± 0. 02, indicating that the analytic variability was tightly clustered at about 11%. Using the above criterion, proteins whose expression ratios were < 0.67 or > 1.33 were defined as showing a significant change.
Proteins were automatically annotated with respect to cell localization using Protein Center and via manual annotation from the SwissProt database. Bioinformatic analyses were performed using Ingenuity Pathway Analysis (v 7.0, Ingenuity Systems, Redwood CA) and BinGO 22. After setting a bidirectional 1.3 fold change as the threshold, the program identified statistically over or under represented molecular networks. Pathways with p <0.001 using the HyperGeometric test after correcting for multiple term testing by the Benjamini & Hochberg False Discovery Rate (B-H FDR) were deemed enriched.
Mitochondrial Respiration and Extracellular Acidification Measures
The rates of O2 consumption (OCR) and extracellular acidification (ECAR) were assessed on intact SCs using an Extracellular Flux Analyzer (Seahorse Biosciences, North Billerica, MA). Extracellular flux analysis is a non-invasive assay which uses two calibrated optical sensors which directly measure OCR and ECAR in cells that remain attached to the culture plate. This technique avoids variability associated with trypsinization and mechanical stirring of the cells to determine OCR. Primary SCs were treated with 5.5 mM or 30 mM glucose for 3 days and baseline respiration was determined. Respiratory chain inhibitors were sequentially injected into the wells and ATP-coupled oxygen consumption was calculated as the oxygen consumption rate sensitive to 1 µM oligomycin, an ATP synthase inhibitor, after correcting for nonmitochondrial respiration. Proton leak was calculated as the mitochondrial rate insensitive to oligomycin, after correcting for non-mitochondrial respiration. The maximal uncoupled respiration rate was determined by depolarizing the mitochondrial membrane potential with 1 µM FCCP (carbonylcyanide-4-(trifluoromethoxy)-phenylhydrazone) and non-mitochondrial respiration was determined as the activity remaining after inhibition of complexes 1 and 3 with 1 µM rotenone and 1 µM myxothiazol, respectively. Changes in ECAR are an indirect assessment of glycolytic activity due to lactic acid production and proton extrusion and were measured concurrent with oxygen consumption 23. After the measures, the cells were harvested, protein concentration of each well was determined and experimental rate values were normalized to protein content.
Superoxide Assessment and Mn-SOD Activity assay
Superoxide levels were measured by following the oxidation of dihydroethidine (Invitrogen-Molecular Probes, Carlsbad, CA) to ethidium 24. SCs were seeded at 1 × 10⁴ cells per well in 96 well plates and were treated with 5.5 mM or 30 mM glucose for the indicated times once reaching about 90% confluency. At the end of the incubation, the cells were incubated with 15 µM dihydroethidine for 15 mins at 37°C. The cells were washed with PBS and the ratio of ethidium (excitation 530 nm, emission 590 nm) to dihydroethidine (excitation 485 nm, emission 530 nm) was determined with the cells attached to the plate using a fluorescence spectrometer.
For assessing superoxide production using MitoSOX Red25, SCs were grown in low glucose DMEM in six well plates until confluent. Cells were incubated in medium containing 5.5 mM or 30 mM glucose for 6 days and the cells were washed once with OPTI-MEM medium. MitoTracker Green (80 nM) was added to each well and after 10 min, 2.25 µM MitoSOX Red was added into the wells and the cells incubated for an additional 10 mins. The cells were washed twice with fresh OPTI-MEM medium prior to imaging on an Olympus 3I Spinning Disk confocal microscope using excitation/ emission wavelengths of 575/624 nm (MitoSox Red) and 494/531 nm (MitoTracker Green). As a positive control, some cells were treated with 1.8ug/ml Antimycin A in OPTI-MEM medium with 1% BSA for 25 mins. Fluorescence intensity of the red and green signals of at least 200 cells per treatment was obtained using CellProfiler and CellProfiler Analyst image analysis software.
To assess manganese superoxide dismutase (Mn-SOD) activity, SCs were seeded into 10 cm plates and treated with 5.5 mM or 30 mM glucose for the indicated times after reaching about 90% confluency. The cells were trypsinized and three plates per treatment were combined to isolate a heavy mitochondrial fraction as described above. Mn-SOD activity was determined as described by the manufacturer (Dojindo Molecular Technologies, Gaithersburg, MD) using 0.5 – 3 µg of the heavy mitochondrial fraction. To inhibit Cu/Zn SOD, the protein was preincubated with 2 mM KCN for 30 mins at 4°C prior to assaying for MnSOD activity 14.
Results
Analysis of the SC Organellar Fractions
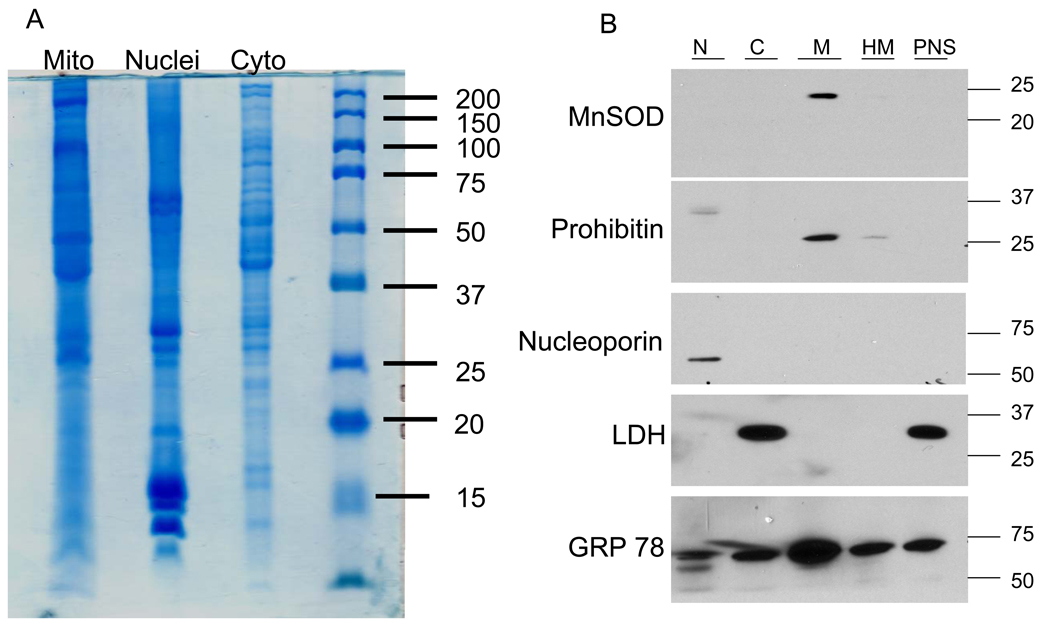
Although the primary focus of the study was on assessing the effect of hyperglycemia on altering the mitochondrial proteome, nuclei and cytosolic fractions were also isolated as described in the Experimental Methods (Fig. 1A). Organelle purity was assessed following SDS-PAGE of and immunoblot analysis for the presence of established protein markers of nuclei, mitochondria, endoplasmic reticulum and cytosol (Fig. 1B). As expected, the mitochondrial fraction was enriched in the inner mitochondrial membrane and matrix proteins, prohibitin 1 and MnSOD. Neither marker protein for cytosol (lactate dehydrogenase) or nuclei (p62 nucleoporin) was detected in the purified mitochondrial fraction but it did remain contaminated with endoplasmic reticulum. Indeed, we repeatedly found GRP78 in most fractions and it proved difficult to remove from the mitochondrial fraction by using either Nycodenz or Percoll discontinuous gradients (). Although GRP78 is a resident protein of the endoplasmic reticulum, it is also secreted from the organelle which may contribute to its cytosolic localization.
Figure 1. Assessment of Organelle Purity.
K0 and K6 primary SCs were cultured for 16 days in 30 mM glucose, lysates were prepared and mixed together in a 1:1 mass ratio. Nuclear, mitochondrial and cytosolic fractions were isolated and 75 µg of protein was separated by SDS-PAGE for proteomic analysis (A) or 3 µg was subjected to immunoblot analysis (B) for the indicated organelle marker.
Hyperglycemia has temporally distinct effects on nuclear and mitochondrial protein expression
To perform a temporal analysis of the effect of hyperglycemia on the SC proteome, metabolically labeled cells (K6) were treated with 30 mM glucose for 2, 6 or 16 days while unlabeled control cells (K0) were maintained in 5.5 mM glucose at each time point. This time course was chosen to model the effect of acute and more chronic hyperglycemia on the primary SCs. Although triple labeling can be performed for temporal analyses by SILAC 26, we only used 13C6-Lys as a single metabolic label and performed three separate experiments to cover the time course. Mitochondrial, nuclear and cytosolic proteins were separated by SDS-PAGE, in-gel digested with trypsin and the peptides were analyzed by GeLC-LTQ-FT MS/MS. The acquired mass spectra were searched against a combined mouse-rat IPI database and we identified 1,673 proteins from the various cell fractions at all time points and 1,198 (71.6%) of these proteins were unique.
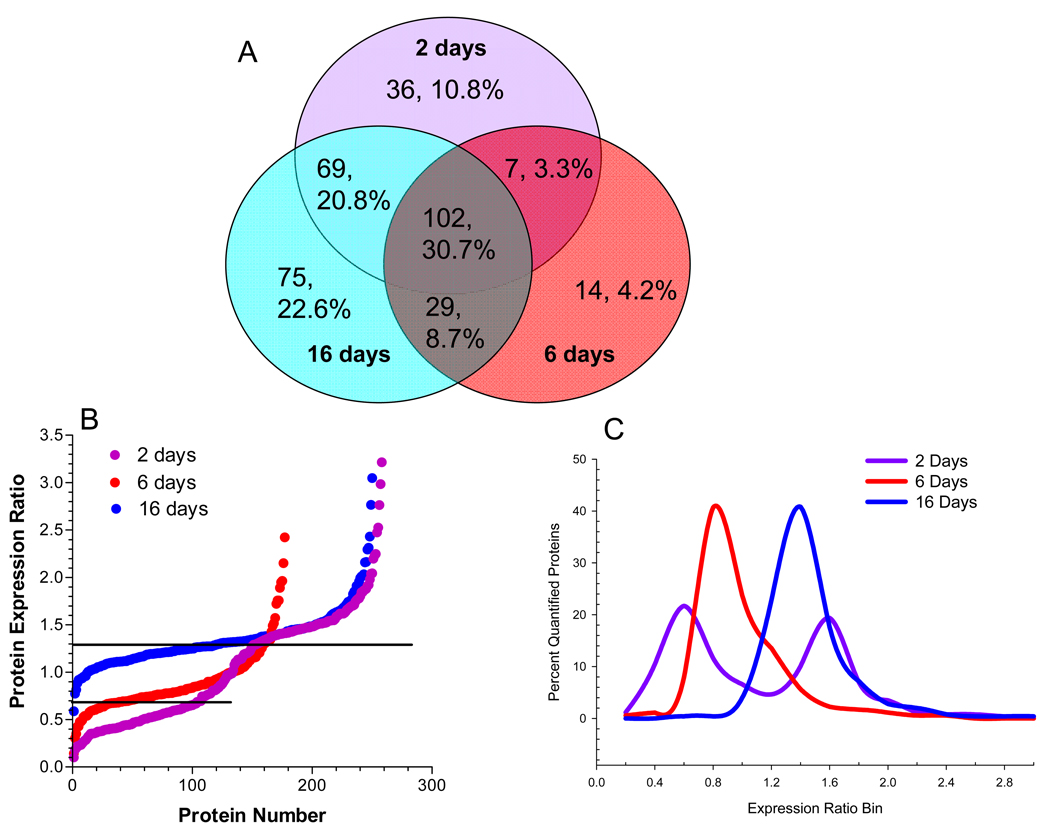
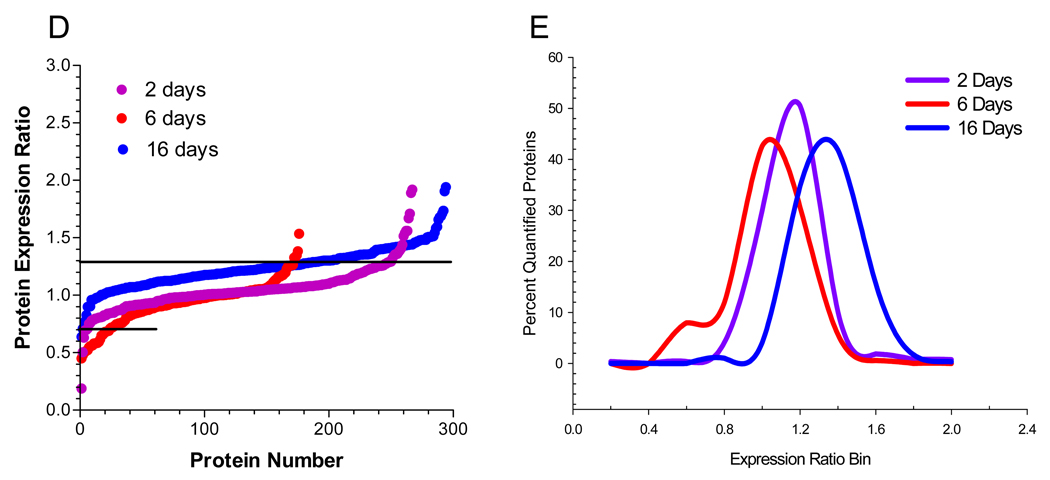
Analysis of the nuclear fraction identified 332 total proteins, of which, 64% were detected at 2 or more time points (Fig 2A). Among the total proteins identified in this fraction, resident nuclear proteins were identified by their gene ontology (GO) annotation and 213 nuclear proteins were quantified using 1,145 peptides (Supplementary Table 1). In order to broadly compare the temporal effect of hyperglycemia on the nuclear proteome, the quantified proteins were ranked by their expression ratio and plotted versus protein number (Fig. 2B) or the expression ratios were binned and the percent of proteins per bin was determined (Fig. 2C). Increases in nuclear protein expression were rather similar between 2 and 16 days of hyperglycemia with 40% and 51% of the quantified proteins showing a statistically relevant increase, respectively. In contrast, 6 days of hyperglycemia led to 35% of the nuclear proteins showing a decreased expression. On the other hand, hyperglycemia had little effect on proteins identified in the cytoplasmic fraction (Supplementary Table 2). Although the majority of cytoplasmic proteins showed no significant change after 2 (91.7%) or 6 (84.0%) days of hyperglycemia, about 34% of the quantified proteins showed an increased expression after 16 days (Figs. 2D and E).
Figure 2. Hyperglycemia has Differential Effects on the Nuclear and Cytoplasmic Proteomes.
SCs were incubated in medium containing 5.5 mM (K0) or 30 mM (K6) medium for 2, 6 or 16 days and nuclear and cytoplasmic fractions were analyzed by GeLC-LTQ-FT MS/MS. (A) Venn diagram of number and percent of annotated nuclear proteins identified at each time point. To compare the effect of 2, 6, or 16 days hyperglycemia on the nuclear (B,C) or cytoplasmic (D,E) proteomes, the expression ratios were plotted versus protein number (B,D) or binned by 0.2 units and expressed as a percent of the total quantified proteins (C,E). Line indicates three times the standard deviation of the analytic variability and proteins between the lines did not show a significant change.
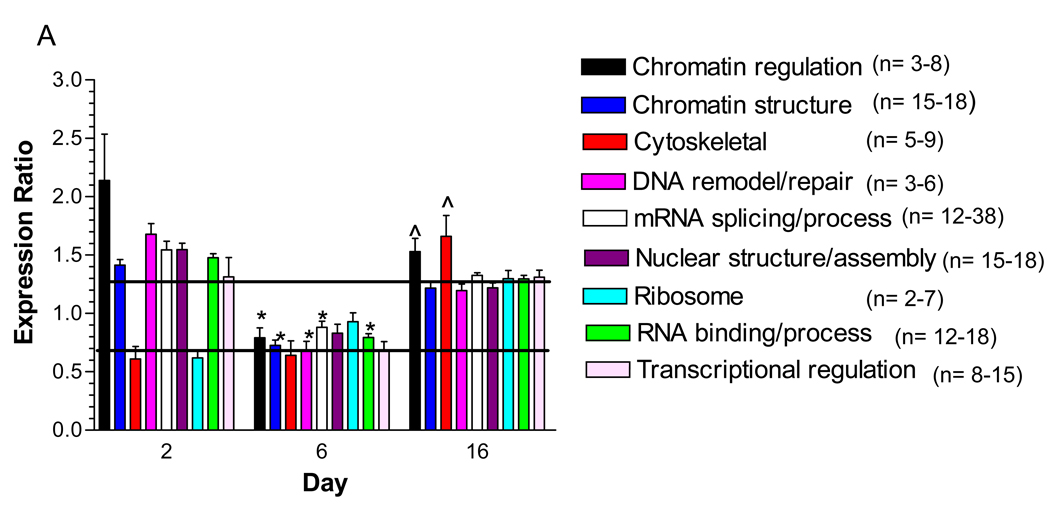
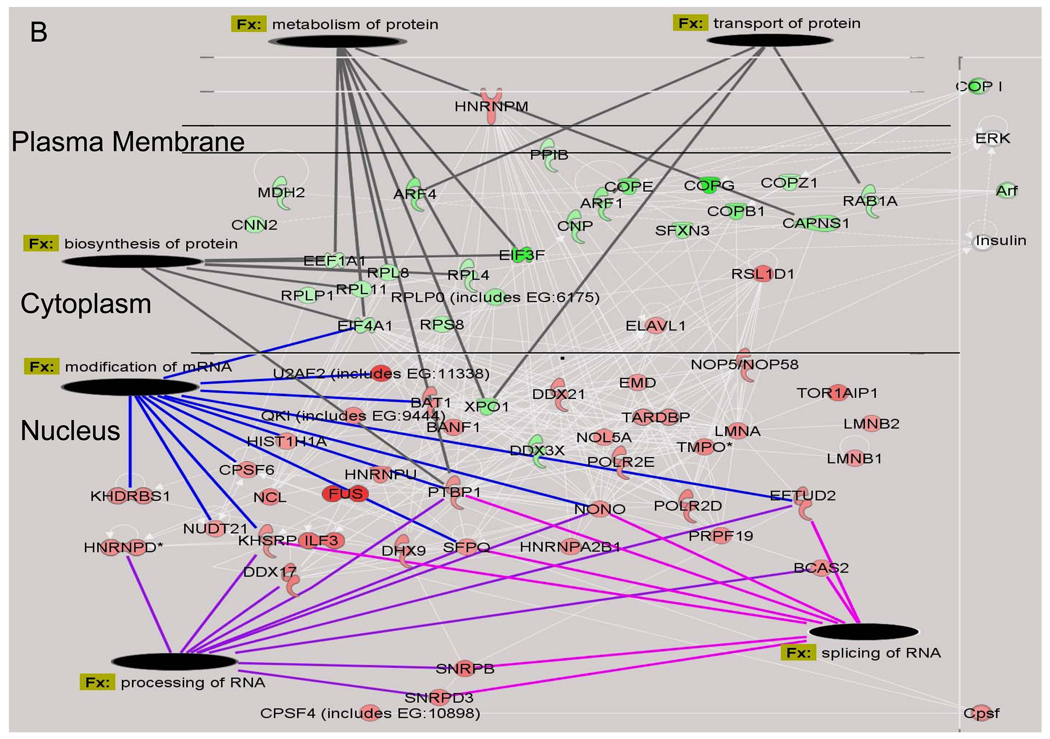
BinGO was used to determine if any biological processes were over-represented among the nuclear proteins that showed a significant change in their expression ratio after hyperglycemic stress 22. Proteins affecting chromatin regulation, DNA remodeling and transcription were over-represented after 2 days of hyperglycemia (Fig. 3A). This result was consistent with the pathway analysis which found that the top two molecular networks affected by hyperglycemia were associated with increases in mRNA processing, splicing and modification and DNA repair (Fig. 3B). Conversely, proteins associated with protein transport, biosynthesis and metabolism were either marginally decreased or unchanged, especially since the majority of these proteins are cytoplasmic.
Figure 3. Identification of Functional Classes of Nuclear Proteins Affected by Hyperglycemia.
A) Quantified proteins were grouped based upon their annotated function. The expression ratios of all proteins associated with a function were averaged and the line indicates three times the standard deviation of the analytic variability associated with the quantitation. Categories above or below these limits define a significant change in expression. The number of quantified proteins per category is indicated in the legend. Significant differences between time points were determined using a one-way ANOVA and Tukey’s post hoc test. *, p< 0.05 compared to 2 days, ^, p < 0.05 compared to 6 days. B) The top two molecular networks affected after 2 days of hyperglycemia were identified using Ingenuity Pathway Analysis, merged and graphically presented to highlight the increase in proteins regulating mRNA processing and the decrease in proteins regulating protein synthesis, metabolism and transport. Gene names are identified in Supplementary Table 4.
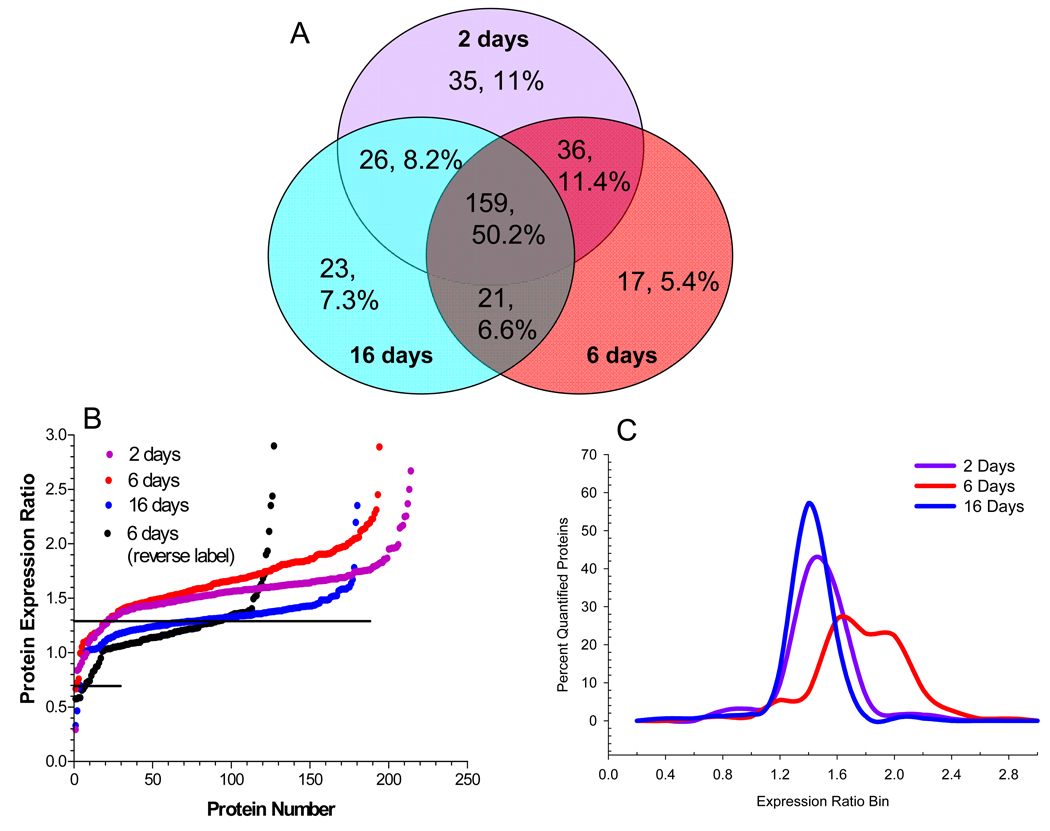
Mitochondrial proteins were identified by their GO annotation in Protein Center and by filtering against a reference set of 1,022 mouse mitochondrial proteins downloaded from the MitoP2 project (http://141.39.186.157:8080/mitop2/, last updated Nov. 2008). Using this approach, we identified 317 unique proteins that either reside or are associated with mitochondria and detected 242 proteins (76.3%) at two or more time points (Fig. 4A). Using 1,599 peptides, 248 proteins were quantified but the detection of only Arg-containing tryptic peptides negated quantification of the remaining 69 proteins. Only 16 (5.0%) non-quantifiable mitochondrial proteins were identified by a single peptide at a single time point and the ion scores and MS2 spectra for these peptides are shown in Supplementary Table 3.
Figure 4. Temporal Profile of the Effect of Hyperglycemia on the Mitochondrial Proteome.
SCs were incubated in medium containing 5.5 mM (K0) or 30 mM (K6) medium for 2, 6 or 16 days and mitochondrial fractions were analyzed by GeLC-LTQ-FT MS/MS. (A)Venn diagram of number and percent of annotated mitochondrial proteins identified at each time point. To compare the effect of 2, 6, or 16 days hyperglycemia on the mitochondrial proteome, the expression ratios were plotted versus protein number (B) or binned by 0.2 units and expressed as a percent of the total quantified proteins (C). Reverse label indicates results from an experiment where control cells were labeled in K6 medium. Line indicates three times the standard deviation of the analytic variability and proteins between the lines did not show a significant change.
After 2 or 6 days of hyperglycemia, approximately 90% of all mitochondrial proteins showed a statistically relevant increase (Fig. 4B). However, about 21% of the proteins increased expression ≥1.9-fold after 6 days of hyperglycemia compared to only 7.0% and 1.1% after 2 or 16 days of glycemic stress (Fig. 4C). Indeed, after 16 days of hyperglycemia, only 56% of the mitochondrial proteins increased above 1.3 fold.
The analytic and biologic confidence of these changes is strengthened by the observation that when the SILAC experiment was reversed (K6 cells as control and K0 subjected to 6 days of hyperglycemia), the overall effect on the mitochondrial proteome was similar (Fig. 4B). Secondly, immunoblot analysis for prohibitin 1 showed a similar increase in expression after 6 days of hyperglycemia as was determined by the SILAC analysis (Supplementary Fig. 2). Additionally, proteins known to exist in a 1:1 subunit stoichiometry showed similar changes at each time point 27. For example, after 2 days of hyperglycemia, quantitation of 6 –10 peptides identifying the α and β subunits of ATP synthase indicated an increase of 1.66±0.11 and 1.49±0.11, respectively. Agreement between changes in ATP synthase subunit levels was also preserved after 6 (1.50±0.09 and 1.59±0.11) or 16 days (1.30±0.12 and 1.369±0.11) of hyperglycemia. Similarly, the relative change in the α and β subunits of the E1 component of the pyruvate dehydrogenase were tightly correlated (Supplementary Table 3). Lastly, the average expression ratio of all contaminating non-mitochondrial proteins did not show a statistically relevant change after 6 (176 proteins) or 16 (228 proteins) days of hyperglycemia although a 1.42 fold increase was noted after 2 days of hyperglycemia (145 proteins).
Hyperglycemia increases the expression of proteins contributing to mitochondrial dysfunction and decreases the efficiency of oxidative phosphorylation
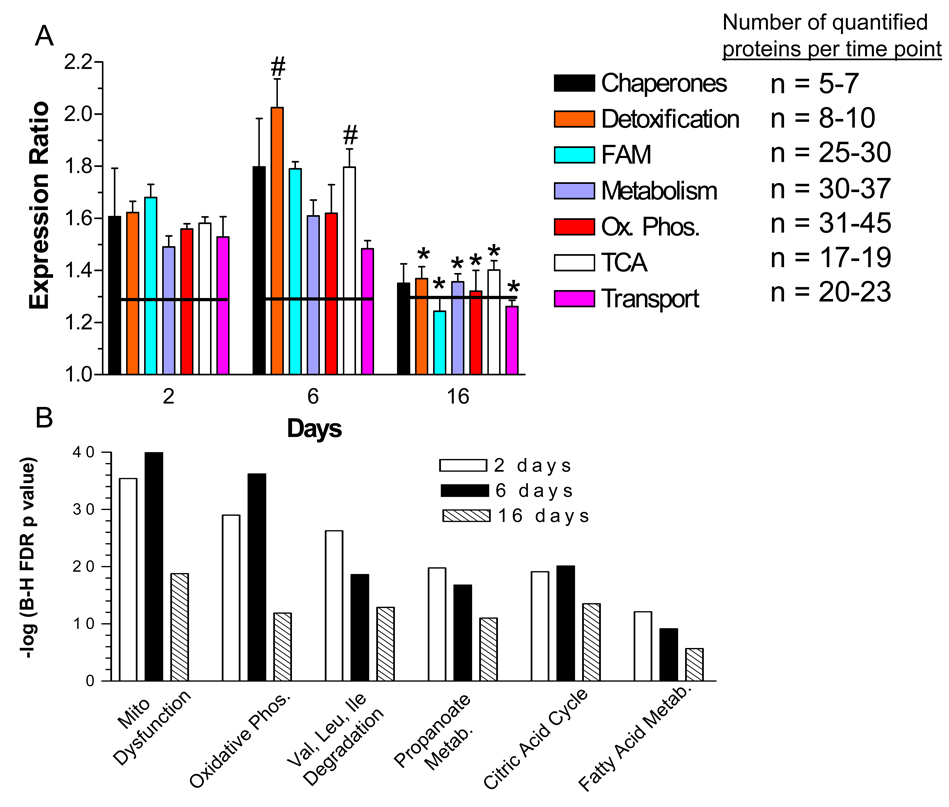
The above analysis strongly suggests that the mitochondrial proteome undergoes a marked increase in protein expression during hyperglycemia stress. This response would suggest that proteins involved in coordinated metabolic functions such as glucose metabolism, oxidative phosphorylation, lipid metabolism, stress response mediators and gene expression may respond in a concerted manner. Clustering the mitochondrial proteins by functional class showed that the quantified components of the mitochondrial respiratory chain exhibited a significant increase in expression after 2 and 6 days of hyperglycemia (Fig. 5A). This corresponded with a 1.6 to 1.8-fold increase in components of the TCA cycle which provides the reducing equivalents utilized by the respiratory chain. However, after 16 days, there was a significant decline in expression of proteins associated with the TCA cycle as well as with complexes I and V.
Figure 5. Temporal Effect of Hyperglycemia on Functional Classes of Mitochondrial Proteins.
A) Quantified proteins were grouped based upon their annotated function. The expression ratios of all proteins associated with a function were averaged and the line indicates three times the standard deviation of the analytic variability associated with the quantitation. Categories above or below these limits define a significant change in expression. The number of quantified proteins per category is indicated in the legend. Significant differences between time points were determined using a one-way ANOVA and Tukey’s post hoc test. #, p< 0.05 compared to 2 days, *, p < 0.05 compared to 2 and 6 days. FAM, fatty acid metabolism; Ox Phos, oxidative phosphorylation. B) The top over-represented toxicologic functions were identified using Ingenuity Pathway Analysis. Ordinate values are –log of the Benjamini-Hochberg False Discovery Rate p-value.
To identify the top metabolic processes affected by hyperglycemia over time, the data sets were subjected to pathway analysis. Mitochondrial dysfunction, oxidative phosphorylation and the TCA cycle were among the top over-represented canonical pathways after 2 or 6 days of hyperglycemia (Fig. 5B). These data are consistent with previous work which demonstrated that hyperglycemia increased the transcript levels for components of oxidative phosphorylation in diabetic sensory ganglia 28. Proteins annotated to mitochondrial dysfunction were linked primarily to the regulation of respiration and detoxification of reactive oxygen species.
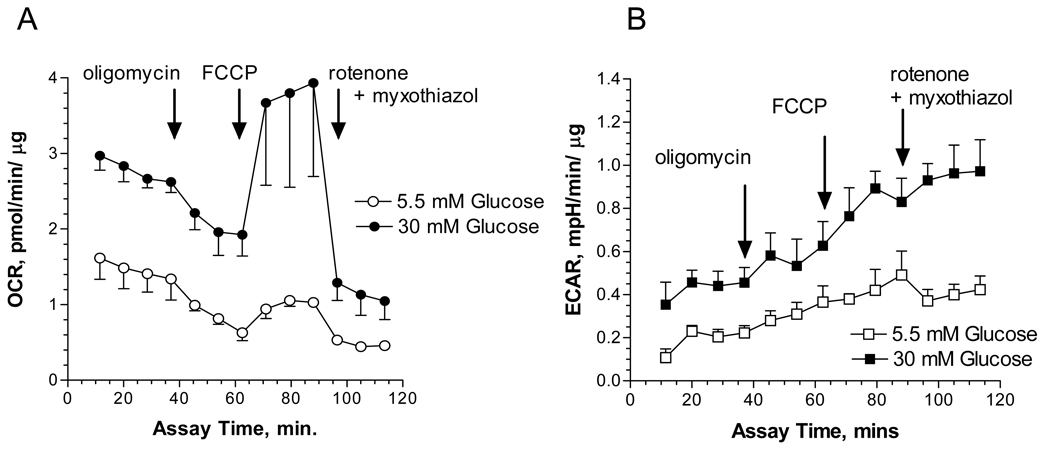
Since proteins associated with the TCA cycle and oxidative phosphorylation were increased, this suggested that hyperglycemia was affecting mitochondrial activity. SCs were subjected to hyperglycemic stress for three days and the rate of oxygen consumption was measured over 2 hrs using intact SCs. Since the oxygen consumption rates (OCR) and extracellular acidification rates (ECAR) are affected by metabolic activity and the number of cells 23, both indices were normalized to total protein. Hyperglycemia increased the overall rate of oxygen consumption and part of this effect was related to a 1.5 fold increase in non-mitochondrial oxygen consumption by hyperglycemia: basal OCR minus rotenone + myxothiazol insensitive OCR (Fig. 6A). Coupled respiration and proton leak were determined using the ATP synthase inhibitor, oligomycin. In the presence of 5.5 mM glucose, SCs devoted 88.2 ± 16.6% of their mitochondrial respiration for ATP production and 11.8 % to proton leak. Under hyperglycemic conditions, ATP coupled respiration decreased to 64.5 ± 12.2% and proton leak increased to 35.4%. Thus, hyperglycemia decreased mitochondrial efficiency by uncoupling oxygen consumption from ATP production. Consistent with a decrease in the efficiency of oxidative phosphorylation, hyperglycemia increased extracellular acidification by 2.1 ± 0.4 fold, suggesting an increase in the rate of glycolysis (Fig. 6B) 29.
Figure 6. Hyperglycemia Increased the Oxygen Consumption Rate and Extracellular Acidification.
SCs were subjected to hyperglycemic stress for 3 days and the oxygen consumption rate (OCR) (A) and extracellular acidification rate (ECAR) (B) were measured in intact cells using an Extracellular Flux Analyzer. Oligomycin, FCCP and rotenone/myxothiazole were added at the indicated times to determine the rate of proton leak and O2 coupled ATP production. Respiration experiments were repeated three times and the results presented are four replicate measures per time point from one representative experiment.
Hyperglycemia increased the expression of MnSOD but not the production of superoxide anion
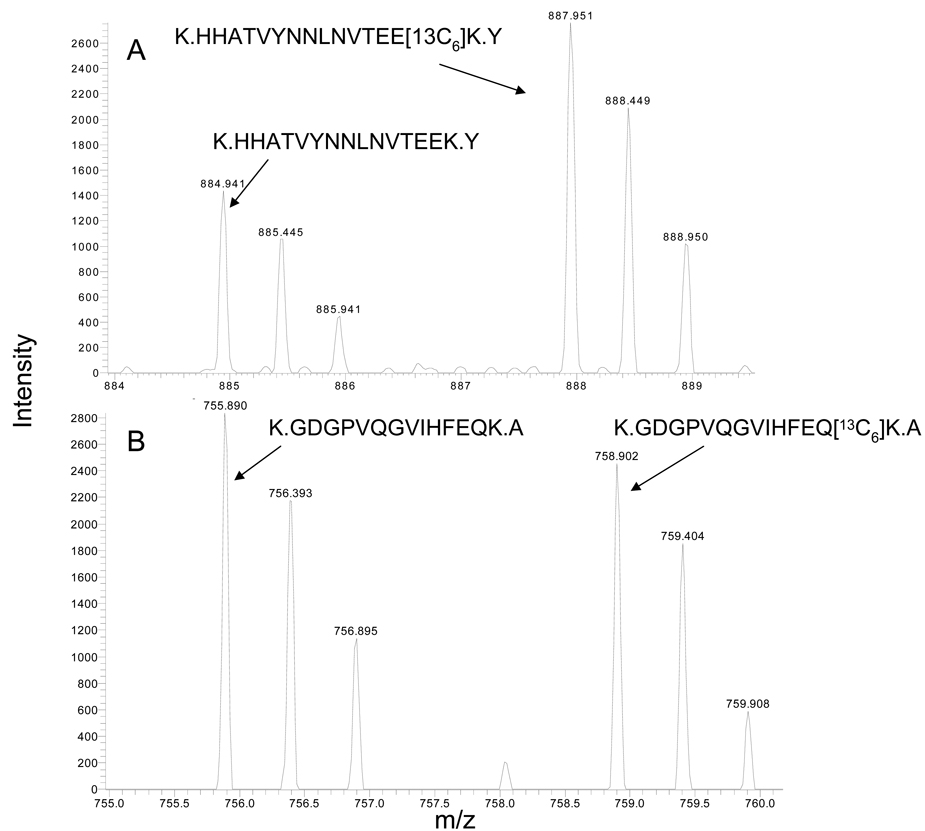
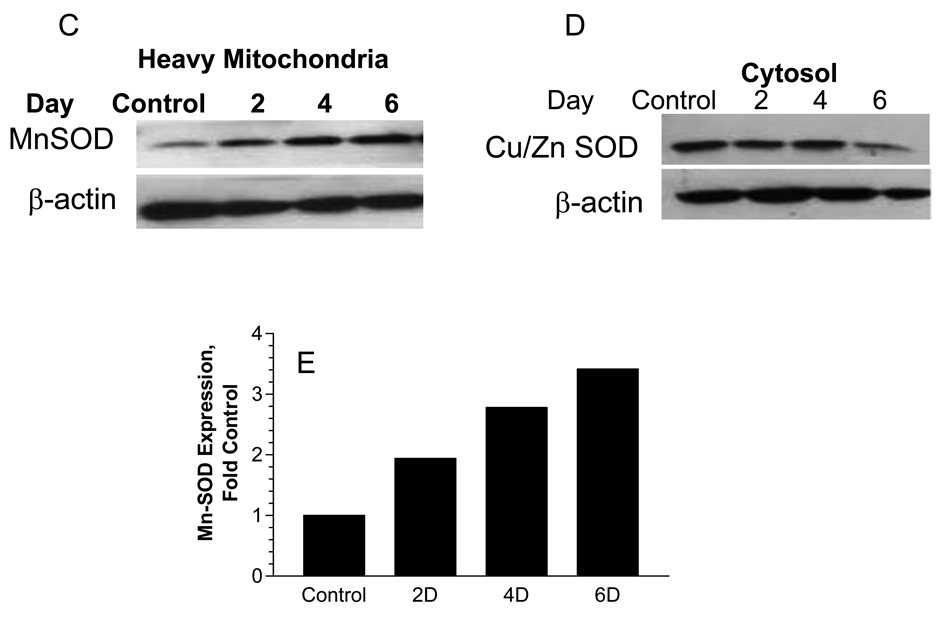
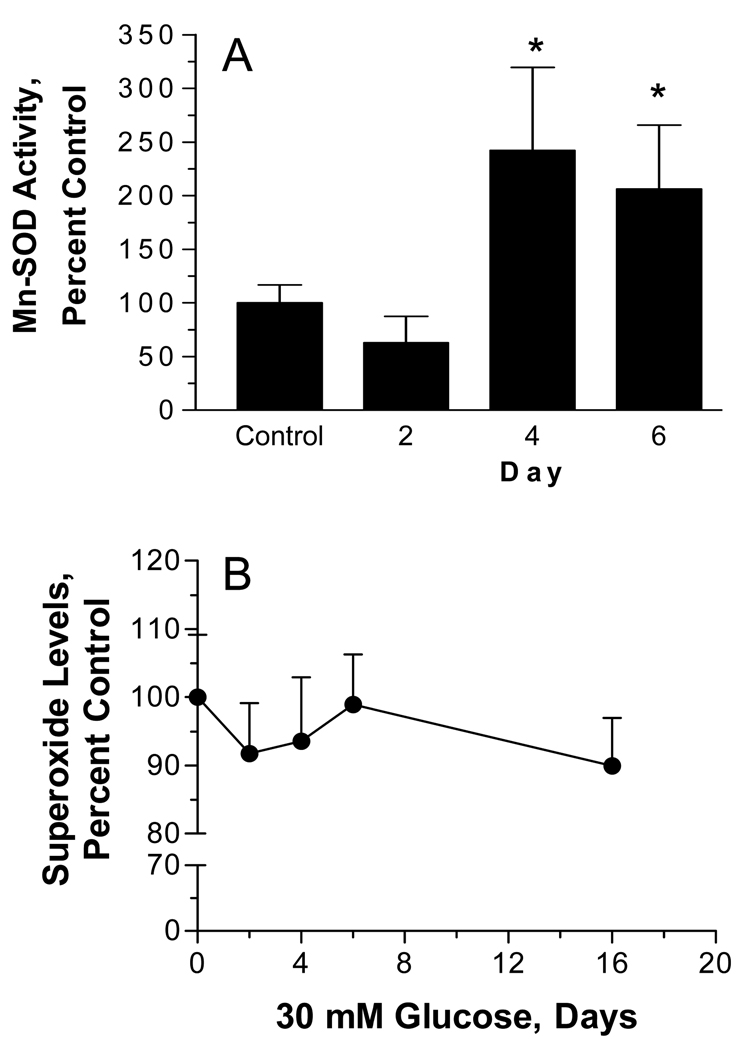
Proteins annotated to mediating mitochondrial detoxification responses showed the largest increase as a class after 6 days of hyperglycemia. Among this group, SILAC analysis indicated that MnSOD (Fig. 7A) expression increased about 2.0 fold after 6 days of hyperglycemia. The increase in Mn-SOD was specific since a similar change was not observed in the cytosolic Cu/Zn SOD (Fig. 7B). These differences were confirmed in separate experiments by immunoblot analysis as well. SCs were treated with 5.5 mM or 30 mM glucose for 2–6 days and heavy mitochondrial and cytosolic fractions were obtained. Curiously, the magnitude of the increase in MnSOD in the heavy mitochondrial fraction seemed slightly greater by immunoblot analysis but was nonetheless consistent with that observed in the purified mitochondria (Figs. 7C & 7E). Confirming the mass spectrometric analysis, hyperglycemia did not increase cytosolic levels of CuZn SOD (Fig. 7D). Consistent with our proteomic data, MnSOD activity also increased by 2–2.5 fold after 4–6 days of hyperglycemia (Fig. 8A). Lastly, to rule out that the observed changes were the result of osmotic stress, SCs were incubated with 30 mM L-glucose or mannitol for 6 days and a heavy mitochondrial fraction was isolated. No change was observed in the expression of Mn-SOD and prohibitin 1 (data not shown). Since L-glucose is not metabolized, these data suggest that osmotic stress was not sufficient to alter mitochondrial protein expression.
Figure 7. MnSOD but not Cu/Zn SOD Increased with Hyperglycemic Stress.
SCs were incubated with 5.5 mM (K0) or 30 mM (K6) glucose for 6 days and mitochondrial and cytosolic fractions were isolated. Spectra show MS1 scans indicating an increase in intensity of a representative labeled peptide from mitochondrial MnSOD (A) but no change in intensity of a labeled peptide for cytosolic Cu/Zn SOD (B). The expression of MnSOD (C) or CuZn SOD (D) was determined by immunoblot analysis using a heavy mitochondrial fraction and cytosolic fraction prepared from SCs were treated for the indicated days with 30 mM glucose. (E) MnSOD expression was normalized to β-actin levels and the average of two separate experiments is expressed as a fold control.
Figure 8. Acute Hyperglycemia Increased MnSOD Activity but not Superoxide Production.
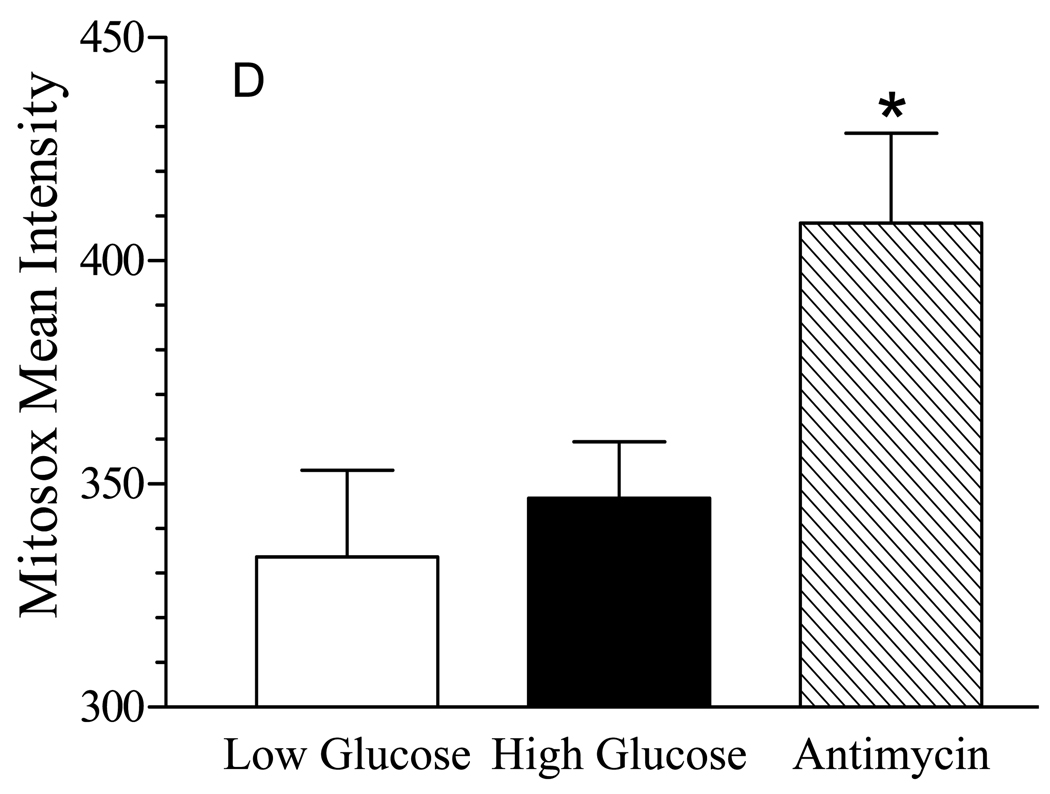
(A) SCs were incubated with 5.5 mM or 30 mM glucose for the indicated time and a heavy mitochondrial fraction was isolated. MnSOD activity was determined after a 30 min preincubation with 2 mM NaCN to inhibit residual Cu/Zn SOD activity and results are the mean ± SEM from three separate experiments. Asterisks indicate p < 0.05 compared to control. (B) SCs were incubated with 5.5 mM or 30 mM glucose for the indicated time and cellular superoxide levels were determined after the addition of 3 µM dihydroethidine. Results are the mean of four experiments perform with 8 replicates each and are expressed as a percent of control. (C) SCs were incubated with 5.5 mM or 30 mM glucose for 6 days, treated with MitoSox Red and MitoTracker Green and mitochondrial levels of superoxide were visualized by confocal microscopy. Incubation with Antimycin A served as a positive control for mitochondrial superoxide generation. (D) Quantitative image analysis of superoxide levels. Results are from a representative experiment performed twice and are the mean ± SEM from at least 200 cells per treatment. Asterisk indicates p< 0.05 versus low and high glucose treatments.
Glucose-induced production of superoxide within mitochondria has been suggested to be a key biochemical feature of glucotoxicity 9, 30. Surprisingly, no significant change in total cellular superoxide levels was observed in the SCs even after prolonged hyperglycemia (Fig. 8B). On the other hand, previous studies in embryonic sensory neurons cultured for several days in vitro have suggested that glucose-induced superoxide generation may occur shortly after exposure to high glucose 24. However, even after 4 – 6 hrs of hyperglycemia, we observed no significant increase in superoxide generation (data not shown). Since the above study monitored the cellular conversion of hyroethidine to ethidium, we next used the mitochondrially targeted derivative of hydroethidine, MitoSox Red along with co-staining for mitochondria using MitoTracker Green to more directly visualize if hyperglycemia increased superoxide in the mitochondria. Similar to the above results, six days of hyperglycemia did not significantly enhance mitochondrial superoxide production (Figs. 8C and 8D). However, the mitochondria were actively capable of producing this molecule since a brief incubation with antimycin A clearly increased mitochondrial superoxide generation as shown by the increase intensity of the yellow fluorescence.
Discussion
To date, few studies have used SILAC as an approach to examine the effect of hyperglycemic stress on primary cells that regulate glucose uptake or contribute to diabetic complications. However, the utility of SILAC in identifying novel proteins that may contribute to diabetes is highlighted by a recent report showing that cultured myotubes from extremely obese women secreted almost 3 times more myostatin than myotubes obtained from lean or moderately obese patients 31. Additionally, SILAC has been used to characterize the phosphoproteome of the insulin signaling pathway 21, 32, 33. In the present study, we provide the first quantitative characterization of the temporal effect of hyperglycemia on the proteome of cultured primary SCs using SILAC.
One benefit of the SILAC approach is that the isotopically-enriched amino acid is not preferentially incorporated into a given subproteome if a sufficient labeling period is performed. Therefore, we characterized the broad effect of hyperglycemia on the SC proteome by isolating cytoplasmic, nuclear and mitochondrial subcellular fractions. After 2 days of hyperglycemia, nuclear proteins affecting chromatin regulation, DNA remodeling and transcription increased but the mean expression ratio was 1.03 for all the proteins identified in nuclear fraction, suggesting a limited global effect. Similarly, hyperglycemia had little effect on altering cytoplasmic proteins at all time points but one cytoplasmic enzyme worth noting is aldose reductase. It is well recognized that an increase in aldose reductase activity contributes to the pathophysiology of diabetic neuropathy34, 35. Although we did not assess aldose reductase activity in the present study, the unbiased identification of aldose reductase indicated that its expression was unaffected by hyperglycemic stress in the cultured SCs. This lack of change in aldose reductase expression is consistent with previous reports that its mRNA level is not induced in hyperglycemic rat SCs 36 and that aldose reductase immunoreactivity does not increase in SCs of diabetic rat sciatic nerve37.
In large part, hyperglycemia had the greatest effect on the SC mitochondrial proteome since the average expression ratio was 1.51 for all proteins identified in the mitochondrial fraction. This result is consistent with previous reports that numerous mitochondrial proteins were increased in hearts obtained from OVE26 mice that were diabetic for 18 weeks38 and in cardiomyocytes from acutely hyperglycemic rats 39. For example, aconitase, ATP synthase α, prohibitin, ATP synthase D chain and GTP specific succinyl CoA synthetase increased to a similar level in both the hyperglycemically stressed SCs and in diabetic rat heart mitochondria 38. Interestingly, we also observed an increase in up-regulated during skeletal muscle growth protein 5, a poorly characterized mitochondrial protein which associates with ATP synthase40. This protein is also known as diabetes-associated protein in insulin sensitive tissues (DAPIT) since its mRNA decreased in muscle but not brain of diabetic rats 41. Thus, DAPIT may be a novel glucose-responsive protein that affects mitochondrial function in diabetic tissues. Although we did not explore the mechanism by which high glucose caused such a broad increase in mitochondrial proteins, evidence exists for an increase in mitochondrial biogenesis in diabetic heart38. Consistent with the possibility of an acute increase in mitochondrial biogenesis, mitochondrial transcription factor A is critical for the replication of mitochondrial DNA42, and it was increased approximately 1.7 fold after 2 or 6 days of hyperglycemia.
A recent report has demonstrated that diabetes induced a tissue-specific remodeling of the mitochondrial proteome in organs derived from 6 week diabetic Akita mice that did not necessarily correlate with changes in mitochondrial function43. For example, despite a diabetes-induced increase in proteins involved in oxidative phosphorylation and the TCA cycle, no changes were observed in mitochondrial respiration in organelles obtained from liver, brain or kidney43. However, in heart mitochondria, diabetes decreased the expression of proteins involved in oxidative phosphorylation and the TCA cycle and this correlated with a decrease in mitochondrial respiration. These data highlight the issue that hyperglycemic stress can differentially affect the mitochondrial proteome and respiratory activity. Since it is difficult to model chronic diabetes in a cell culture model, the overall increase in the SC mitochondrial proteome in our acute cell culture model may more reflect early protective responses to hyperglycemic rather than chronic damage. Proteomic analysis of mitochondria isolated from dorsal root ganglia and sciatic nerve of animals rendered diabetic for various durations will provide further insight into the utility of the primary cell models to address more mechanistic issues contributing to changes in the proteome associated with protective versus degenerative responses.
Despite the increase in mitochondrial respiratory proteins in heart mitochondria from diabetic mice, the respiratory control ratio was actually lower but the coupling of ATP production and oxygen consumption (P/O ratio) was not affected 38. Although mitochondrial respiration is often measured using purified mitochondria, the use of the XF24 Extracellular Flux Analyzer allowed us to use intact SCs to assess both mitochondrial and non-mitochondrial effects of glucose on oxygen consumption and medium acidification. In 5.5 mM glucose, ~88% of the mitochondrial oxygen consumption was coupled to ATP production in intact SCs. In contrast, hyperglycemia decreased the amount of ATP-coupled oxygen consumption by 27% and increased the extent of proton leak 3-fold. The decreased efficiency and increased proton leak suggests that hyperglycemia is lowering the P/O ratio, but we did not directly assess this parameter. Although our data does reflect the physiological response of the intact SCs to high glucose, it is difficult to directly compare these data with the lack of a change in the P/O ratio observed in mitochondria from diabetic heart 38 due to the different experimental conditions. Lastly, although glycolytic proteins did not increase in expression after 2 to 6 days of hyperglycemia, 3 days of hyperglycemia increased ECAR, which is an indirect measure of glycolytic activity (lactic acid production) and non-glycolytic acidification from CO2 production 23. These data suggest that the cultured SCs are highly glycolytic even in the absence of protein upregulation.
The putative physiological role of proton leak is to contribute to the uncoupling of electron transport from ATP synthesis (heat generation) and decrease oxidative stress by reactive oxygen species 44. Although increases in the mitochondrial membrane surface area and phospholipid composition can affect the basal leak rate, changes in the expression of the adenine nucleotide transporter 1 protein (ANT1) can also contribute to mild uncoupling 44. Previous data has shown that a 1.7 fold increase in ANT1 can increase proton leak by about 1.5 fold in isolated mitochondria 45. We found that hyperglycemia induced a 1.5 fold increase in ANT1 expression after 2–6 days (Supplementary Table 3) and this correlated with an increased proton leak from a basal level of 12% in 5.5 mM glucose to about 35%. Although uncoupling proteins may also contribute to enhanced proton leak, a genomic study of mouse peripheral nerve from embryonic day 17 through adulthood found that transcripts for the uncoupling proteins (UCP1 – 3) were not expressed 46. Thus, it is unlikely that hyperglycemia also increases UCPs but additional studies are needed to determine if ANT1 directly contributes to the increased proton leak.
Previous reports have proposed that mitochondrial superoxide production may be a unifying biochemical lesion that contributes to increases in polyol synthesis and other molecular pathologies of hyperglycemia 4, 5. However, we were not able to detect a significant increase in superoxide production in SC following after up to 6 days of hyperglycemia and this correlated with an increase in mitochondrial Mn-SOD expression and activity. Vincent and colleagues recently reported a similar resistance of SCs to glucose-dependent oxidative stress that correlated with a rapid increase in nuclear levels of Nrf2, a critical transcription factor which regulates the expression of antioxidant genes such as superoxide dismutase, catalase, and heme oxygenase 1 47. Indeed, the basal activity of catalase in SCs was about 4-fold greater than the corresponding activity in sensory neurons 47. It is also interesting to note that increased proton leak can also protect against mitochondrial damage induced by reactive oxygen species, such as superoxide 48, 49. Together, these results suggest that in neonatal SCs, mitochondria may possess multiple pathways to help minimize short-term glucose-induced oxidative stress and that hyperglycemia can alter the SC mitochondrial proteome independent of superoxide generation. On the other hand, 24 hr of hyperglycemic stress increased superoxide levels and overall protein nitration in commercially supplied, cultured adult human SCs 6, 50. Unfortunately, the reason for the discrepant results between primary neonatal rat and the adult human SCs is unclear. One possibility may reside in the maturity or natural history of the adult human SCs. Precedence exists that developmental maturity can affect the response of cells to hyperglycemia since 24 hr of hyperglycemia induces death of rat embryonic sensory neurons after 3 days in culture24, 51. However, adult rat sensory neurons and embryonic sensory neurons that have been permitted to mature and differentiate in culture for 3 weeks are both resistant to glucose-induced apoptosis52, 53. Importantly, it is unlikely that the neonatal cells have lost the SC phenotype and/or the ability to respond to hyperglycemic stress since they are competent to myelinate53, a hallmark of SC function. Whether the adult human SCs are myelination competent is unclear. Additionally, the myelinated neonatal SCs can respond to hyperglycemic stress since the extent of neuregulin-induced demyelination was increased by high glucose concentrations 53. Thus, primary neonatal and adult SCs may serve as complementary models to examine the effect of glucose on the mitochondrial proteome and function in the absence of presence of substantial superoxide production, respectively.
It is important to note that SCs undergo degeneration in diabetic neuropathy 54 and that increased superoxide production, protein nitration and mitochondrial dysfunction contributes to DPN 55. At first blush, these results would appear contradictory with our findings. However, it is not surprising that the in vivo increase in superoxide and nitrotyrosine levels in SCs after 4 or more weeks of diabetes does not mimic what we observed in the primary SC cultures. Although there are numerous possibilities for this difference, one explanation consistent with a recent report is that protective anti-oxidant responses may be overwhelmed with increasing duration of diabetes. For example, diabetic adult sensory neurons mount a transient anti-oxidant response in response to ex vivo hyperglycemia that is characterized by a brief upregulation of Mn-SOD after one day of hyperglycemia followed by a subsequent decline 52. Additional studies are needed to determine if adult SCs mount a transient anti-oxidant response during the early onset of diabetes that may be eventually overwhelmed with disease duration.
In conclusion, we have used quantitative proteomics to assess the effect of hyperglycemia on the SC proteome. Hyperglycemia increased the expression of numerous mitochondrial proteins but whether this effect is due to an increase in overall mitochondrial mass, as previously reported in diabetic heart, remains to be determined. Glucose did not increase superoxide production in SCs and this correlated with an increase in MnSOD and the extent of proton leak, which may function in reducing oxidative stress. Consistent with a recent report 47, our data support that primary, neonatal rat SCs are rather insensitive to glucose-induced oxidative stress and that the mitochondrial proteome can undergo dynamic remodeling in response to hyperglycemia.
Supplementary Material
Acknowledgements
This work was supported by grants from the Juvenile Diabetes Research Foundation and The National Institutes of Health (NS054847, DK073594) and AG022407 to RHS.
Abbreviations
- BinGO
Biological Networks Gene Ontology
- dFCS
dialyzed fetal calf serum
- DPN
diabetic peripheral neuropathy
- GeLC-LTQ-FT MS/MS
gel electrophoresis and liquid chromatography linear quadrupole ion trap Fourier transform ion cyclotron resonance tandem mass spectrometry
- GO
Gene Ontology
- PBS
phosphate buffered saline
- SILAC
stable-isotope labeling with amino acids in cell culture
Footnotes
Supporting Information Available: Supplemental Tables 1–3 provide comprehensive information on the total peptides and proteins quantified and identified from the nuclear, cytoplasmic and mitochondrial fractions at each time point of the kinetic analysis, respectively. Supplemental Table 4 provides the gene names from the bioinformatic analysis of the nuclear fraction presented in Fig 3B. Supplemental Fig. 1 shows the distribution of mass errors and estimation of statistical mass accuracy obtained from analysis of the mitochondrial fractions at each time point. Supplemental Fig. 2 shows a representative MS1 spectrum and immunoblot demonstrating and increase in the mitochondrial protein, prohibitin 1. This information is available free of charge via the Internet at http://pubs.acs.org.
References
- 1.Said G. Diabetic neuropathy--a review. Nat. Clin. Pract. Neurol. 2007;3:331–340. doi: 10.1038/ncpneuro0504. [DOI] [PubMed] [Google Scholar]
- 2.Fernyhough P, Huang TJ, Verkhratsky A. Mechanism of mitochondrial dysfunction in diabetic sensory neuropathy. J Peripher. Nerv. Syst. 2003;8:227–235. doi: 10.1111/j.1085-9489.2003.03028.x. [DOI] [PubMed] [Google Scholar]
- 3.Huang TJ, Price SA, Chilton L, Calcutt NA, Tomlinson DR, Verkhratsky A, Fernyhough P. Insulin prevents depolarization of the mitochondrial inner membrane in sensory neurons of type 1 diabetic rats in the presence of sustained hyperglycemia. Diabetes. 2003;52:2129–2136. doi: 10.2337/diabetes.52.8.2129. [DOI] [PubMed] [Google Scholar]
- 4.Du XL, Edelstein D, Rossetti L, Fantus IG, Goldberg H, Ziyadeh F, Wu J, Brownlee M. Hyperglycemia-induced mitochondrial superoxide overproduction activates the hexosamine pathway and induces plasminogen activator inhibitor-1 expression by increasing Sp1 glycosylation. Proc. Natl. Acad.Sci. 2000;97:12222–12226. doi: 10.1073/pnas.97.22.12222. [DOI] [PMC free article] [PubMed] [Google Scholar]
- 5.Nishikawa T, Edelstein D, Du XL, Yamagishi S, Matsumura T, Kaneda Y, Yorek MA, Beebe D, Oates PJ, Hammes HP, Giardino I, Brownlee M. Normalizing mitochondrial superoxide production blocks three pathways of hyperglycaemic damage. Nature. 2000;404:787–790. doi: 10.1038/35008121. [DOI] [PubMed] [Google Scholar]
- 6.Obrosova IG, Drel VR, Pacher P, Ilnytska O, Wang ZQ, Stevens MJ, Yorek MA. Oxidative-nitrosative stress and poly(ADP-ribose) polymerase (PARP) activation in experimental diabetic neuropathy: The relation is revisited. Diabetes. 2005;54:3435–3441. doi: 10.2337/diabetes.54.12.3435. [DOI] [PMC free article] [PubMed] [Google Scholar]
- 7.Drel VR, Pacher P, Stevens MJ, Obrosova IG. Aldose reductase inhibition counteracts nitrosative stress and poly(ADP-ribose) polymerase activation in diabetic rat kidney and high-glucose-exposed human mesangial cells. Free Radic. Biol. Med. 2006;40:1454–1465. doi: 10.1016/j.freeradbiomed.2005.12.034. [DOI] [PMC free article] [PubMed] [Google Scholar]
- 8.Obrosova IG, Drel VR, Oltman CL, Mashtalir N, Tibrewala J, Groves JT, Yorek MA. Role of nitrosative stress in early neuropathy and vascular dysfunction in streptozotocin-diabetic rats. Am. J. Physiol. Endocrinol. Metab. 2007;293:E1645–E1655. doi: 10.1152/ajpendo.00479.2007. [DOI] [PubMed] [Google Scholar]
- 9.Pop-Busui R, Sima A, Stevens M. Diabetic neuropathy and oxidative stress. Diabetes Metab. Res. Rev. 2006;22:257–273. doi: 10.1002/dmrr.625. [DOI] [PubMed] [Google Scholar]
- 10.Vincent AM, Russell JW, Low P, Feldman EL. Oxidative stress in the pathogenesis of diabetic neuropathy. Endocr. Rev. 2004;25:612–628. doi: 10.1210/er.2003-0019. [DOI] [PubMed] [Google Scholar]
- 11.Andersen JS, Mann M. Organellar proteomics: turning inventories into insights. EMBO Rep. 2006;7:874–879. doi: 10.1038/sj.embor.7400780. [DOI] [PMC free article] [PubMed] [Google Scholar]
- 12.Yu C, Alterman M, Dobrowsky RT. Ceramide displaces cholesterol from lipid rafts and decreases the association of the cholesterol binding protein caveolin-1. J Lipid Res. 2005;46:1678–1691. doi: 10.1194/jlr.M500060-JLR200. [DOI] [PubMed] [Google Scholar]
- 13.Zhang G, Spellman DS, Skolnik EY, Neubert TA. Quantitative phosphotyrosine proteomics of EphB2 signaling by stable isotope labeling with amino acids in cell culture (SILAC) J. Proteome Res. 2006;5:581–588. doi: 10.1021/pr050362b. [DOI] [PMC free article] [PubMed] [Google Scholar]
- 14.Okado-Matsumoto A, Fridovich I. Subcellular distribution of superoxide dismutases (SOD) in rat liver. Cu,Zn-SOD in mitochondria. J. Biol. Chem. 2001;276:38388–38393. doi: 10.1074/jbc.M105395200. [DOI] [PubMed] [Google Scholar]
- 15.Hwang SI, Lundgren DH, Mayya V, Rezaul K, Cowan AE, Eng JK, Han DK. Systematic characterization of nuclear proteome during apoptosis: a quantitative proteomic study by differential extraction and stable isotope labeling. Mol. Cell. Proteomics. 2006;5:1131–1145. doi: 10.1074/mcp.M500162-MCP200. [DOI] [PubMed] [Google Scholar]
- 16.Steen H, Mann M. The ABC's (and XYZ's) of peptide sequencing. Nat. Rev. Mol. Cell Biol. 2004;5:699–711. doi: 10.1038/nrm1468. [DOI] [PubMed] [Google Scholar]
- 17.Shevchenko A, Tomas H, Havlis J, Olsen JV, Mann M. In-gel digestion for mass spectrometric characterization of proteins and proteomes. Nat. Protoc. 2006;1:2856–2860. doi: 10.1038/nprot.2006.468. [DOI] [PubMed] [Google Scholar]
- 18.Peng J, Elias JE, Thoreen CC, Licklider LJ, Gygi SP. Evaluation of multidimensional chromatography coupled with tandem mass spectrometry (LC/LCMS/ MS) for large-scale protein analysis: the yeast proteome. J. Proteome Res. 2003;2:43–50. doi: 10.1021/pr025556v. [DOI] [PubMed] [Google Scholar]
- 19.Zubarev R, Mann M. On the proper use of mass accuracy in proteomics. Mol. Cell. Proteomics. 2007;6:377–381. doi: 10.1074/mcp.M600380-MCP200. [DOI] [PubMed] [Google Scholar]
- 20.Schulze WX, Mann M. A novel proteomic screen for peptide-protein interactions. J Biol Chem. 2004;279:10756–10764. doi: 10.1074/jbc.M309909200. [DOI] [PubMed] [Google Scholar]
- 21.Foster LJ, Rudich A, Talior I, Patel N, Huang X, Furtado LM, Bilan PJ, Mann M, Klip A. Insulin-dependent interactions of proteins with GLUT4 revealed through stable isotope labeling by amino acids in cell culture (SILAC) J. Proteome Res. 2006;5:64–75. doi: 10.1021/pr0502626. [DOI] [PubMed] [Google Scholar]
- 22.Maere S, Heymans K, Kuiper M. BiNGO: a Cytoscape plugin to assess overrepresentation of gene ontology categories in biological networks. Bioinformatics. 2005;21:3448–3449. doi: 10.1093/bioinformatics/bti551. [DOI] [PubMed] [Google Scholar]
- 23.Wu M, Neilson A, Swift AL, Moran R, Tamagnine J, Parslow D, Armistead S, Lemire K, Orrell J, Teich J, Chomicz S, Ferrick DA. Multiparameter metabolic analysis reveals a close link between attenuated mitochondrial bioenergetic function and enhanced glycolysis dependency in human tumor cells. Am. J. Physiol. Cell. Physiol. 2007;292:C125–C136. doi: 10.1152/ajpcell.00247.2006. [DOI] [PubMed] [Google Scholar]
- 24.Vincent AM, McLean LL, Backus C, Feldman EL. Short-term hyperglycemia produces oxidative damage and apoptosis in neurons. FASEB J. 2005;19:638–640. doi: 10.1096/fj.04-2513fje. [DOI] [PubMed] [Google Scholar]
- 25.Robinson KM, Janes MS, Beckman JS. The selective detection of mitochondrial superoxide by live cell imaging. Nat. Protoc. 2008;3:941–947. doi: 10.1038/nprot.2008.56. [DOI] [PubMed] [Google Scholar]
- 26.Blagoev B, Ong SE, Kratchmarova I, Mann M. Temporal analysis of phosphotyrosine-dependent signaling networks by quantitative proteomics. Nat. Biotechnol. 2004;22:1139–1145. doi: 10.1038/nbt1005. [DOI] [PubMed] [Google Scholar]
- 27.Johnson DT, Harris RA, French S, Blair PV, You J, Bemis KG, Wang M, Balaban RS. Tissue heterogeneity of the mammalian mitochondrial proteome. Am. J. Physiol. Cell. Physiol. 2007;292:C689–C697. doi: 10.1152/ajpcell.00108.2006. [DOI] [PubMed] [Google Scholar]
- 28.Price SA, Zeef LA, Wardleworth L, Hayes A, Tomlinson DR. Identification of changes in gene expression in dorsal root ganglia in diabetic neuropathy: correlation with functional deficits. J. Neuropathol. Exp. Neurol. 2006;65:722–732. doi: 10.1097/01.jnen.0000228199.89420.90. [DOI] [PubMed] [Google Scholar]
- 29.Choi SW, Gerencser AA, Nicholls DG. Bioenergetic analysis of isolated cerebrocortical nerve terminals on a microgram scale: spare respiratory capacity and stochastic mitochondrial failure. J. Neurochem. 2009;109:1179–1191. doi: 10.1111/j.1471-4159.2009.06055.x. [DOI] [PMC free article] [PubMed] [Google Scholar]
- 30.Tomlinson DR, Gardiner NJ. Glucose neurotoxicity. Nat. Rev. Neurosci. 2008;9:36–45. doi: 10.1038/nrn2294. [DOI] [PubMed] [Google Scholar]
- 31.Hittel DS, Berggren JR, Shearer J, Boyle K, Houmard JA. Increased secretion and expression of myostatin in skeletal muscle from extremely obese women. Diabetes. 2009;58:30–38. doi: 10.2337/db08-0943. [DOI] [PMC free article] [PubMed] [Google Scholar]
- 32.Kruger M, Kratchmarova I, Blagoev B, Tseng YH, Kahn CR, Mann M. Dissection of the insulin signaling pathway via quantitative phosphoproteomics. Proc. Natl. Acad. Sci. 2008;105:2451–2456. doi: 10.1073/pnas.0711713105. [DOI] [PMC free article] [PubMed] [Google Scholar]
- 33.Hanke S, Mann M. The phosphotyrosine interactome of the insulin receptor family and its substrates IRS-1 and IRS-2. Mol. Cell. Proteomics. 2009;8:519–534. doi: 10.1074/mcp.M800407-MCP200. [DOI] [PMC free article] [PubMed] [Google Scholar]
- 34.Obrosova IG, Pacher P, Szabo C, Zsengeller Z, Hirooka H, Stevens MJ, Yorek MA. Aldose reductase inhibition counteracts oxidative-nitrosative stress and poly(ADP-ribose) polymerase activation in tissue sites for diabetes complications. Diabetes. 2005;54:234–242. doi: 10.2337/diabetes.54.1.234. [DOI] [PMC free article] [PubMed] [Google Scholar]
- 35.Ho EC, Lam KS, Chen YS, Yip JC, Arvindakshan M, Yamagishi S, Yagihashi S, Oates PJ, Ellery CA, Chung SS, Chung SK. Aldose reductase-deficient mice are protected from delayed motor nerve conduction velocity, increased c-Jun NH2-terminal kinase activation, depletion of reduced glutathione, increased superoxide accumulation, and DNA damage. Diabetes. 2006;55:1946–1953. doi: 10.2337/db05-1497. [DOI] [PubMed] [Google Scholar]
- 36.Maekawa K, Tanimoto T, Okada S, Suzuki T, Yabe-Nishimura C. Expression of aldose reductase and sorbitol dehydrogenase genes in Schwann cells isolated from rat: effects of high glucose and osmotic stress. Brain Res. Mol. Brain Re.s. 2001;87:251–256. doi: 10.1016/s0169-328x(01)00009-2. [DOI] [PubMed] [Google Scholar]
- 37.Jiang Y, Calcutt NA, Ramos KM, Mizisin AP. Novel sites of aldose reductase immunolocalization in normal and streptozotocin-diabetic rats. J. Peripher. Nerv. Syst. 2006;11:274–285. doi: 10.1111/j.1529-8027.2006.00099.x. [DOI] [PubMed] [Google Scholar]
- 38.Shen X, Zheng S, Thongboonkerd V, Xu M, Pierce WM, Jr, Klein JB, Epstein PN. Cardiac mitochondrial damage and biogenesis in a chronic model of type 1 diabetes. Am. J. Physiol. Endocrinol..Metab. 2004;287:E896–E905. doi: 10.1152/ajpendo.00047.2004. [DOI] [PubMed] [Google Scholar]
- 39.Warda M, Kim HK, Kim N, Youm JB, Kang SH, Park WS, Khoa TM, Kim YH, Han J. Simulated hyperglycemia in rat cardiomyocytes: a proteomics approach for improved analysis of cellular alterations. Proteomics. 2007;7:2570–2590. doi: 10.1002/pmic.200700168. [DOI] [PubMed] [Google Scholar]
- 40.Meyer B, Wittig I, Trifilieff E, Karas M, Schagger H. Identification of two proteins associated with mammalian ATP synthase. Mol. Cell. Proteomics. 2007;6:1690–1699. doi: 10.1074/mcp.M700097-MCP200. [DOI] [PubMed] [Google Scholar]
- 41.Paivarinne H, Kainulainen H. DAPIT, a novel protein down-regulated in insulin-sensitive tissues in streptozotocin-induced diabetes. Acta Diabetol. 2001;38:83–86. doi: 10.1007/s005920170018. [DOI] [PubMed] [Google Scholar]
- 42.Tsutsui H, Kinugawa S, Matsushima S. Mitochondrial oxidative stress and dysfunction in myocardial remodelling. Cardiovasc. Res. 2009;81:449–456. doi: 10.1093/cvr/cvn280. [DOI] [PubMed] [Google Scholar]
- 43.Bugger H, Chen D, Riehle C, Soto J, Theobald HA, Hu XX, Ganesan B, Weimer BC, Abel ED. Tissue-specific remodeling of the mitochondrial proteome in type 1 diabetic Akita mice. Diabetes. 2009;58:1986–1997. doi: 10.2337/db09-0259. [DOI] [PMC free article] [PubMed] [Google Scholar]
- 44.Brand MD. The efficiency and plasticity of mitochondrial energy transduction. Biochem. Soc. Trans. 2005;33:897–904. doi: 10.1042/BST0330897. [DOI] [PubMed] [Google Scholar]
- 45.Brand MD, Pakay JL, Ocloo A, Kokoszka J, Wallace DC, Brookes PS, Cornwall EJ. The basal proton conductance of mitochondria depends on adenine nucleotide translocase content. Biochem. J. 2005;392:353–362. doi: 10.1042/BJ20050890. [DOI] [PMC free article] [PubMed] [Google Scholar]
- 46.Verheijen MH, Chrast R, Burrola P, Lemke G. Local regulation of fat metabolism in peripheral nerves. Genes Dev. 2003;17:2450–2464. doi: 10.1101/gad.1116203. [DOI] [PMC free article] [PubMed] [Google Scholar]
- 47.Vincent AM, Kato K, McLean LL, Soules ME, Feldman EL. Sensory neurons and Schwann cells respond to oxidative stress by increasing antioxidant defense mechanisms. Antioxid. Redox. Signal. 2009;11:425–438. doi: 10.1089/ars.2008.2235. [DOI] [PMC free article] [PubMed] [Google Scholar]
- 48.Brand MD, Affourtit C, Esteves TC, Green K, Lambert AJ, Miwa S, Pakay JL, Parker N. Mitochondrial superoxide: production, biological effects, and activation of uncoupling proteins. Free Radic. Biol. Med. 2004;37:755–767. doi: 10.1016/j.freeradbiomed.2004.05.034. [DOI] [PubMed] [Google Scholar]
- 49.Echtay KS, Pakay JL, Esteves TC, Brand MD. Hydroxynonenal and uncoupling proteins: a model for protection against oxidative damage. Biofactors. 2005;24:119–130. doi: 10.1002/biof.5520240114. [DOI] [PubMed] [Google Scholar]
- 50.Askwith T, Zeng W, Eggo MC, Stevens MJ. Oxidative stress and dysregulation of the taurine transporter in high-glucose-exposed human Schwann cells: implications for pathogenesis of diabetic neuropathy. Am. J. Physiol. Endocrinol. Metab. 2009;297:E620–E628. doi: 10.1152/ajpendo.00287.2009. [DOI] [PMC free article] [PubMed] [Google Scholar]
- 51.Russell JW, Sullivan KA, Windebank AJ, Herrmann DN, Feldman EL. Neurons undergo apoptosis in animal and cell culture models of diabetes. Neurobiol. Dis. 1999;6:347–363. doi: 10.1006/nbdi.1999.0254. [DOI] [PubMed] [Google Scholar]
- 52.Zherebitskaya E, Akude E, Smith DR, Fernyhough P. Development of selective axonopathy in adult sensory neurons isolated from diabetic rats: role of glucose-induced oxidative stress. Diabetes. 2009;58:1356–1364. doi: 10.2337/db09-0034. [DOI] [PMC free article] [PubMed] [Google Scholar]
- 53.Yu C, Rouen S, Dobrowsky RT. Hyperglycemia and downregulation of caveolin-1 enhance neuregulin-induced demyelination. Glia. 2008;56:877–887. doi: 10.1002/glia.20662. [DOI] [PMC free article] [PubMed] [Google Scholar]
- 54.Eckersley L. Role of the Schwann cell in diabetic neuropathy. Int. Rev. Neurobiol. 2002;50:293–321. doi: 10.1016/s0074-7742(02)50081-7. [DOI] [PubMed] [Google Scholar]
- 55.Vareniuk I, Pavlov IA, Obrosova IG. Inducible nitric oxide synthase gene deficiency counteracts multiple manifestations of peripheral neuropathy in a streptozotocin-induced mouse model of diabetes. Diabetologia. 2008;51:2126–2133. doi: 10.1007/s00125-008-1136-3. [DOI] [PMC free article] [PubMed] [Google Scholar]
Associated Data
This section collects any data citations, data availability statements, or supplementary materials included in this article.


