Abstract
Metabolomics is a powerful multi-parameter tool for evaluating phenotypic traits associated with disease processes. We have used 1H NMR metabolome profiling to characterize metabolic aberrations in a yeast model of Huntington's disease that are attributable to the mutant huntingtin protein's gain-of-toxic-function effects. A group of 11 metabolites (alanine, acetate, galactose, glutamine, glycerol, histidine, proline, succinate, threonine, trehalose, and valine) exhibited significant concentration changes in yeast expressing the N-terminal fragment of a mutant human huntingtin gene. Correspondence analysis was used to compare results from our yeast model to data reported from transgenic mice expressing a mutant huntingtin gene fragment and Huntington's disease patients. This technique enabled us to identify a variety of both model specific (pertaining to a single species) and conserved (observed in multiple species) biomarkers related to mutant huntingtin's toxicity. Among the 59 metabolites identified, four compounds (alanine, glutamine, glycerol, and valine) changed significantly in concentration in all three Huntington's disease systems. We propose that alanine, glutamine, glycerol, and valine should be considered as promising biomarkers for evaluating new Huntington's disease therapies, as well as providing unique insight into the mechanisms associated with mutant huntingtin toxicity.
Keywords: Huntington's disease, yeast, metabolomics, phenotypic profiling, disease models, neurodegenerative disease, metabolism
Introduction
Huntington's disease (HD) is a progressive neurodegenerative disorder arising from a CAG trinucleotide repeat expansion mutation in the huntingtin (Htt) gene.1, 2 Individuals carrying mutant forms of huntingtin (mHtt) encoding for ≥35 glutamine repeats are at risk of developing HD. The number of polyglutamine-encoding CAG repeats in mHtt strongly influences the age of disease onset, symptom severity, and rate of HD progression.3 Unfortunately, the mechanisms by which mHtt and its aggregation-prone protein product causes HD have not yet been determined.4 This lack of information has hampered the establishment of disease-specific biochemical markers for gauging the toxic effects of mutant huntingtin, which has impeded efforts to develop chemical methods for monitoring HD progression.
Several cellular and animal HD models have been constructed to help elucidate the mechanisms responsible for the toxicity of the mutant huntingtin protein including monkeys,5 mice,6-8 zebrafish,9-11 fruit flies,12-15 nematodes,16-19 mammalian cells,20-22 and yeast.23-25 Each of these systems has provided important new insights regarding the cellular dysfunctions arising from mHtt expression and several of these models have served as screening platforms for HD drug discovery.20, 26-30 Among these models, the yeast Saccharomyces cerevisiae has proven to be exceptionally informative with respect to HD processes due to its ability to recapitulate many of the cellular and molecular features of the disease.24 Expression of the N-terminal portion of mHtt in yeast is sufficient to cause the rapid onset of characteristic huntingtin aggregation25 and cell death.23 The ability of this organism to recapitulate many of the defining phenotypic features of mutant huntingtin is quite remarkable given the fact that yeast lack Htt orthologs.31 Consequently, the yeast model is a valuable tool for understanding the unique gain-of-toxic function properties attributable to mHtt and for probing the cellular mechanisms of HD.
We used S. cerevisiae expressing mHtt for the purpose of characterizing metabolic biomarkers associated with mutant huntingtin's toxicity. This is the first report in which a non-mammalian transgenic model has been used to critically evaluate perturbations in primary metabolites that stem from mutant huntingtin's toxicity. In addition, we have conducted a systematic review of published metabolomics studies performed on transgenic mice expressing mHtt and humans with HD in order to identify conserved metabolic features that are disrupted by mutant huntingtin. The data obtained from human and mouse studies were qualitatively compared to results generated from our yeast model, and this has provided new insight regarding the metabolic disturbances that are attributable to mutant huntingtin's gain-of-toxic-function effects. This information is anticipated to enhance our understanding of mutant huntingtin's impact on biochemical processes in cells and improve strategies for selecting HD biomarkers.
Experimental Procedures
Yeast strains and media
Construction and maintenance of the HD yeast model has been previously described by our group.32 Briefly, S. cerevisiae strains designated “103Q” and “25Q” were prepared that expressed the N-terminal fragment of human Htt followed by CAG codon repeats encoding for 103 and 25 glutamine (Q) repeats, respectively. The Htt fragments were fused to enhanced green fluorescent protein (EGFP) reporters (C-terminus) and the constructs were placed under the control of GAL1 promoters. The 103Q and 25Q strains were maintained on uracil-free (plasmid selective marker) synthetic complex media (SC) supplemented with yeast nitrogen base (without amino acids, Sigma-Aldrich), yeast drop-out supplement (with histidine and methionine, Sigma-Aldrich), 0.5% (w/v) ammonium sulfate, and 2% (w/v) glucose. Compared to the 25Q yeast, the 103Q yeast exhibited distinctive phenotypic traits attributable to expression of the human mHtt fragment. These features included the characteristic aggregation of the EGFP-labeled mutant huntingtin in 103Q yeast, as well as their significantly reduced viability when cultured under conditions that were permissive for mHtt-expression (Supporting Information, Figure 1).
Metabolomic analysis of 103Q and 25Q yeast
Yeast were grown using a two-stage (I and II) culture process. Stage I cultures were grown in 250 mL wide-mouth Erlenmeyer flasks containing 50 mL SC media supplemented with 2% glucose and placed on a rotary shaker/incubator (140 rpm, 30 °C) for 24 h. Stage II cultures were prepared by centrifuging stage I cultures (3,000×g, 5 min), decanting the supernatant, and suspending the cell pellet in 50 mL SC media supplemented with 2% galactose to induce Htt gene fragment expression. Stage II cultures were then incubated with shaking for 16.5 h (140 rpm, 30 °C). Next, stage II cultures were centrifuged (3,000×g, 5 min), the supernatant decanted, and the cell pellet immediately suspended in 50 mL methanol (25 °C) and vortexed vigorously. This entire process was carefully monitored to ensure that precisely 20 ± 5 min reproducibly elapsed from the time cultures were removed from the incubator to the moment cells were placed in methanol.
Following 3 h of extraction at 25 °C, cell suspensions were centrifuged (3,000×g, 5 min) and the methanol was immediately decanted. The resulting extracts were evaporated in vacuo and the remaining organic residues were weighed and stored in 5 dram vials at -20 °C until NMR analysis. Samples were prepared for NMR by adding to each vial a 666 μL aliquot of a solution containing deuterium oxide (D2O, 99.9% D) with 0.2% w/v sodium azide (bacterial growth inhibitor), 10 mM imidazole (pH indicator), and 0.5 mM 2,2-dimethyl-2-silapentane-5-sulfonate (DSS). The DSS standard is used by our data analysis software (Chenomx NMR Suite v 5.0, described below) as a chemical shift reference, an internal standard for quantification, and chemical shape indicator to assess the shim quality and predict line widths for each analyte. No additional sample clean-up was performed prior to NMR analysis. 1H NMR spectra were collected on a 500 MHz Varian VNMRS-500 spectrometer with a triple resonance probe at 20 °C. Data collection parameters were as follows: number of scans = 64, relaxation delay = 1 s, pulse width = 2.9 μs, acquisition time = 4 s, spectral width = 6200 Hz, temperature = 20.0 °C, spinning = 20 Hz, data points = 24,876; no steady-state scans were collected and no solvent suppression was used.
Metabolomics data analysis
All 1H NMR FIDs were imported into Chenomx NMR Suite v 5.0 (Chenomx, Inc.) for processing and binning. Each spectrum (0–6 ppm region) was divided into 0.005 ppm bins and the regions containing the residual water (4.750–4.900 ppm) and methanol (3.335–3.350 ppm) signals were removed from further analysis. For the purpose of this investigation, we have focused our attention on the 0–6 ppm portions of the 1H NMR spectra because our preliminary analyses showed that no significant changes occurred in the downfield portions of the full spectra (up to 12 ppm).
Prior to statistical analyses, all Fourier-transformed 1H NMR data sets were normalized by expressing the peak intensities in each bin as a percentage of the total area under the curve for the 0–6 ppm region of the spectrum. Data sets were analyzed by principal components analysis (PCA) with XLSTAT (Addinsoft, Inc.). PCA is a data reduction technique that transforms data via a linear combination to uncorrelated orthogonal variables (principal components), allowing sources of variation in the data to be categorized.33 Individual metabolites were manually identified using the Chenomx NMR Suite (Supporting Information, Table 1) and then quantified by comparison to the internal DSS standard. Additional experiments using 2D NMR techniques (1H-1H TOCSY, 1H-13C HSQC, and 1H-13C HMBC) and spiking of samples with authentic standards were used to verify each metabolite identified in this study (data not shown). Spectral regions representing galactitol (3.660–3.695, and 3.945–3.985 ppm) and acetate (1.900-1.960 ppm) were removed from the principal components analysis because these compounds were present in large and highly variable quantities that were unduly influential in terms of their effects on each sample's profile. Instead, these metabolites were manually annotated and quantified for statistical evaluation. Two-tailed, parametric z-tests were performed using XLSTAT.
Systematic review and comparison of published HD metabolic profiles
A systematic review of the literature was conducted to identify published data from model systems and humans that described metabolic changes associated with mutant huntingtin toxicity. We utilized the PubMed database (United States National Library of Medicine, National Institutes of Health) to perform a comprehensive search for articles published prior to August of 2009. A broad set of search criteria were utilized, which included pairing the search terms “Huntington's disease,” “Huntington's chorea,” “Huntington disease,” “Huntingtons,” and “Huntington” in combination with “biomarker,” “metabolite,” “metabolic,” “metabolomics,” “metabonomics,” “metabolism,” “MRI,” “magenetic resonance imaging,” “mass spectrometry,” “neurochemical,” “NMR,” “nuclear magnetic resonance,” and “spectroscopy.”
Only studies in which mHtt expression was determined to be responsible for inducing HD in humans or an HD-like condition in model organisms were retained for analysis. We excluded work employing non-mHtt-based systems (e.g., 3-nitropropionic acid induced neuronal toxicity) since it is uncertain the degree to which these approaches mimic HD pathogenesis.34 The resulting reference set was independently reviewed by two individuals (PMJ and RHC) and studies were retained for analysis if 1) one or more primary metabolites were identified and 2) methods for assessing changes in the concentrations of the metabolites were described. The complete list of metabolic changes observed in these studies is provided in Supporting Information Table 2.
The amassed data were quantitatively assessed using correspondence analysis (CA).35-37 This method provides a means for analyzing qualitative data in a graphical format. Weighted profile values are calculated for tabular (row-column) data and the relative similarities between weighted profile points are described in terms of their χ2 distances. Prior to performing CA, the data (Supporting Information Table 2) were reformatted into a contingency table that was suitable for testing (Supporting Information, Table 3). For the purpose of this investigation, we structured our data set to reflect the number of times each metabolite's concentration was reported to have changed significantly in yeast, mice, and humans in response to mutant huntingtin toxicity. CA was performed and visualized using XLSTAT.
Results
1H NMR determination of 103Q and 25Q yeast intracellular metabolites
Analysis of the 1H NMR spectra generated from 103Q and 25Q yeast strains was undertaken using the Chenomx NMR Suite v 5.0 library of primary metabolites. This facilitated the detection of 29 compounds whose identities were confirmed by comparisons with 1D (Supporting Information, Table 1) and 2D NMR data generated from authentic standards. Even with no sample cleanup prior to 1H NMR analysis, we observed excellent signal detection, which enabled us to confidently assign proton resonances that were subject to considerable signal overlap (Figure 1). We identified biomolecules representing a wide range of metabolically and chemically distinct classes including amino acids (4-aminobutyrate, alanine, arginine, asparagine, aspartate, glutamate, glutamine, histidine, isoleucine, leucine, methionine, phenylalanine, proline, threonine, tryptophan, tyrosine, and valine), a nucleoside (adenosine), a cofactor (NAD+), and osmolytes (glycerol, trehalose), as well as metabolites associated with energy metabolism (ATP, acetate, formate, galactose, propylene glycol, succinate) and stress response (glutathione). Galactitol was also identified, but its definitive biochemical role(s) in yeast is not well defined.
Figure 1.
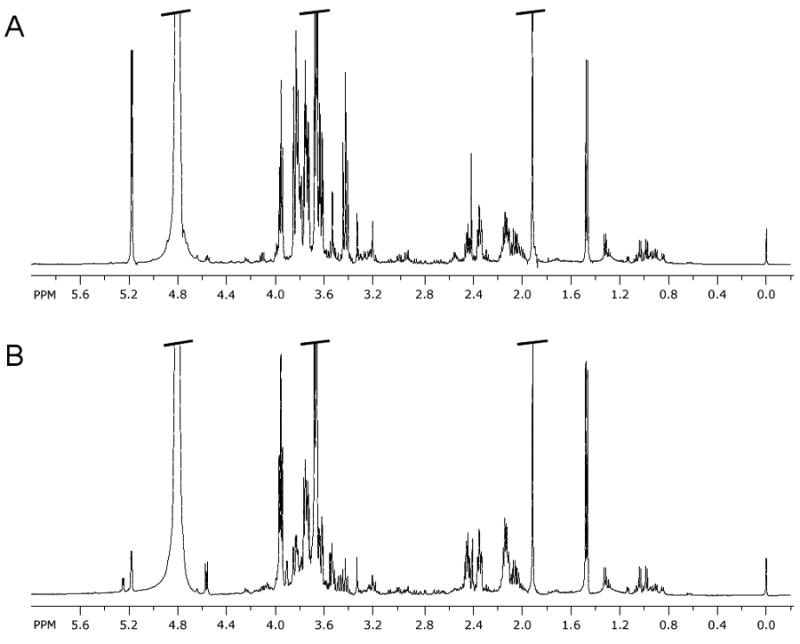
Representative 1H NMR spectra (δH 0–6 ppm) of A) 25Q and B) 103Q HD yeast extracts acquired at 500 MHz in D2O with 0.2% w/v sodium azide, 10 mM imidazole, and 0.5 mM DSS.
Expression of mHtt alters the metabolome of 103Q yeast
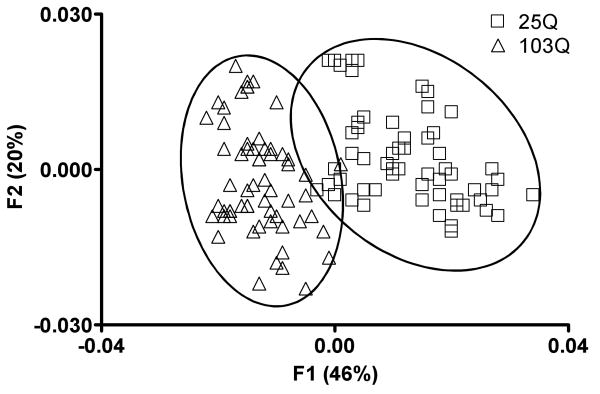
We tested the application of principal components analysis (PCA) as a multivariate statistical method for reducing the dimensionality of the metabolomics data. It was anticipated that this would enable us to identify changes in the metabolic profiles of HD yeast attributable to mutant huntingtin's toxicity. Examination of the 1H NMR data by PCA revealed well-defined clusters for the metabolite profiles of 103Q and 25Q yeast (Figure 2). Remarkably, these data represent an accumulation of 61 replicates per strain, which were collected by three individuals (performed by PJM, RMM, LMS using the protocol described in the experimental procedures section) from 17 independent experiments carried out over a non-consecutive 17 week period. The notable clustering of these data, despite the relatively challenging conditions used for this experiment, demonstrates the robustness and reproducibility of our metabolomics approach.
Figure 2.
PCA scores plot of 1H NMR data for 25Q (□) and 103Q (Δ) yeast. Data points represents single experimental replicates (n = 61 for each strain). The data were obtained from 17 different experiments performed on different days and show notable consistency. Substantial differentiation between the 25Q and 103Q yeast metabolomes is reflected in the distinct clustering among replicates of the two HD yeast strains.
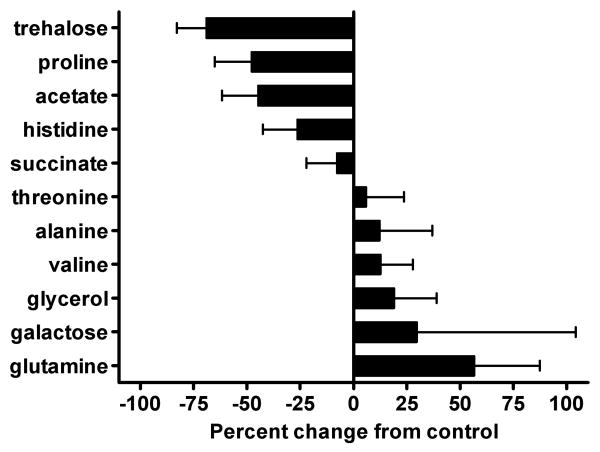
Inspection of the loadings plot from the F1 axis (Figure 3) revealed several regions in the 1H NMR spectra that substantially contributed to the metabolic differences between yeast expressing normal versus mutant Htt fragments. In view of the fact that the sole difference between 25Q and 103Q yeast was the number of CAG repeats present in their respective Htt gene fragments, this enabled us to use the loadings plot data to search for metabolic changes that were attributable to mutant huntingtin's toxicity. These data assisted us in identifying 11 metabolites that exhibited substantial variations in their respective concentrations between the two yeast strains (Figure 3). The significantly altered metabolites included alanine, galactose, glutamine, glycerol, threonine, and valine, which were more abundant in 103Q yeast, while acetate, histidine, proline, succinate, and trehalose were markedly decreased (note: although acetate levels significantly decreased in 103Q yeast (Figure 4), they were removed from PCA analysis (Figure 3) due to their disproportionate and overwhelming influence during our initial statistical analysis). Using a quantitative method based on an internal DSS standard,38 we proceeded to determine the concentrations for each of the 11 metabolites in the 25Q and 103Q samples (Figure 4). No attempt was made to ascertain the recoveries for the 11 substances; therefore, our data do not represent their absolute cellular concentrations in yeast. However, our recovery efficiencies can be assumed to be equivalent because all of the sample extractions were carried out under identical conditions. Therefore, we were able to determine the relative percent change in the quantity of each primary metabolite. Using this approach, we showed that the relative concentrations of the 11 metabolites identified from the F1 loadings plot were significantly (two-tailed parametric z-test, α = 0.05) altered in yeast expressing a human mHtt fragment (Figure 4).
Figure 3.
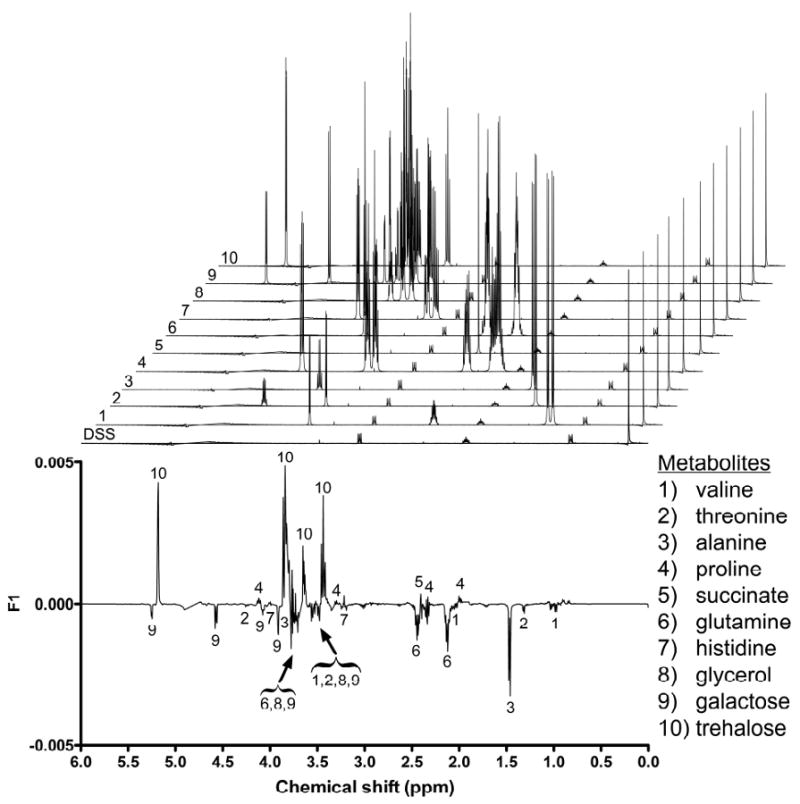
Loadings plot of the F1 axis from the PCA of 25Q and 103Q yeast metabolomes. The loadings plot was used to identify sources of variability that contributed to the differentiation between 25Q and 103Q yeast. Regions of high variability that corresponded to decreased (phased upward) or increased (phased downward) concentrations of primary metabolites in 103Q yeast are labeled. Modeled spectral data for each metabolite (and DSS standard) are stacked above the loadings plot for reference.
Figure 4.
Changes in the relative concentrations of metabolites identified by PCA of 25Q and 103Q yeast. The sample concentrations of the metabolites were determined by quantifying the intregrals attributed to each of the non-exchangable proton resonances in all 25Q and 103Q samples and expressing them relative to an internal DSS standard. Data are expressed as the percent change in metabolite concentration in 103Q yeast relative to control 25Q yeast. A two-tailed, parametric z-test (α = 0.05) was used to determine the significance of the change in relative concentrations for each metabolite (n = 61). Bars represent the mean relative metabolite concentration and standard deviations. All values were significantly different from zero with P ≤ 0.0001 except for galactose (P = 0.0018) and threonine (P = 0.0096).
Although we had ascribed the changes in the relative concentrations of primary metabolites to the toxic effect of mutant huntingtin, we could not rule out the possibility that some or all of the variation we observed might be reflective of a generalized ‘toxic’ response in yeast. Therefore, we explored the impact of several small molecule toxins on the yeast metabolome. The compounds potassium cyanide (inhibits complex IV of the mitochondrial electron transport chain), amphotericin B (forms pores in cellular membranes leading to the release of electrolytes), and cycloheximide (inhibits ribosomal protein biosynthesis) were screened against 25Q yeast at concentrations that caused decreases in cell proliferation equivalent to the ∼30% reduction in 103Q versus 25Q cell growth following galactose-induced expression of the mHtt fragment (Supporting Information, Figure 2). Examination of the 1H NMR data by PCA revealed that each of the toxins caused restructuring of the yeast metabolome in a manner that was distinct from the 103Q yeast profile (Supporting Information, Figure 2). Moreover, the individual metabolites (along with their respective changes in concentrations) that contributed to the toxin-induced metabolic profiles were different from those distinguishing 103Q versus 25Q yeast (data not shown). This supported the conclusion that changes in the yeast metabolome induced by mHtt fragment expression are reflective of a specific gain-of-toxic function response stemming from mutant huntingtin's toxicity.
Comparison of conserved HD metabolic features in humans, mice, and yeast
We rationalized that a multispecies comparison of metabolomics datasets would facilitate the identification of primary metabolites that are candidate conserved biomarkers for mutant huntingtin's gain-of-toxic function properties. Identifying these biomarkers is important since huntingtin's effects in humans are speculated to result from a combination of both loss-of-function and gain-of-toxic-function properties.1, 39 We conducted a systematic review of published studies documenting the metabolic changes exhibited in HD patients40-43 and transgenic mice expressing mHtt43-47 in order to 1) identify which cellular metabolites were present in the mouse model and humans with HD and 2) determine which of these metabolites changed in response to disease. We selected correspondence analysis (CA), a descriptive multivariate statistical technique that is used for creating maps depicting the underlying relationships among categories of tabularized data, as a statistical tool for this study. This technique enabled us to directly compare results from our HD yeast model with data obtained from metabolomics experiments performed in mice and humans. In this case, CA was used to probe for primary metabolites whose concentration changes in yeast, mice, and humans were indicative of a generalized metabolic response to mHtt toxicity.
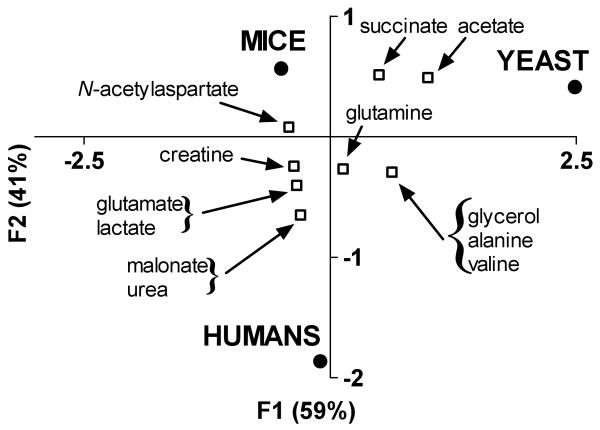
The metabolic changes reported in mice and humans were combined with results derived from HD yeast and the data were arranged in a contingency table identifying 1) the frequency with which each metabolite's concentration was reported to have changed significantly and 2) the specific biological system in which metabolic changes occurred (Supporting Information, Table 3). Examination of the multispecies dataset by CA resulted in the separation of the variables into two categories (organism and metabolite) along the principal axes, which accounted for all of the variation (inertia) in the data set (Figure 5). The CA plot revealed that the overall metabolic patterns of yeast, mice, and humans were distinguishable from one another. Interestingly, the metabolomes of mice and humans were clearly separated from yeast along the first principal (F1) axis; however, the profiles of yeast and mice were distinct from humans in the second principal (F2) dimension. Further inspection of the CA plot revealed that several metabolites responded similarly in two or more HD systems, which suggested that these metabolites could be potential biomarkers for toxicity associated with mHtt expression. Therefore, we focused our attention on examining the relationships among these metabolites in reference to their source organisms.
Figure 5.
Asymmetric plot from CA of metabolic changes reported for cells in which mHtt expression occurs. For CA, column profiles represent the different biological systems (humans, mice, yeast), while row profiles represent the metabolites identified as having undergone significant changes. Metabolites that were reported from a single HD model occupy coordinates that superimpose upon the source organism. For clarity, these metabolites have been removed from this diagram, but they can be found in Supporting Information, Table 3.
Examination of the CA plot revealed that the four metabolites, alanine, glutamine, glycerol and valine exhibited similar changes in model organisms and humans expressing mHtt (Figure 5). The occurrence of these four metabolites in the CA plot in a region that was central to both the F1 (separating mice and humans) and F2 (separating mice and yeast) dimensions indicates that alanine, glutamine, glycerol and valine might be important multispecies biomarkers for gauging mutant huntingtin's gain-of-toxic effects. Other notable trends that were observed in the CA plot included the co-localization of creatine, glutamate, lactate, malonate, N-acetylaspartate, and urea with mice and humans in the F1 dimension. This indicates that these six metabolites behaved similarly in both mammalian systems. We also noted that succinate and acetate clustered in the F2 dimension of the CA plot with mice and yeast, which indicated that these metabolites responded similarly in the two model organisms. Besides alanine, glutamine, glycerol and valine, no additional metabolites were observed that were unique solely to yeast and humans.
Discussion
Metabolomics is concerned with determining the identities, concentrations, and distributions of small molecules in living systems with the presumption that the resulting metabolic profiles are reflective of an organism's physiological status. Therefore, perturbation to an organism's biological processes should result in distinct changes to its steady-state metabolome, making metabolomics a powerful multi-parameter profiling technique that is well suited for identifying disease-dependent metabolic aberrations.48-51 We have applied a metabolomics approach for discerning the unique gain-of-toxic function effects attributable to mutant huntingtin's toxicity in a HD yeast model and we have compared these results with the metabolic restructuring that occurs in human HD patients and transgenic mice.
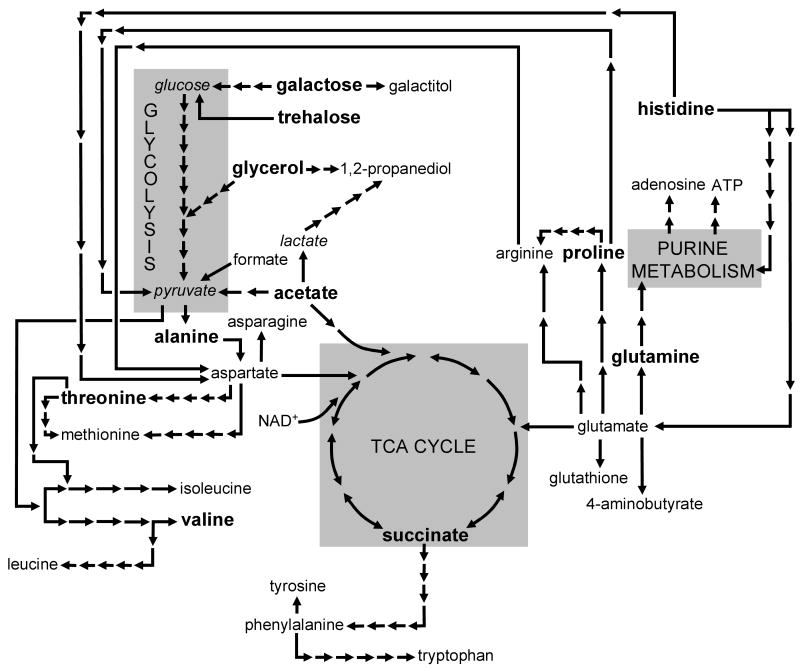
Using our yeast model to map metabolites that exhibited significant shifts in their relative intracellular concentrations showed that disruptions are detected in the steady-state concentrations of small molecules whose metabolic pathways are seemingly independent (Figure 6). For example, the biochemically distinct compounds trehalose, proline, glutamine, galactose, and acetate exhibited large changes in their respective concentrations following mHtt expression. However, if these metabolites are considered in terms of their major cellular roles – energy storage/generation (acetate, galactose and trehalose) and maintenance of intracellular nitrogen pools (glutamine and proline) – then potential links among these small molecules begin to emerge. Consequently, metabolomics can be used to provide evidence for errant or disrupted regulatory processes that are involved in HD-related cell death. However, caution should be used in applying this form of interpretation to these findings since inferences based simply on assigning gross biochemical roles to individual metabolites can be deceptive of their true functions within complex metabolic networks.52
Figure 6.
Map illustrating the biochemical linkages among the primary metabolites identified in HD yeast. Only the most predominant metabolic pathways are shown for simplicity. Metabolites shown in bold underwent significant concentration changes in 25Q versus 103Q yeast. Arrows represent individual metabolic (enzymatic) steps required for biotransformation (note – italicized metabolites were not observed in yeast extracts, but represent known and important metabolic links).
Several conserved metabolic changes have been observed that are shared among HD yeast, mice, and humans (Figure 7), and this has revealed what we believe represents a core set of phenotypic (metabolic) markers related to mHtt expression. The metabolites alanine, glutamine, glycerol, and valine show substantial promise as biomarkers for gauging mutant huntingtin's gain-of-toxic function effects. It is anticipated that metabolomics and other ‘-omics’-based strategies will have important applications that may be applied to discerning the cellular mechanisms of HD. However, at the present time, it is not immediately apparent how altered levels of alanine, glutamine, glycerol, and valine are linked to mutant huntingtin's toxicity. Further experiments will be needed to probe the relationships among cellular pathways that are impacted by mutant huntingtin.
Figure 7.
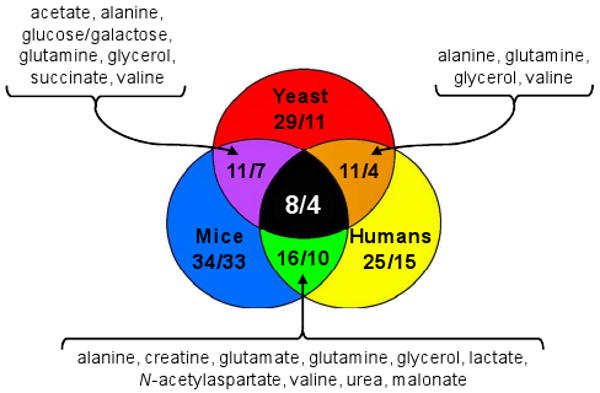
Venn diagram illustrating similarities among the metabolomes of humans, mice, and yeast expressing mHtt. Pairs of integers represent the number of metabolites identified within a given organism or set of organisms (first integer) versus the number of biomolecules that are reported to undergo significant concentration changes (second integer). Among the eight metabolites that are reported from all three HD systems, four (alanine, glutamine, glycerol, and valine) undergo significant shifts in concentrations following mutant huntingtin expression. The metabolites listed in the diagram are those found significantly altered in the three pair-wise comparisons (clockwise from left side: yeast and mice, mice and humans, and yeast and humans). A complete list of all metabolites is provided in Supporting Information, Table 2.
Despite the passing of nearly two decades since the genetic basis of HD was defined,53 no clinically-approved therapeutic agents have been developed that allay the toxicity component of this disorder.54 We foresee that one exciting potential application of our multispecies approach to investigating mutant huntingtin's toxicity is this method's capacity for sifting through large biomarker sets so that metabolic perturbations arising from the disruption of conserved biological features can be identified. These pathways are anticipated to provide focused insight into the biochemical networks that may be involved in HD and respond positively to therapeutic modulation. Currently, our lab is exploring several of these pathways as part of a comprehensive effort to develop novel therapeutic approaches for treating the underlying toxicity component of mutant huntingtin. We expect that our efforts toward this endeavor will be reported in due course.
Supplementary Material
Acknowledgments
We appreciate the financial support that was provided by the University of Oklahoma College of Arts and Sciences and Department of Chemistry and Biochemistry. Additional funding was also provided through the Graduate Assistance in Areas of Need Fellowship and Dick van der Helm Internship Program. Partial funding for this project was made possible by a grant from the National Institutes of Health (1R21NS064313-01A1).
Footnotes
Supporting Information Available: Images of huntingtin aggregates in the yeast model and the differential growth of 103Q versus 25Q (Supporting Information, Figure 1), table of 1H NMR chemical shifts and multiplicities for all metabolites identified in this study (Supporting Information, Table 1), PCA analysis and experimental conditions for toxin studies (Supporting Information, Figure 2), table of all metabolites reported/identified in yeast, mice, and humans (Supporting Information, Table 2), and contingency table used for CA (Supporting Information, Table 3) are provided. This material is available free of charge via the Internet at http://pubs.acs.org.
References
- 1.Imarisio S, Carmichael J, Korolchuk V, Chen CW, Saiki S, Rose C, Krishna G, Davies JE, Ttofi E, Underwood BR, Rubinsztein DC. Huntington's disease: from pathology and genetics to potential therapies. Biochem J. 2008;412(2):191–209. doi: 10.1042/BJ20071619. [DOI] [PubMed] [Google Scholar]
- 2.Walker FO. Huntington's disease. Lancet. 2007;369(9557):218–228. doi: 10.1016/S0140-6736(07)60111-1. [DOI] [PubMed] [Google Scholar]
- 3.Langbehn DR, Hayden MR, Paulsen JS. CAG-repeat length and the age of onset in Huntington disease (HD): A review and validation study of statistical approaches. Am J Med Genet B Neuropsychiatr Genet. 2009 doi: 10.1002/ajmg.b.30992. [DOI] [PMC free article] [PubMed] [Google Scholar]
- 4.Shao J, Diamond MI. Polyglutamine diseases: emerging concepts in pathogenesis and therapy. Hum Mol Genet. 2007;16(R2):R115–123. doi: 10.1093/hmg/ddm213. [DOI] [PubMed] [Google Scholar]
- 5.Yang SH, Cheng PH, Banta H, Piotrowska-Nitsche K, Yang JJ, Cheng ECH, Snyder B, Larkin K, Liu J, Orkin J, Fang ZH, Smith Y, Bachevalier J, Zola SM, Li SH, Li XJ, Chan AWS. Towards a transgenic model of Huntington's disease in a non-human primate. Nature. 2008;453(7197):921–924. doi: 10.1038/nature06975. [DOI] [PMC free article] [PubMed] [Google Scholar]
- 6.Menalled L, El-Khodor BF, Patry M, Suárez-Fariñas M, Orenstein SJ, Zahasky B, Leahy C, Wheeler V, Yang XW, MacDonald M, Morton AJ, Bates G, Leeds J, Park L, Howland D, Signer E, Tobin A, Brunner D. Systematic behavioral evaluation of Huntington's disease transgenic and knock-in mouse models. Neurobiol Dis. 2009;35:319–336. doi: 10.1016/j.nbd.2009.05.007. [DOI] [PMC free article] [PubMed] [Google Scholar]
- 7.Van Raamsdonk JM, Warby SC, Hayden MR. Selective degeneration in YAC mouse models of Huntington disease. Brain Res Bull. 2007;72(23):124–131. doi: 10.1016/j.brainresbull.2006.10.018. [DOI] [PubMed] [Google Scholar]
- 8.Masuda N, Peng Q, Li Q, Jiang M, Liang Y, Wang X, Zhao M, Wang W, Ross CA, Duan W. Tiagabine is neuroprotective in the N171-82Q and R6/2 mouse models of Huntington's disease. Neurobiol Dis. 2008;30(3):293–302. doi: 10.1016/j.nbd.2008.01.014. [DOI] [PMC free article] [PubMed] [Google Scholar]
- 9.Diekmann H, Anichtchik O, Fleming A, Futter M, Goldsmith P, Roach A, Rubinsztein DC. Decreased BDNF levels are a major contributor to the embryonic phenotype of huntingtin knockdown zebrafish. J Neurosci. 2009;29(5):1343–1349. doi: 10.1523/JNEUROSCI.6039-08.2009. [DOI] [PMC free article] [PubMed] [Google Scholar]
- 10.Schiffer NW, Broadley SA, Hirschberger T, Tavan P, Kretzschmar HA, Giese A, Haass C, Hartl FU, Schmid B. Identification of anti-prion compounds as efficient inhibitors of polyglutamine protein aggregation in a zebrafish model. J Biol Chem. 2007;282(12):9195–9203. doi: 10.1074/jbc.M607865200. [DOI] [PubMed] [Google Scholar]
- 11.Lumsden AL, Henshall TL, Dayan S, Lardelli MT, Richards RI. Huntingtin-deficient zebrafish exhibit defects in iron utilization and development. Hum Mol Genet. 2007;16(16):1905–1920. doi: 10.1093/hmg/ddm138. [DOI] [PubMed] [Google Scholar]
- 12.Jackson GR, Salecker I, Dong X, Yao X, Arnheim N, Faber PW, MacDonald ME, Zipursky SL. Polyglutamine-expanded human huntingtin transgenes induce degeneration of Drosophila photoreceptor neurons. Neuron. 1998;21(3):633–642. doi: 10.1016/s0896-6273(00)80573-5. [DOI] [PubMed] [Google Scholar]
- 13.Branco J, Al-Ramahi I, Ukani L, Perez AM, Fernandez-Funez P, Rincon-Limas D, Botas J. Comparative analysis of genetic modifiers in Drosophila points to common and distinct mechanisms of pathogenesis among polyglutamine diseases. Hum Mol Genet. 2008;17(3):376–390. doi: 10.1093/hmg/ddm315. [DOI] [PubMed] [Google Scholar]
- 14.Wolfgang WJ, Miller TW, Webster JM, Huston JS, Thompson LM, Marsh JL, Messer A. Suppression of Huntington's disease pathology in Drosophila by human single-chain Fv antibodies. Proc Natl Acad Sci U S A. 2005;102(32):11563–11568. doi: 10.1073/pnas.0505321102. [DOI] [PMC free article] [PubMed] [Google Scholar]
- 15.Ravikumar B, Vacher C, Berger Z, Davies JE, Luo S, Oroz LG, Scaravilli F, Easton DF, Duden R, O'Kane CJ, Rubinsztein DC. Inhibition of mTOR induces autophagy and reduces toxicity of polyglutamine expansions in fly and mouse models of Huntington disease. Nat Genet. 2004;36(6):585–595. doi: 10.1038/ng1362. [DOI] [PubMed] [Google Scholar]
- 16.Jeong H, Then F, Melia TJ, Jr, Mazzulli JR, Cui L, Savas JN, Voisine C, Paganetti P, Tanese N, Hart AC, Yamamoto A, Krainc D. Acetylation targets mutant huntingtin to autophagosomes for degradation. Cell. 2009;137(1):60–72. doi: 10.1016/j.cell.2009.03.018. [DOI] [PMC free article] [PubMed] [Google Scholar]
- 17.Faber PW, Voisine C, King DC, Bates EA, Hart AC. Glutamine/proline-rich PQE-1 proteins protect Caenorhabditis elegans neurons from huntingtin polyglutamine neurotoxicity. Proc Natl Acad Sci U S A. 2002;99(26):17131–17136. doi: 10.1073/pnas.262544899. [DOI] [PMC free article] [PubMed] [Google Scholar]
- 18.Faber PW, Alter JR, MacDonald ME, Hart AC. Polyglutamine-mediated dysfunction and apoptotic death of a Caenorhabditis elegans sensory neuron. Proc Natl Acad Sci U S A. 1999;96(1):179–184. doi: 10.1073/pnas.96.1.179. [DOI] [PMC free article] [PubMed] [Google Scholar]
- 19.Satyal SH, Schmidt E, Kitagawa K, Sondheimer N, Lindquist S, Kramer JM, Morimoto RI. Polyglutamine aggregates alter protein folding homeostasis in Caenorhabditis elegans. Proc Natl Acad Sci U S A. 2000;97(11):5750–5755. doi: 10.1073/pnas.100107297. [DOI] [PMC free article] [PubMed] [Google Scholar]
- 20.Desai UA, Pallos J, Ma AAK, Stockwell BR, Thompson LM, Marsh JL, Diamond MI. Biologically active molecules that reduce polyglutamine aggregation and toxicity. Hum Mol Genet. 2006;15(13):2114–2124. doi: 10.1093/hmg/ddl135. [DOI] [PubMed] [Google Scholar]
- 21.Igarashi S, Morita H, Bennett KM, Tanaka Y, Engelender S, Peters MF, Cooper JK, Wood JD, Sawa A, Ross CA. Inducible PC12 cell model of Huntington's disease shows toxicity and decreased histone acetylation. Neuroreport. 2003;14(4):565–568. doi: 10.1097/00001756-200303240-00007. [DOI] [PubMed] [Google Scholar]
- 22.Subramaniam S, Sixt KM, Barrow R, Snyder SH. Rhes, a striatal specific protein, mediates mutant-huntingtin cytotoxicity. Science. 2009;324(5932):1327–1330. doi: 10.1126/science.1172871. [DOI] [PMC free article] [PubMed] [Google Scholar]
- 23.Meriin AB, Zhang X, He X, Newnam GP, Chernoff YO, Sherman MY. Huntington toxicity in yeast model depends on polyglutamine aggregation mediated by a prion-like protein Rnq1. J Cell Biol. 2002;157(6):997–1004. doi: 10.1083/jcb.200112104. [DOI] [PMC free article] [PubMed] [Google Scholar]
- 24.Giorgini F, Muchowski PJ. Exploiting Yeast Genetics to Inform Therapeutic Strategies for Huntington's Disease. In: Stagljar I, editor. Yeast Functional Genomics and Proteomics. Vol. 548. Humana Press; New York: 2009. pp. 161–174. [DOI] [PubMed] [Google Scholar]
- 25.Krobitsch S, Lindquist S. Aggregation of huntingtin in yeast varies with the length of the polyglutamine expansion and the expression of chaperone proteins. Proc Natl Acad Sci U S A. 2000;97(4):1589–1594. doi: 10.1073/pnas.97.4.1589. [DOI] [PMC free article] [PubMed] [Google Scholar]
- 26.Gil JM, Rego AC. The R6 lines of transgenic mice: a model for screening new therapies for Huntington's disease. Brain Res Rev. 2009;59(2):410–431. doi: 10.1016/j.brainresrev.2008.12.001. [DOI] [PubMed] [Google Scholar]
- 27.Li JY, Popovic N, Brundin P. The use of the R6 transgenic mouse models of Huntington's disease in attempts to develop novel therapeutic strategies. NeuroRx. 2005;2(3):447–464. doi: 10.1602/neurorx.2.3.447. [DOI] [PMC free article] [PubMed] [Google Scholar]
- 28.Wang W, Duan W, Igarashi S, Morita H, Nakamura M, Ross CA. Compounds blocking mutant huntingtin toxicity identified using a Huntington's disease neuronal cell model. Neurobiol Dis. 2005;20(2):500–508. doi: 10.1016/j.nbd.2005.03.026. [DOI] [PubMed] [Google Scholar]
- 29.Sarkar S, Perlstein EO, Imarisio S, Pineau S, Cordenier A, Maglathlin RL, Webster JA, Lewis TA, O'Kane CJ, Schreiber SL, Rubinsztein DC. Small molecules enhance autophagy and reduce toxicity in Huntington's disease models. Nat Chem Biol. 2007;3(6):331–338. doi: 10.1038/nchembio883. [DOI] [PMC free article] [PubMed] [Google Scholar]
- 30.Zhang X, Smith DL, Meriin AB, Engemann S, Russel DE, Roark M, Washington SL, Maxwell MM, Marsh JL, Thompson LM, Wanker EE, Young AB, Housman DE, Bates GP, Sherman MY, Kazantsev AG. A potent small molecule inhibits polyglutamine aggregation in Huntington's disease neurons and suppresses neurodegeneration in vivo. Proc Natl Acad Sci U S A. 2005;102(3):892–897. doi: 10.1073/pnas.0408936102. [DOI] [PMC free article] [PubMed] [Google Scholar]
- 31.Outeiro TF, Giorgini F. Yeast as a drug discovery platform in Huntington's and Parkinson's diseases. Biotechnol J. 2006;1(3):258–269. doi: 10.1002/biot.200500043. [DOI] [PubMed] [Google Scholar]
- 32.Williams RB, Gutekunst WR, Joyner PM, Duan W, Li Q, Ross CA, Williams TD, Cichewicz RH. Bioactivity profiling with parallel mass spectrometry reveals an assemblage of green tea metabolites affording protection against human huntingtin and α-synuclein toxicity. J Agric Food Chem. 2007;55(23):9450–9456. doi: 10.1021/jf072241x. [DOI] [PubMed] [Google Scholar]
- 33.Jolliffe IT. Principal Component Analysis. Springer-Verlag; New York: 2002. [Google Scholar]
- 34.Tsang TM, Haselden JN, Holmes E. Metabonomic characterization of the 3-nitropropionic acid rat Model of Huntington's disease. Neurochem Res. 2009;34(7):1261–1271. doi: 10.1007/s11064-008-9904-5. [DOI] [PubMed] [Google Scholar]
- 35.Greenacre M. Correspondence analysis in medical research. Stat Methods Med Res. 1992;1(1):97–117. doi: 10.1177/096228029200100106. [DOI] [PubMed] [Google Scholar]
- 36.Greenacre M. Correspondence analysis in practice. 2nd. Chapman & Hall/CRC Taylor & Francis Group; Boca Raton: 2007. [Google Scholar]
- 37.Greenacre MJ, Degos L. Correspondence analysis of HLA gene frequency data from 124 population samples. Am J Hum Genet. 1977;1(1):60–75. [PMC free article] [PubMed] [Google Scholar]
- 38.Weljie AM, Newton J, Mercier P, Carlson E, Slupsky CM. Targeted profiling: quantitative analysis of 1H NMR metabolomics data. Anal Chem. 2006;78(13):4430–4442. doi: 10.1021/ac060209g. [DOI] [PubMed] [Google Scholar]
- 39.Cattaneo E, Zuccato C, Tartari M. Normal huntingtin function: an alternative approach to Huntington's disease. Nat Rev Neurosci. 2005;6(12):919–930. doi: 10.1038/nrn1806. [DOI] [PubMed] [Google Scholar]
- 40.Nicoli F, Vion-Dury J, Maloteaux JM, Delwaide C, Confort-Gouny S, Sciaky M, Cozzone PJ. CSF and serum metabolic profile of patients with Huntington's chorea: a study by high resolution proton NMR spectroscopy and HPLC. Neurosci Lett. 1993;154(12):47–51. doi: 10.1016/0304-3940(93)90168-k. [DOI] [PubMed] [Google Scholar]
- 41.Reynolds NC, Prost RW, Mark LP. Heterogeneity in 1H-MRS profiles of presymptomatic and early manifest Huntington's disease. Brain Res. 2005;1031(1):82–89. doi: 10.1016/j.brainres.2004.10.030. [DOI] [PubMed] [Google Scholar]
- 42.Taylor-Robinson SD, Weeks RA, Bryant DJ, Sargentoni J, Marcus CD, Harding AE, Brooks DJ. Proton magnetic resonance spectroscopy in Huntington's disease: evidence in favour of the glutamate excitotoxic theory. Mov Disord. 1996;11(2):167–173. doi: 10.1002/mds.870110209. [DOI] [PubMed] [Google Scholar]
- 43.Underwood BR, Broadhurst D, Dunn WB, Ellis DI, Michell AW, Vacher C, Mosedale DE, Kell DB, Barker RA, Grainger DJ, Rubinsztein DC. Huntington disease patients and transgenic mice have similar pro-catabolic serum metabolite profiles. Brain. 2006;129(4):877–886. doi: 10.1093/brain/awl027. [DOI] [PubMed] [Google Scholar]
- 44.Jenkins BG, Andreassen OA, Dedeoglu A, Leavitt B, Hayden M, Borchelt D, Ross CA, Ferrante RJ, Beal MF. Effects of CAG repeat length, HTT protein length and protein context on cerebral metabolism measured using magnetic resonance spectroscopy in transgenic mouse models of Huntington's disease. J Neurochem. 2005;95(2):553–562. doi: 10.1111/j.1471-4159.2005.03411.x. [DOI] [PubMed] [Google Scholar]
- 45.Jenkins BG, Klivenyi P, Kustermann E, Andreassen OA, Ferrante RJ, Rosen BR, Beal MF. Nonlinear decrease over time in N-acetyl aspartate levels in the absence of neuronal loss and increases in glutamine and glucose in transgenic Huntington's disease mice. J Neurochem. 2000;74(5):2108–2119. doi: 10.1046/j.1471-4159.2000.0742108.x. [DOI] [PubMed] [Google Scholar]
- 46.Tkac I, Dubinsky JM, Keene CD, Gruetter R, Low WC. Neurochemical changes in Huntington R6/2 mouse striatum detected by in vivo 1H NMR spectroscopy. J Neurochem. 2007;100(5):1397–1406. doi: 10.1111/j.1471-4159.2006.04323.x. [DOI] [PMC free article] [PubMed] [Google Scholar]
- 47.Tsang TM, Woodman B, McLoughlin GA, Griffin JL, Tabrizi SJ, Bates GP, Holmes E. Metabolic characterization of the R6/2 transgenic mouse model of Huntington's disease by high-resolution MAS 1H NMR spectroscopy. J Proteome Res. 2006;5(3):483–492. doi: 10.1021/pr050244o. [DOI] [PubMed] [Google Scholar]
- 48.Kaddurah-Daouk R, Krishnan KRR. Metabolomics: a global biochemical approach to the study of central nervous system diseases. Neuropsychopharmacology. 2008;34(1):173–186. doi: 10.1038/npp.2008.174. [DOI] [PubMed] [Google Scholar]
- 49.Gowda GN, Zhang S, Gu H, Asiago V, Shanaiah N, Raftery D. Metabolomics-based methods for early disease diagnostics. Expert Rev Mol Diagn. 2008;8(5):617–633. doi: 10.1586/14737159.8.5.617. [DOI] [PMC free article] [PubMed] [Google Scholar]
- 50.Powers R. NMR metabolomics and drug discovery. Magn Reson Chem. 2009 doi: 10.1002/mrc.2461. [DOI] [PubMed] [Google Scholar]
- 51.Dunckley T, Coon KD, Stephan DA. Discovery and development of biomarkers of neurological disease. Drug Discov Today. 2005;10(5):326–334. doi: 10.1016/S1359-6446(04)03353-7. [DOI] [PubMed] [Google Scholar]
- 52.Steuer R. Review: On the analysis and interpretation of correlations in metabolomic data. Brief Bioinformatics. 2006;7(2):151–158. doi: 10.1093/bib/bbl009. [DOI] [PubMed] [Google Scholar]
- 53.MacDonald ME, Ambrose CM, Duyao MP, Myers RH, Lin C, Srinidhi L, Barnes G, Taylor SA, James M, Groot N, MacFarlane H, Jenkins B, Anderson MA, Wexler NS, Gusella JF, Bates GP, Baxendale S, Hummerich H, Kirby S, North M, Youngman S, Mott R, Zehetner G, Sedlacek Z, Poustka A, Frischauf AM, Lehrach H, Buckler AJ, Church D, Doucette-Stamm L, O'Donovan MC, Riba-Ramirez L, Shah M, Stanton VP, Strobel SA, Draths KM, Wales JL, Dervan P, Housman DE, Altherr M, Shiang R, Thompson L, Fielder T, Wasmuth JJ, Tagle D, Valdes J, Elmer L, Allard M, Castilla L, Swaroop M, Blanchard K, Collins FS, Snell R, Holloway T, Gillespie K, Datson N, Shaw D, Harper PS. A novel gene containing a trinucleotide repeat that is expanded and unstable on Huntington's disease chromosomes. Cell. 1993;72(6):971–983. doi: 10.1016/0092-8674(93)90585-e. [DOI] [PubMed] [Google Scholar]
- 54.Fecke W, Gianfriddo M, Gaviraghi G, Terstappen GC, Heitz F. Small molecule drug discovery for Huntington's Disease. Drug Discov Today. 2009;14(910):453–464. doi: 10.1016/j.drudis.2009.02.006. [DOI] [PubMed] [Google Scholar]
Associated Data
This section collects any data citations, data availability statements, or supplementary materials included in this article.


