

Abstract
Background
Traditionally, the determination of the occurrence of hypertension in patients has relied on costly and time-consuming survey methods that do not allow patients to be followed over time.
Objectives
To determine the accuracy of using administrative claims data to identify rates of hypertension in a large population living in a single-payer health care system.
Methods
Various definitions for hypertension using administrative claims databases were compared with 2 other reference standards: (1) data obtained from a random sample of primary care physician offices throughout the province, and (2) self-reported survey data from a national census.
Results
A case-definition algorithm employing 2 outpatient physician billing claims for hypertension over a 3-year period had a sensitivity of 73% (95% confidence interval [CI] 69%–77%), a specificity of 95% (CI 93%–96%), a positive predictive value of 87% (CI 84%–90%), and a negative predictive value of 88% (CI 86%–90%) for detecting hypertensive adults compared with physician-assigned diagnoses. Compared with self-reported survey data, the algorithm had a sensitivity of 64% (CI 63%–66%), a specificity of 94%(CI 93%–94%), a positive predictive value of 77% (76%–78%), and negative predictive value of 89% (CI 88%–89%). When this algorithm was applied to the entire province of Ontario, the age- and sex-standardized prevalence of hypertension in adults older than 35 years increased from 20% in 1994 to 29% in 2002.
Conclusions
It is possible to use administrative data to accurately identify from a population sample those patients who have been diagnosed with hypertension. Given that administrative data are already routinely collected, their use is likely to be substantially less expensive compared with serial cross-sectional or cohort studies for surveillance of hypertension occurrence and outcomes over time in a large population.
Introduction
Determining the incidence and prevalence of chronic diseases such as hypertension has traditionally relied on data collected from self-report surveys, chart audits, or physical measure surveys. However, these methods are time consuming and costly, and are generally conducted at single points in time or in restricted locales with highly select samples; as such, their results cannot be used for population-based disease surveillance. In Canada, the most recent estimates of hypertension prevalence based on physical measures are over 10 years old.1
In countries that have government-funded, single-payer health care systems, the use of administrative claims has been shown to accurately reflect the incidence and prevalence of acute conditions requiring hospital admission (such as myocardial infarction, heart failure, and stroke).2-5 The use of outpatient physician billing records to examine chronic ambulatory conditions is less well studied. Whether such a system could work for hypertension surveillance on a national basis (both in Canada and in other countries that routinely collect similar data) depends on the accuracy of administrative claims data in identifying individuals with hypertension.
Our objective in this study was to determine the accuracy of administrative database case-definition algorithms for hypertension against a variety of reference standards for hypertension surveillance in a single-payer health care system.
Methods
Data sources for validation of administrative data algorithm
Outpatient primary care chart data
We obtained a randomly generated list of 500 family physicians practising in Ontario (Canada's largest province, with a total population of over 12 million in 2004) from the College of Family Physicians of Canada. To physicians on this list, we faxed a request for participation in our study with the offer of continuing medical education credits and a modest honorarium. We were able to recruit 76 physicians who practised on a fee-for-service basis and had been in their current practice site for at least 3 years. Eighty-three percent of the physicians who agreed to participate in our study practised in urban areas, 68% were in group practice and 54% were male. The average age of the physicians was 47 years, and the average time since graduation was 21 years.
Trained research nurses visited each practice between December 2004 and August 2005 and audited a random sample of charts of adult patients 35 years of age or older or 65 years of age or older in each practice (up to a maximum of 40 patients per practice). We estimated that we would need to audit 1,648 patients based on an estimated hypertension prevalence of 20% in adults age 35 years or older and 824 patients age 65 years or older based on an estimated hypertension prevalence of 40%,1 an assumed sensitivity of 78% for the hypertension case-definition algorithm with standard error calculation of +/- 0.5, and a 25% inflation factor, in case our prevalence was lower than estimated. In computerized practices, adult patients were chosen using a random sample from computer generated patient lists; in non-computerized practices, abstractors measured the length of shelves containing patient charts and selected a chart at each 1/40th of the distance to assess for study eligibility.
Our inclusion criteria for randomly selected charts were as follows: (1) age 35 years or older or age 65 years or older who (2) were "regular" patients of the participating physician (as defined by at least two of: seen the most, did a complete physical, or registered under the participating physician),(3) were still in the practice and had a valid Ontario health card number, (4) had first visited the participating physician at least 3 years before the date of chart abstraction for our study and (5) had been seen at least twice over the 3 years preceding the date of chart abstraction for our study.
We collected data from progress notes, lab results, and consult notes from the 3 years before the abstraction date and also from cumulative patient profiles where these were available. We classified individuals as having a diagnosis of hypertension if a physician-assigned diagnosis was recorded in their chart, or they had a prescription for an antihypertensive medication in the context of an elevated blood pressure reading, or if their recorded blood pressures met the criteria for diagnosis laid out in the Canadian Hypertension Education Program guidelines (which were stable throughout the years our chart audit data were drawn from).7 Ten percent of the charts were abstracted by two abstractors, and overall agreement for the presence or absence of hypertension was very good at 92.8% agreement (kappa 0.84).
Administrative claims data
Health card numbers were encrypted and converted into unique identifiers and linked to the Ontario Health Insurance Plan (OHIP) physician billing claims database and the Canadian Institute for Health Information (CIHI) hospital discharge abstracts database for each patient in the chart audit study. A variety of case-definition algorithms (see Figure 1) using hypertension codes (ICD-9-CM codes 401.x, 402.x, 403.x, 404.x, or 405.x and/or ICD-10 codes I10.x, I11.x, I12.x, I13.x, or I15.x in CIHI fiscal years 2002-2004) in physician billing claims alone and with hospital discharge records over various time frames were explored for percentage agreement, kappa score, sensitivity, specificity, positive/negative predictive values and area under the Receiver Operating Characteristic (ROC) curve. The chart audit diagnosis was used as the reference standard, and 95% confidence intervals were calculated using a binomial probability distribution. We defined sensitivity as the proportion of individuals with hypertension documented in their physician chart who were identified as having hypertension using administrative data, and we defined specificity as the proportion of individuals without hypertension documented in their physician chart who were identified as not having hypertension using the administrative data. We defined positive predictive value as the proportion of individuals identified as having hypertension in the administrative data whose diagnosis was confirmed by chart audit, and negative predictive value as the proportion of individuals identified as not having hypertension in the administrative data whose lack of a hypertension diagnosis was confirmed by chart audit.
Figure 1.

Forest plots for validation of hypertension case-definition algorithms against primary care chart data for 1676 patients older than 35 years (32% with chart diagnosis of hypertension)
Sensitivity analyses
We also tested the same 12 hypertension case-definition algorithms in the administrative claims data against a self-reported survey reference standard: the Canadian Community Health Survey 2001.8 The data for this self-report survey was collected between September 2000 and November 2001 and included 39,278 respondents from Ontario aged 12 and over, of whom 84% agreed to linkage with administrative data for research purposes. Patients were defined as being hypertensive if they answered yes to either or both of two questions: "Do you have high blood pressure?" and "In the past month did you take medicine for blood pressure?"
We explored the performance of these case-definition algorithms in the elderly subgroup from our primary care chart audit to determine if having a higher number of comorbid conditions decreased the likelihood for coding for hypertension.
Determination of rates of hypertension
We examined the impact of different administrative database case-definition algorithms on estimates of the prevalence of hypertension in the adult population of Ontario, Canada, in fiscal year 2002. In addition, we examined annual population-adjusted, age- and sex-standardized changes, according to 2002 Statistics Canada census population records for Ontario, in the prevalence and incidence of hypertension between 1994 and 2002 in Ontario using all 12 case-definition algorithms (but in this article we report only the results for the "two physician claims in 3 years" algorithm; details of other analyses are available from the corresponding author). Prevalent cases were carried forward for each year, patients who died or moved out of the province were excluded, and only individuals with no previous claims for hypertension were counted as incident cases for the relevant fiscal year. Billing claims with a hypertension code 120 days before or 90 days after a hospital gestational record were excluded to avoid counting pregnancy-induced hypertension as hypertension. Although we have OHIP administrative data from 1991 onward, we did not examine prevalence and incidence rates until the 1994 fiscal year in order to have 3 prior years of physician billing data to use as a "wash-out" period to minimize the possibility that we would overestimate incidence rates in the initial years of our study. Prevalence and incidence rates are presented up to 2002, as using a case-definition algorithm requiring 2 claims in 3 years slightly underestimates incident cases in 2003 and 2004, given the absence of hospital admission data after fiscal 2004 and physician billing data after fiscal 2005 respectively.
Results
Our chart audit study sample consisted of 1,676 adult patients (average age 55.6 years, standard deviation 12.5 years), of whom 32% (547 patients) had a diagnosis of hypertension. In the second cohort of 1,038 patients older than 65 years (average age 74.7 years) the prevalence of hypertension was 63% (653 patients). The prevalence of self-reported hypertension in the 22,087 individuals age 35 and over in the 2001 Canadian Community Health Survey (average age 55.6 years, standard deviation 15.5 years ) was 25%. The overall agreement between the primary care chart diagnosis and administrative claims data was greater than 80% for all of the hypertension case-definition algorithms (Figure 1). Those case-definition algorithms that required more than a single claim for hypertension in the administrative data before classifying an individual as hypertensive had higher specificity and positive predictive values than definitions based on a single billing or hospitalization claim (Figure 1). Case-definition algorithms that were based on a longer observation period had a greater sensitivity for the detection of hypertension and larger area under the ROC curve than algorithms based on the administrative data from a single year (Figure 1). Prevalence estimates for Ontario adults age 35 and older in 2002 ranged from 27% to 30% for the two-claim rules and 37% to 38% for the one-claim rules.
Sensitivity analyses
Comparison to self-reported diagnoses of hypertension in the 2001 Canadian Community Health Survey (Figure 2) confirmed that the "2 physician billing claims in 3 years" or "2 physician billing claims or 1 hospital discharge in 3 years" case-definition algorithms for hypertension were also reasonably accurate in that dataset. Although the comparison to self-reported diagnosis had similar specificities, sensitivities were somewhat lower than those seen when the primary care chart diagnosis was used as the reference standard. These case-definition algorithms performed well in older patients from our primary care chart audit: 81% overall agreement, 78% sensitivity, 86% specificity, 90% positive predictive value, and 70% negative predictive value for "2 physician billing claims in 3 years".
Figure 2.

Forest plots for validation of hypertension case-definition algorithms against self-report survey data for 22,087 adult patients (23% with self-reported diagnosis of hypertension)
Hypertension occurrence rates over time
Using our "2 physician billing claims in 3 years" case-definition, the age- and sex-standardized prevalence of hypertension in Ontario rose steadily from 20% of the population aged 35 or older in 1994 to 29% in 2002, and the age- and sex-standardized incidence remained relatively constant at approximately 2% of the population per year (Figure 3).
Figure 3.
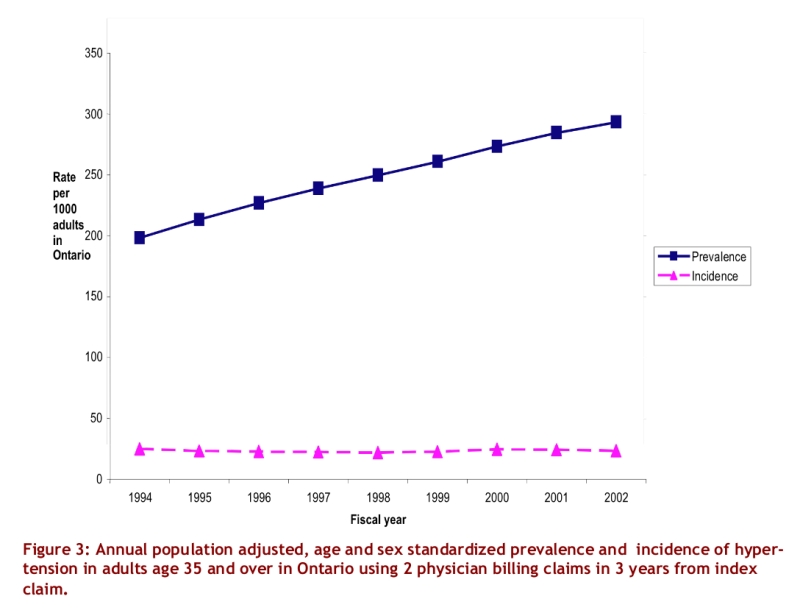
Annual population adjusted, age and sex standardized prevalence and incidence of hypertension in adults age 35 and over in Ontario using 2 physician billing claims in 3 years from index claim.
Discussion
In this study, we compared the accuracy of multiple algorithms for defining hypertension in administrative data to real-world patients whose charts we reviewed from family practices in Ontario. We believe that we have demonstrated that the use of administrative data to define hypertension and conduct ongoing surveillance of prevalence and incidence is feasible and reasonably accurate in adult patients — including those older than 65 years old, who are more likely to have multiple co-morbidities.
The accuracy of the hypertension case-definition algorithm we suggest ("2 physician outpatient billing claims in 3 years") compares very favourably with the diabetes case-definition algorithm used currently in Canada for a national diabetes surveillance program ("2 physician outpatient billing claims or 1 hospital discharge in 2 years").9 Indeed, the positive predictive value of our hypertension algorithm (87%) exceeds the 80% positive predictive value for the diabetes algorithm that has become the "gold standard" for diabetes health outcomes research employing administrative databases. However, it should be recognized that there is always a trade-off between sensitivity and specificity in choosing a case-definition algorithm for any condition in an administrative claims database, and that the optimal algorithm for defining hypertension depends upon the purpose of a study. Thus, when defining the burden of illness with hypertension for the purposes of resource allocation planning, one would conceivably wish to identify as many cases as possible and thereby choose an algorithm with the highest sensitivity. On the other hand, in examining practice patterns and outcomes from hypertension, one would wish to choose an algorithm with the highest specificity to ensure that as few non-hypertensive patients as possible are included in the study sample. Thus, the data we provide in Figure 1 and Figure 2 will have wider application for hypertension outcomes researchers than simply establishing the best case-definition algorithm for a national surveillance program.
Our findings confirm and extend the data from previous studies that have examined the detection of hypertension using administrative databases. For example, similarly to a previous study,10 we found that the use of hospitalization data did not greatly enhance the accuracy of administrative data in identifying people with hypertension. Indeed, given the time lag in obtaining hospital discharge data in many administrative data sets (in Ontario the lag can be as long as 2 fiscal years for hospital discharge data while the time lag for physician outpatient billing data is approximately 3 months), we believe that our findings should reassure health services researchers that the "2 outpatient physician billing claims in 3 years" is the optimal case-definition algorithm for future surveillance work on hypertension (at least in Ontario and provinces with similar outpatient billing records). Further, the sensitivity and specificity of the "one physician billing claim" case-definition algorithm was similar in our datasets to the results reported in two other Canadian provinces where this case-definition algorithm was tested: Manitoba6 (one physician billing claim in 2 years) and Quebec11 (one physician billing claim in one year). However, our study extends those studies by examining 12 hypertension case-definition algorithms in administrative data and by testing the algorithms in a variety of patient groups and for both physician-assigned diagnosis and self-reported diagnosis.
Our finding of a slightly higher discordance between hypertension case definition using administrative data and self-reported survey diagnoses is not surprising, given that approximately 5% of persons who report drug treatment for hypertension do not report a diagnosis of hypertension in Canadian surveys12 (presumably because they erroneously think that their condition is cured if they are taking medication). Thus, akin to investigators in diabetes health outcomes research, we believe that self-reported diagnosis is inadequate as a case definition for hypertension and thus place primary emphasis on our administrative data validation against the physician-assigned diagnosis in the primary care chart audit.
There are some limitations to our study. Our identification of patients with hypertension was limited to those patients who visited physicians and was further limited to patients that saw the participating physician regularly. However, in Ontario, health care is paid for by the government and is free at the point of delivery; fewer than 6% of Ontarians report not having a family physician, and fewer than 25% do not visit a primary care physician at least once a year.13 Thus, within a 2- or 3-year period it is likely that almost all Ontarians will have visited a physician at least once. Indeed, in the 2001 Canadian Community Health Survey, 73% of respondents reported having their blood pressure measured within the past year, and 85% reported having a blood pressure measured in the 2 years before the survey.8 Nonetheless, we do acknowledge that our prevalence estimates may underestimate the true prevalence of hypertension, as it is not known exactly how many cases of hypertension go undetected in Canada. Although most physicians in Ontario bill under the OHIP billing plan, approximately 2% are paid salaries under alternate funding plans; because this group does not bill fee-for-service, their activities do not show up on OHIP physician billing claims data.13 This in turn may also lead to a slight underestimation of the occurrence of hypertension within the population of Ontario. Finally, we acknowledge that the generalizability of our hypertension coding algorithm to other jurisdictions with different administrative data is unknown, but studies are ongoing to validate our findings in other jurisdictions.
The last national cross-sectional study that assessed blood pressure in Canada (the Canadian Heart Health Survey) was conducted in the early 1990s, cost over 3 million dollars, and has not yet been repeated due to financial constraints. Using administrative data to study hypertension occurrence and outcomes holds several potential attractions, not least of which include their readiness to be analyzed, their wide geographic coverage, and their relatively complete capture of episodes of patient contact with the health system. Our study has established that Canadian administrative data can be used to accurately examine the occurrence of hypertension.
Acknowledgments
We thank Janet E. Hux for reviewing the manuscript.
Biographies
Karen Tu, MD, MSc, is a Scientist at the Institute for Clinical Evaluative Sciences and Assistant Professor of Family Medicine at the University of Toronto.
Norman R.C. Campbell, MD, is a member of the University of Calgary Libin Cardiovascular Institute and Professor of Medicine, Pharmacology & Therapeutics, and Community Health Sciences at the University of Calgary.
Zhong-Liang Chen, MD, BSc, MSc is a Biostatistician at the Institute for Clinical Evaluative Sciences.
Karen J. Cauch-Dudek, is a Project Manager at the Institute for Clinical Evaluative Sciences.
Finlay A. McAlister, MD, MSc is an Associate Professor of Medicine at the University of Alberta.
Footnotes
Competing interests: Dr. Campbell has been paid fees for speaking and for consulting by most pharmaceutical companies in Canada that produce prescription medications to lower blood pressure and has received research funds from Pfizer Canada, Sanofi-Aventis, Merck Frosst, Servier and Bristol-Myers-Squibb for research on the epidemiology of hypertension. Dr. Campbell also chairs the steering committee and executive committee of the Canadian Hypertension Education Program (CHEP) as a volunteer. CHEP has a mandate to improve the treatment and control of hypertension in Canada. Dr. McAlister has received operating grant funding from Pfizer Canada for an ongoing investigator-initiated trial co-funded by the Heart and Stroke Foundation of Canada and Pfizer Canada. The other authors have no potential conflicts of interest.
Funding Source: This research was supported by a Grant-in-Aid from the Heart and Stroke Foundation of Ontario Grant #NA 5459. Dr. Tu is supported by a Canadian Institutes of Health Research (CIHR) Short-Term Clinician Investigator Award. Dr. McAlister is supported by an Alberta Heritage Foundation for Medical Research Population Health Scholar Award, a CIHR New Investigator Award, and the University of Alberta/Merck Frosst/Aventis Chair in Patient Health Management.
References
- 1.Joffres M R, Hamet P, Rabkin S W, Gelskey D, Hogan K, Fodor G. Prevalence, control and awareness of high blood pressure among Canadian adults. Canadian Heart Health Surveys Research Group. CMAJ. 1992 Jun 1;146(11):1997–2005. [PMC free article] [PubMed] [Google Scholar]
- 2.Tu Jack V, Austin Peter, Naylor C David, Iron Karey, Zhang Hua. Acute myocardial outcomes in Ontario. In: Naylor C, Slaughter P, editors. Cardiovascular health and services in Ontario: an ICES Atlas. 1999. pp. 83–110. http://www.ices.on.ca/file/7_CVA_Chapter5.pdf. [Google Scholar]
- 3.Jong Philip, Gong Yanyan, Liu Peter P, Austin Peter C, Lee Douglas S, Tu Jack V. Care and outcomes of patients newly hospitalized for heart failure in the community treated by cardiologists compared with other specialists. Circulation. 2003 Jul 15;108(2):184–191. doi: 10.1161/01.CIR.0000080290.39027.48. [DOI] [PubMed] [Google Scholar]
- 4.Hill M D, Yiannakoulias N, Jeerakathil T, Tu J V, Svenson L W, Schopflocher D P. The high risk of stroke immediately after transient ischemic attack: a population-based study. Neurology. 2004 Jun 8;62(11):2015–2020. doi: 10.1212/01.wnl.0000129482.70315.2f. [DOI] [PubMed] [Google Scholar]
- 5.Austin Peter C, Daly Paul A, Tu Jack V. A multicenter study of the coding accuracy of hospital discharge administrative data for patients admitted to cardiac care units in Ontario. Am Heart J. 2002 Aug;144(2):290–296. doi: 10.1067/mhj.2002.123839. [DOI] [PubMed] [Google Scholar]
- 6.Muhajarine N, Mustard C, Roos L L, Young T K, Gelskey D E. Comparison of survey and physician claims data for detecting hypertension. J Clin Epidemiol. 1997 Jun;50(6):711–718. doi: 10.1016/S0895-4356(97)00019-X. [DOI] [PubMed] [Google Scholar]
- 7.Hemmelgarn Brenda R, McAllister Finlay A, Myers Martin G, McKay Donald W, Bolli Peter, Abbott Carl, Schiffrin Ernesto L, Grover Steven, Honos George, Lebel Marcel, Mann Karen, Wilson Thomas, Penner Brian, Tremblay Guy, Tobe Sheldon W, Feldman Ross D. The 2005 Canadian Hypertension Education Program recommendations for the management of hypertension: part 1- blood pressure measurement, diagnosis and assessment of risk. Can J Cardiol. 2005 Jun;21(8):645–656. [PubMed] [Google Scholar]
- 8.Canadian Community Health Survey. Ottawa: Statistics Canada, Health Statistics Division; 2001. [Google Scholar]
- 9.Hux Janet E, Ivis Frank, Flintoft Virginia, Bica Adina. Diabetes in Ontario: determination of prevalence and incidence using a validated administrative data algorithm. Diabetes Care. 2002 Mar;25(3):512–516. doi: 10.2337/diacare.25.3.512. [DOI] [PubMed] [Google Scholar]
- 10.Robinson J R, Young T K, Roos L L, Gelskey D E. Estimating the burden of disease. Comparing administrative data and self-reports. Med Care. 1997 Sep;35(9):932–947. doi: 10.1097/00005650-199709000-00006. [DOI] [PubMed] [Google Scholar]
- 11.Wilchesky Machelle, Tamblyn Robyn M, Huang Allen. Validation of diagnostic codes within medical services claims. J Clin Epidemiol. 2004 Feb;57(2):131–141. doi: 10.1016/S0895-4356(03)00246-4. [DOI] [PubMed] [Google Scholar]
- 12.Gentleman J F, Tomiak M. The consistency of various high blood pressure indicators based on questionnaire and physical measures data from the Canada Health Survey. Health Rep. 1992;4(3):293–311. [PubMed] [Google Scholar]
- 13.Chan Benjamin T B, Schultz Susan E. Supply and utilization of general practitioner and family physician services in Ontario. ICES Investigative Report. Toronto: Institute for Clinical Evaluative Sciences; 2005. http://www.ices.on.ca/file/FP-GP_aug08_FINAL.pdf. [Google Scholar]