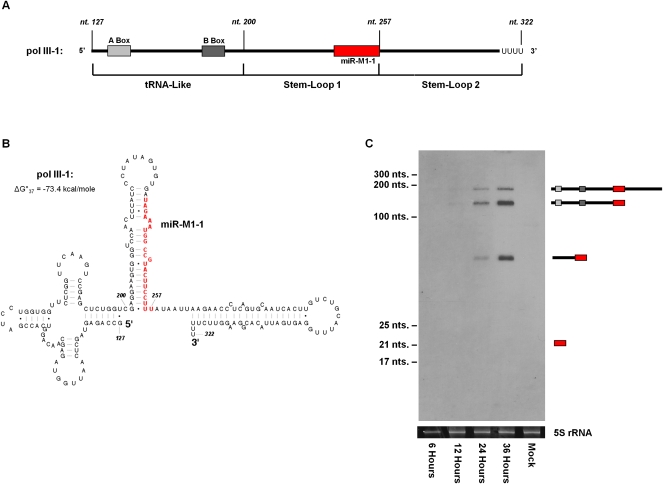
FIGURE 1.
Northern blot analysis of γHV68 pol III-1 during lytic infection. (A) Schematic of the predicted γHV68 pol III-1 transcript. RNA pol III type 2 internal promoter elements are shown as solid gray boxes. γHV68 miRNA miR-M1-1 is represented as a solid red box. γHV68 genomic coordinates are labeled in italics above the gene diagram. (B) Predicted secondary structure of the γHV68 pol III-1 transcript containing the lowest ΔG°37 value using the RNAstructure 4.6 software (Mathews et al. 2004). Nucleotides comprising miR-M1-1 are shown in red. (C) Northern blot of γHV68 pol III-1 from total RNA isolated from infected 3T3 cells collected at 6, 12, 24, and 36 h post infection. γHV68 pol III-1 transcript products are diagrammed to the right of the Northern blot. Ethidium bromide-stained 5S rRNA shown below serves as a loading control.

