Abstract
Group II introns are large ribozymes that act as self-splicing and retrotransposable RNA molecules. They are of great interest because of their potential evolutionary relationship to the eukaryotic spliceosome, their continued influence on the organization of many genomes in bacteria and eukaryotes, and their potential utility as tools for gene therapy and biotechnology. One of the most interesting features of group II introns is their relative lack of nucleobase conservation and covariation, which has long suggested that group II intron structures are stabilized by numerous unusual tertiary interactions and backbone-mediated contacts. Here, we provide a detailed description of the tertiary interaction networks within the Oceanobacillus iheyensis group IIC intron, for which a crystal structure was recently solved to 3.1 Å resolution. The structure can be described as a set of several intricately constructed tertiary interaction nodes, each of which contains a core of extended stacking networks and elaborate motifs. Many of these nodes are surrounded by a web of ribose zippers, which appear to further stabilize local structure. As predicted from biochemical and genetic studies, the group II intron provides a wealth of new information on strategies for RNA folding and tertiary structural organization.
Keywords: group II intron, RNA tertiary structure, ribozyme, X-ray crystallography
INTRODUCTION
Group II introns are self-splicing and retrotransposable RNAs that are found in all forms of bacteria, plants, microeukaryotes, fungi, and in certain types of animals (Lehmann and Schmidt 2003; Lambowitz and Zimmerly 2004; Pyle and Lambowitz 2006; Michel et al. 2009; Toor et al. 2009). Their splicing is essential for gene expression in many organisms (Bonen and Vogel 2001), and during the course of evolutionary history, group II introns have played a major role in the genetic organization of most terrestrial life forms (Mattick 1994, 2001; Rest and Mindell 2003). Although group II introns can be divided into three major families based on phylogenetic analysis of intron secondary structures (IIA, IIB, and IIC) (Michel et al. 1989; Toor et al. 2001; Zimmerly et al. 2001), their three-dimensional organization has long been mysterious because group II introns lack extensive phylogenetic covariation between the major structural elements (domains I–VI), and they contain relatively few conserved nucleotides. Thus, unlike other large RNAs, it has been impossible to infer an approximate architectural arrangement solely from genetic or phylogenetic analyses of the intron sequence and secondary structure.
The first indication that group II introns possessed an unusual tertiary structure came from domain deletion studies conducted on the ai5γ intron from yeast mitochondrial RNA. Those studies showed that the conserved intron domain V (DV) could be added as a separate molecule to intron constructs that lacked this domain and thereby activate them for splicing or other forms of catalysis (Jarrell et al. 1988; Koch et al. 1992; Dib-Hajj et al. 1993; Franzen et al. 1993; Pyle and Green 1994). These results indicated that DV was somehow central to the active tertiary structure, and, given its paired hairpin structure, it necessarily associated with other domains through a complex network of unusual tertiary interactions that involved ribose backbone atoms (Chanfreau and Jacquier 1994; Abramovitz et al. 1996; Boudvillain and Pyle 1998; Konforti et al. 1998), base edges, or other moieties that cannot be probed through conventional genetic analysis.
To forge an understanding of group II intron architectural organization, a number of different biochemical approaches were directed to the problem. A particularly successful approach focused on the identification of tetraloop–receptor interactions (Jaeger et al. 1994; Costa and Michel 1997; Michel et al. 2000), as they are among the most common forms of long-range interaction in folded RNA molecules. In this way, the laboratories of Michel, Westhof, Peebles, and others identified ζ–ζ′ (which joins the tip of the D5 hairpin with a loop in DI) (Costa et al. 2000), ɛ–ɛ′ (Jacquier and Michel 1990), θ–θ′, and η–η′ (Costa et al. 1997), which together with the Watson–Crick (WC) pairing interactions γ–γ′ (Jacquier and Michel 1990) and α–α′ (Michel et al. 1989; Harris-Kerr et al. 1993) provided critical constraints for visualizing intron architecture.
An alternative approach focused on tertiary interactions involving the RNA backbone, as single-atom mutational studies revealed that 2′-hydroxyl groups on D5 and throughout the intron were critical for intron assembly and catalysis (Abramovitz et al. 1996; Boudvillain and Pyle 1998). To identify these contacts and to identify interactions involving base atoms on the Hoogsteen or sugar edges (Boudvillain and Pyle 1998; Konforti et al. 1998), chemogenetic approaches were necessitated. These methods, which involved a combination of site-directed chemical synthesis and in vitro selection (variants include nucleotide analog interference suppression and DMS footprinting suppression) (Boudvillain et al. 2000; Ryder et al. 2000; Fedorova et al. 2005), revealed the κ–κ′ and λ–λ′ interactions that anchor D5 (Boudvillain and Pyle 1998; Boudvillain et al. 2000; de Lencastre et al. 2005), and the μ–μ′ interaction that helps dock DIII in group IIB introns (Fedorova and Pyle 2005). These methods were complemented by site-directed (de Lencastre et al. 2005; Hamill and Pyle 2006; Fedorova and Pyle 2008) and UV cross-linking (Noah and Lambowitz 2003) methods that placed further constraints on the location of the splice sites, interdomain junctions, the branch site and atoms of D5. Taken together, all of these studies resulted in architectural models that were useful for visualizing three-dimensional organization of the intron (Costa et al. 2000; Swisher et al. 2001; Noah and Lambowitz 2003; de Lencastre et al. 2005; Dai et al. 2008), interpreting mechanism and for evaluating the biological significance of future crystal structures.
Despite these efforts, molecular understanding of the intron tertiary structure awaited a crystal structure, as the modeling studies underscored our inability to predict RNA conformation de novo. In addition, mechanistic studies suggested important roles for metal ions and specific D5 functional groups in the chemical mechanism (Sontheimer et al. 1999; Gordon and Piccirilli 2001; Gordon et al. 2007). Their precise arrangement in space required high-resolution analysis. To this end, an appropriate intron crystallization target was sought and the group IIC intron from Oceanobacillus iheyensis (O.i.) was identified as an ideal candidate based on its ability to splice and fold homogeneously under physiological conditions (Toor et al. 2008a). The intron was crystallized, and its structure was solved to 3.1 Å resolution. While many features of this structure have been briefly discussed (Dayie and Padgett 2008; Toor et al. 2008a,b; Michel et al. 2009), a detailed analysis of the constituent tertiary interactions, backbone conformation, and base-pairing arrangements has been lacking. In addition, biochemical analysis of RNA in the crystal has provided new insights into the active-site architecture and its interactions with substrates. Here we present a detailed analysis of the group II intron tertiary structure and its active site, setting the stage for additional mechanistic investigations and confirming the long-standing conviction that group II introns contain a wealth of new information on tertiary interaction motifs and their organization within folded RNA molecules.
RESULTS AND DISCUSSION
Reaction products of O.i. intron self-splicing and autoprocessing
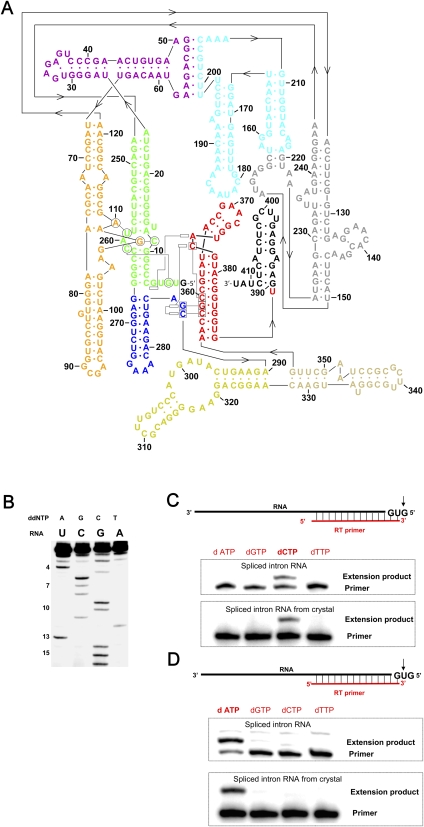
The O.i. intron self-splices through a hydrolytic mechanism in vitro, and like other introns that react through this pathway (Granlund et al. 2001; Vogel and Borner 2002; Toor et al. 2006), the intron is released as a linear molecule (Fig. 1A; Toor et al. 2008a). Because the O.i. intron is derived from a relatively new class of group II introns (IIC) and because it has become a structural model system, it was important to biochemically map the intronic reaction products that are isolated after splicing and after the RNA has crystallized. It was particularly important to understand the chemical identity of the intronic 5′- and 3′-ends because, in the crystal structure, electron density is lacking for the first nucleotide of the intron (at the 5′-end) and for nucleotides corresponding to DVI (at the 3′-end) (Toor et al. 2008a,b). These regions might be simply disordered, as anticipated by studies showing that DVI is dynamic and docks weakly within the core (Dib-Hajj et al. 1993; Chu et al. 1998). Alternatively, the missing residues might have been cleaved away through secondary reactions.
FIGURE 1.
Secondary structure and biochemical analysis of the spliced Oceanobacillus iheyensis intron. (A) Secondary structure of the O. iheyensis intron, shown in the revised representation (Toor et al. 2008a), which includes base-pairing and tertiary interaction designations derived from the refined structure presented here. The “classical view” of the secondary structure can be seen in Toor et al. (2008a), Figure 1A. The different domains and regions of the intron are indicated by color, in the same manner as previously published (Toor et al. 2008a): (green) domains I(i) and I(ii); (purple) domains IA and IB; (orange) domain IC; (gray) domain ID1; (cyan) domain ID2; (blue) domain DII; (yellow) domain DIII; (beige) domain DIV; (red) domain DV; and (black) domain DVI (not visualized in the crystal structure). (B) Reverse-transcriptase (RT) sequencing of the 5′-end of the spliced O. iheyensis intron. Nucleotide positions from the 5′-end are indicated by numbers on the left side of the gel. Identification of the (C) first and (D) second nucleotides from the 5′-end of the spliced O. iheyensis intron (top) before and (bottom) after crystallization. The top and bottom gels in panels C and D exhibit slight differences in relative electrophoretic mobility between the primer and the extension product because the two sets of gels were run for different time periods.
As a first step toward evaluating the intron termini, we used reverse transcription to map the 5′-end of the spliced intron RNA (Fig. 1B). The results show that, while the length of the 5′-end is appropriate, the exact sequence identity for the first and second nucleotides could not be determined. In order to unambiguously identify these nucleotides, we analyzed the spliced RNA before and after crystallization using a modified primer extension approach. A short, 5′-32P-end-labeled primer is annealed to the upstream end of the intron, leaving a small overhang at the intron 5′-end (Fig. 1C, a 1-nucleotide [nt] overhang; Fig. 1D, a 2-nt overhang). Primer extension is then carried out in four reaction mixtures that contain only one dNTP at a time. With this experimental design, the primer is extended by 1 nt only in the reaction mixture that contains a dNTP complementary to the overhang target (Fig. 1C,D). The results show that the 5′-end of the spliced RNA both before and after crystallization contains both G1 and U2 (Fig. 1C,D), establishing that these nucleotides are present within the construct.
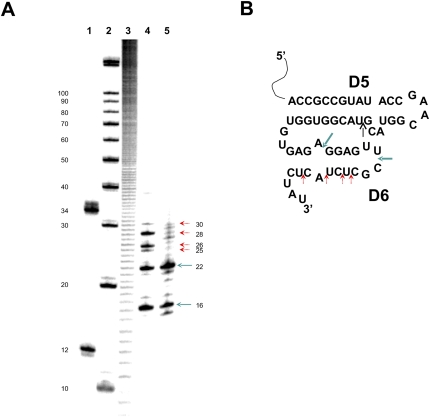
To characterize the 3′-end of the spliced RNA and to evaluate the integrity of DVI, the RNA was mapped before and after crystallization. We first attempted to analyze the downstream terminus by 3′-end labeling of the RNA, followed by T1 nuclease digestion. However, the T1 digestion pattern was unreadable, suggesting that the 3′-end of the RNA both before and after crystallization was highly heterogeneous (data not shown). Using tools for fine-mapping segments of large RNAs (Pyle et al. 2000), we then used a DNAzyme to cleave the 3′-end-labeled RNA between nucleotides 378 and 379 in DV, and we determined the size of the resulting fragments (Fig. 2). Surprisingly, the results indicate that even prior to crystallization, the intron RNA is degraded from the 3′-end and that DVI is cleaved at six major sites (Fig. 2). Further cleavage occurs during crystallization, resulting in a loss of four longer fragments (Fig. 2). These results suggest that DVI is flexible and it can move in and out of the ribozyme active site, each time being cleaved as a substrate by the ribozyme. Notably, group IIC introns splice in vivo via the branching pathway, but in vitro they have only been observed to splice via the hydrolytic pathway (Granlund et al. 2001). This suggests that in vivo the maturase protein helps to correctly position DVI in the active site of the intron, thus preventing its cleavage by the ribozyme.
FIGURE 2.
(A) Analysis of the 3′-terminal fragments obtained after DNAzyme cleavage of the 3′-end-labeled spliced O. iheyensis intron. (Lanes 1,2) RNA size markers; (lane 3) an alkaline hydrolysis ladder; (lanes 4,5) fragments obtained after DNAzyme cleavage of 3′-end-labeled spliced intron before (red and turquoise arrows) and after (turquoise arrows only) crystallization, respectively. Numbers on the left correspond to sequence lengths starting from the 3′-end (see Fig. 1A for nucleotide identities). Numbers on the right indicate the sizes of specific fragments. (In this case, sizes include the terminal C that is incorporated during pCp labeling and are therefore 1 nt longer than the corresponding intron fragment.) Note that turquoise arrows indicate DNAzyme cleavage products formed after Fragment 1 (5′-GGAGUUCGCUCUACUCUAU) or Fragment 2 (5′-CGCUCUACUCUAU) are cleaved off the 3′-terminus of domain VI. (B) Secondary structure schematic of domains V and VI of the spliced O. iheyensis intron. The black arrow denotes the DNAzyme cleavage site in DV. Sites of ribozyme cleavage in DVI observed both before and after crystallization (corresponding to 3′-terminal Fragments 1 and 2, see above) are indicated by bold turquoise arrows, sites observed only before crystallization are indicated by red arrows.
Overall structure
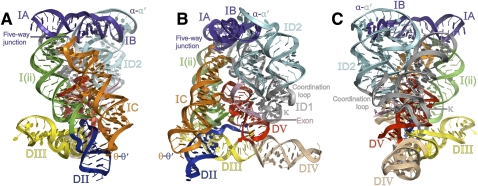
The intron has a boxy shape that appears as if the top and bottom parts of the box have been twisted relative to one another (Fig. 3). The framework and exterior shell of this box is provided primarily by nucleotides derived from intron domain I. Catalytic motifs, such as domain V and J2/3, are internalized within the DI shell, and intron domain III appears to seal them inside, forming the floor of the catalytic center. Peripheral domains II and IV project away from the intron core, and, consistent with their role in encoding large open reading frames, these domains are located at positions that would not interfere with folding of the active site. There is no electron density attributable to a DVI hairpin because intron side reactions excise this highly mobile domain immediately after splicing (Fig. 2).
FIGURE 3.
Overall tertiary structure of the intron in a ribbon representation. Domains and sectors are indicated. (A) View showing the five-way junction and θ–θ′. (B) A 90° rotation from the view shown in A. D5 and the bound exon-like oligonucleotide can be clearly seen. (C) A 90° rotation from the view shown in B displaying the coordination loop, κ, and α–α′.
Domain I: Tertiary architecture of the intron scaffold
Domain I is the largest region of the intron, and, while tertiary interactions between DI and other domains of the intron are essential for building up the active site, tertiary interactions within DI merit detailed analysis because they weld together components of the DI scaffolding and create the framework for subsequent intron assembly (Pyle et al. 2007). The architecture of DI is exceptionally complex, and analysis of its tertiary interaction modules is therefore facilitated by breaking down the domain into defined regions that can be examined in detail.
Four sectors of DI set the stage for the overall architectural organization of the domain, each of which forms a “corner” along the external frame of the intron (Fig. 3). These four corners include: (1) the T-loop sector, which encompasses the elaborate five-way junction; (2) the α–α′ sector that joins distal regions of the DI secondary structure; (3) the θ–θ′ sector that joins the DI scaffold with the base of DII; and (4) the κ-coordination loop region that creates a binding interface with D5 and the splice sites. Two additional regions of DI contain clusters of tertiary interactions that influence the overall shape of DI and create extensive interfaces for the binding and activation of D5. These include: (5) the z-anchor region (Toor et al. 2008a), which joins helices I(ii) and IC, reinforcing their parallel orientation and providing a binding interface for activation of catalytically essential D5 substructures; and (6) the ζ substructure, which stabilizes the receptor for the terminal D5 tetraloop (Keating et al. 2008). Taken together, appropriate assembly of these six regions is critical for orienting key helices within DI and thereby permitting the formation of additional intradomain and interdomain interactions.
The five-way junction
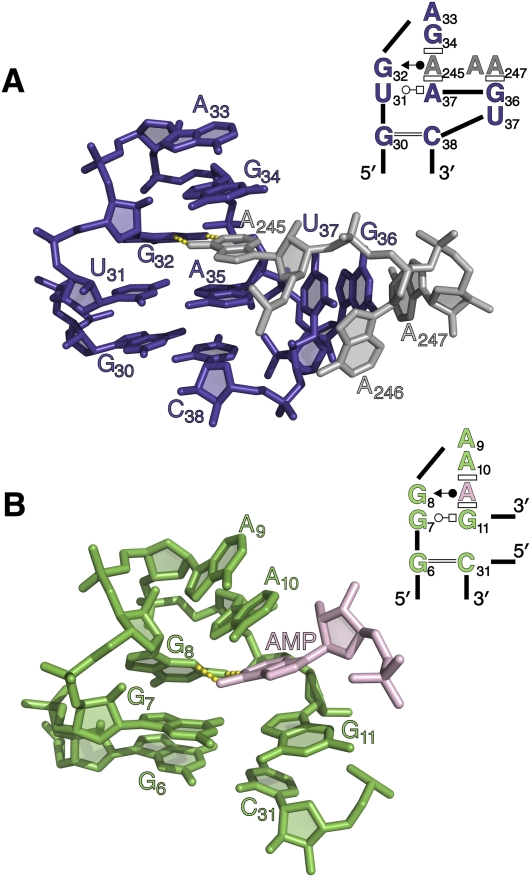
The five-way junction in domain I sets the stage for the overall architectural organization of the intron (Toor et al. 2008a). It orients the relative position of all the long DI helices, making it possible for tertiary interactions to form between the helices and creating a scaffold for docking of D5. The most striking feature of the five-way junction is a T-loop motif (Nagaswamy and Fox 2002; Krasilnikov and Mondragon 2003) comprised of nucleotides U31, G32, A33, G34, A245, and A35 (Fig. 4A), which is a well-characterized substructure that is frequently superimposable with GNRA tetraloop motifs (Supplemental Fig. S1; Lee et al. 2003). T-loops are distinctive because they commonly contain a gap that is filled by intercalation of an adenine from an adjacent strand (A245) (Krasilnikov and Mondragon 2003), rather than an adenine from the same strand at the fourth loop position, as is typical for GNRA loops. Indeed, the DI T-loop is perfectly superimposable with the structure of the ATP binding aptamer (Dieckmann et al. 1996; Jaeger et al. 2009), where AMP is bound at the same position as the intercalated base A245 (Fig. 4B). This finding suggests that co-intercalated RNA motifs are an important tertiary interaction mode and that ATP aptamer motifs specifically are a generalizable mode of adenine recognition in RNA biology.
FIGURE 4.
T-loop architecture can mimic that of a GNRA tetraloop, with an inserted base taking the place of the final nucleotide (GNRA) (Nagaswamy and Fox 2002; Lee et al. 2003). (A) The T-loop in the five-way junction of the group II intron. Base A245 (gray) inserts into the tetraloop-like structure and forms a Hoogsteen edge/WC edge base pair with G32. (B) The binding pocket of the ATP binding aptamer (Dieckmann et al. 1996). AMP is shown forming a Hoogsteen edge/WC edge base pair with G8. In the secondary structure diagrams here and in subsequent figures, base-pairing is indicated using the standardized nomenclature (Leontis and Westhof 2001), and stacking is indicated using rectangles (Adams et al. 2004).
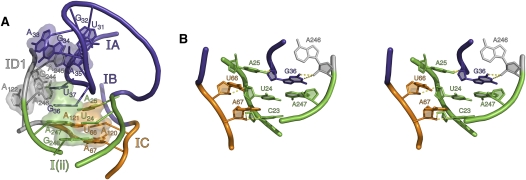
The T-loop is imbedded within a network of stacking interactions that facilitate changes in strand direction and establish the three-dimensional shape of the junction (Fig. 5A). Many of these stacking interactions are reinforced by hydrogen bonds that involve proximal 2′-hydroxyl groups (Fig. 5B). In addition to coaxial stacking of helices IA and IB and the insertion of A245 into the T-loop, major components of the junction stacking network include the following:
G36/A247: T-loop nucleobase G36 stacks on A247, and its relative position is reinforced by hydrogen bonds between the 2′-OH of A246 and the N1 and N2 groups of G36. This stack is relevant because A247 pairs with U24, thereby forming the closing base pair of stem I(ii). The backbones of nucleotides U24 and U66 pinch closely together through the formation of a ribose zipper that joins U66O2′ with U24O2′ and A67O2′ with the O2′ and O2 of C23. This is further reinforced by a type I A-minor motif between A67 and the G248–C23 base pair (Nissen et al. 2001). Together, these interactions influence the trajectory of stems I(ii) and IC, helping to place them side-by-side, in positions that facilitate formation of the z-anchor substructure (vide infra).
A25/U66-A121: Despite its more proximal location to stems IA and I(ii), junction nucleobase A25 stacks on the U66–A121 base pair at the terminus of stem IC. The more proximal stems IA and IB are coaxially stacked, so this spatial translocation by A25 is accompanied by a sharp kink in the backbone between A25 and U26. The relative orientation of A25 appears reinforced by bifurcated hydrogen bonds between N6 and N7 and the 2′-OH of G36. Like the G36–A247 stack, the A25 stack reinforces the parallel orientation of stems IC and I(ii).
A246/A122-G244: By stacking on the terminal pairing of helix IDI (A122–G244), A246 facilitates presentation of A245, and allows it to intercalate into the T-loop. Underscoring the interdependence of all interactions within the junction stacking network, the backbone of A246 orients the nucleobase of G36 (see above). Furthermore, N6 of A246 interacts with the phosphoryl oxygen of C38.
FIGURE 5.
The five-way junction. (A) Networks of nucleobase stacking within the junction are illustrated with transparent space-filling models. The four major stacks are highlighted: (Purple) The T-loop stack, consisting of A33, G34, A245, A35, and C38; (green) the U37/G36/A247/G248 stack; (orange) the A25/U66-A121/A120 stack; and (gray) the A246/A122-G244 stack. (B) The five-way junction is also held together by a number of ribose zipper interactions, shown here in wall-eyed stereo.
The α-loop sector
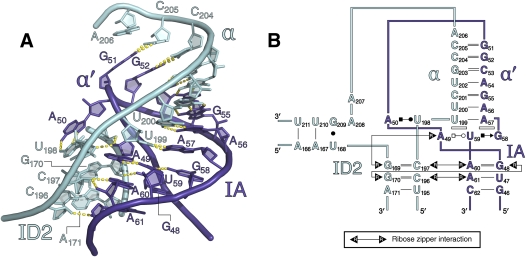
At the center of the α-loop sector is an unusual kissing loop interaction, α–α′ (Fig. 6), that had been predicted from phylogenetic and biochemical studies to join the two major halves of DI through a set of long-range WC interactions (Michel et al. 1989; Harris-Kerr et al. 1993). Although the duplex region of the kissing loop forms a standard A-form helix, the α–α′ interaction differs from kissing loops studied previously because the loop–helix does not simply stack on flanking duplexes. Rather, terminal nucleotides A50 and U198 at either end of each loop flip out, forming a base pair that extends from the back of the loop duplex (Toor et al. 2008a). At this resolution, electron density corresponding to bases in this pairing can be modeled either as a WC or a Hoogsteen edge/WC edge base pair, using the nomenclature of Leontis and Westhof (2001), although the latter corresponds best to the available data. The precise geometry of the A50–U198 pairing may be influenced by the fact that it stacks with A33 of a neighboring molecule. Given that A50–U198 is the site of a crystal contact, the biological relevance of its unusual position within the kissing loop is unclear.
FIGURE 6.
The α-loop sector. (A) Cartoon rendering of the α-loop sector. The α-α′ kissing loop is visualized at the top of the figure, while the ribose zipper network is shown below. (B) Secondary structure diagram.
The stacking of the α–α′ interaction builds on the A49–U59–G58 base triple, which forms immediately below the A-form helix portion of the kissing loop. The α-strand stacks on the A49–U59 pairing, while the α′-strand stacks on the U59–G58 pairing. Additionally, nucleotides 191–206 (which includes the α′-strand) adopt a long, extended structure that appears to wrap smoothly around this corner of DI, encompassing it like a strap (Fig. 3C), very similar to the belt-like region observed in structures of the Azoarchus group I intron (Adams et al. 2004). The orientation of the strap and the α–α′ interaction are reinforced on three sides by a set of ribose zipper motifs (Fig. 6; Cate et al. 1996; Ferré-D'Amaré et al. 1998). Adjacent to α′ is a ribose zipper that joins the 2′-OH of C197 with the 2′-OH and N3 of A60 and the 2′-OH of A61 with the 2′-OH of C196. On the opposite side of the α–α′ duplex is a second ribose zipper that joins the 2′-OH of G48 with the 2′-OH of G170. The 2′-OH of A49 interacts with the 2′-OH of G169, and also with the N3 of the G169. Directly beneath the α–α′ kissing loop lies the ω–ω′ ribose zipper that has already been described (Toor et al. 2008a). This set of interconnected backbone interactions results in a web of interconnected 2′-hydroxyl groups that gathers six strands of RNA together in space.
The θ–θ′ region
The termini of stem IC and domain II are joined by a tetraloop–receptor motif (Fig. 3A), as predicted from previous phylogenetic analyses (Costa et al. 1997). However, this tetraloop–receptor is a highly minimized subtype that is similar to crystal packing interactions observed in early hammerhead ribozyme structures (Pley et al. 1994). In cases such as these, there are no base-stacking interactions between the tetraloop and the receptor. Rather, the tetraloop nucleobases interact exclusively by forming hydrogen bonds with the minor groove of two base pairs in the domain II stem. Indeed, the sugar edges of G92 and A93 of the tetraloop form only single hydrogen bonds to minor-groove base atoms of U273 and G281, respectively, and all other interactions are mediated by 2′-hydroxyl groups (A93N3 → G281N2, A93N1 → G281O2′, A92O2′ → C272O2′, G92N2 → U273O2, G92N3 → U273O2′, and G92O2′ → U273O2′). Additional interactions are observed between A282O2′ and C94O2′ and between C91O2 and the G274O2′.
The coordination/κ-loop region
The 5′ and 3′ exons of group II introns are brought together and recognized by a continuous binding interface that is provided by the EBS1/EBS3 substructure (Jacquier and Michel 1987; Costa et al. 2000; Toor et al. 2008b). The extended stacking array presented by EBS1/EBS3 interacts with the exon sequences through base-pairing, resulting in a duplex that presents the target phosphodiester linkage to the active-site bulge region of DV (Toor et al. 2008b).
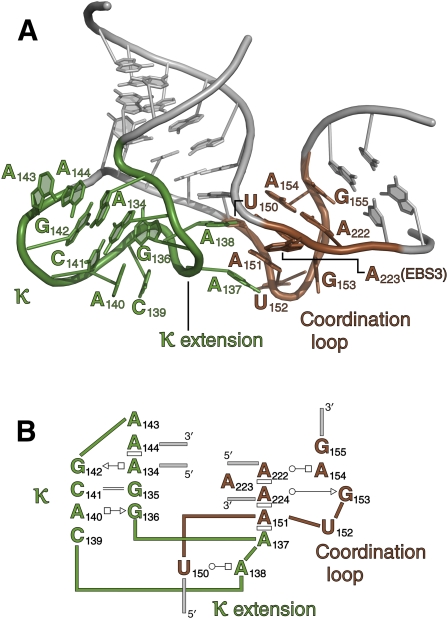
In group IIC introns, EBS3 is provided by a single nucleobase (A223) that is flipped out of the “coordination loop” (Fig. 7), which is a DI substructure that was previously shown to “coordinate” and spatially organize all reactants involved in both steps of group II intron self-splicing (Costa et al. 2000; Hamill and Pyle 2006). With improved refinement and modeling, it is now possible to visualize the detailed organization of the coordination loop and to understand how it is stabilized by EBS1 and by the adjacent κ substructure in DI (Boudvillain and Pyle 1998).
FIGURE 7.
The coordination/κ loop region. Note that κ and the coordination loop are colored differently here than in other figures. (A) Cartoon rendering of this sector. (B) Secondary structure diagram, using symbolic conventions as described in Figure 4.
Base pairs within the coordination loop are stacked on the upper IDI stem. The terminal G156–U221 wobble pair of the stem stacks on the G155–C180 WC base pair, thereby enabling the EBS1 loop to intercalate into the coordination loop through C180. G155–C180 then stacks on the A154–A222 Hoogsteen edge/WC edge pair, which stacks on A224, thereby ejecting A223 (EBS3) from the substructure. At this point in the structure, the strand containing G153–A151 adopts a sharp kink, resulting in an ∼90° angle between upper and lower parts of the IDI stem. Nucleobases U152 and A151 then splay out, facilitating contacts with the neighboring κ extension. Of particular importance are the stacking interactions that occur between A151 → A137, A225 → A138, and the base pair between U150 and A138. These interactions merge the coordination loop with the κ-extension, rigidifying them and creating a single interface for splice site and D5 recognition.
Where the κ region pinches off from the IDI stem, the strand backbones come very close together. The phosphates at positions 145 and 134 are only 5.4 Å apart, and nonbridging phosphoryl oxygens at these locations are 3.4 Å apart. From this narrow neck at its base, the backbone of the κ region balloons into a highly unusual two-lobed substructure. One lobe (termed the κ-extension) interacts with the coordination loop as described above. The sequence at this position, and its relative conservation, have suggested that the κ-extension might adopt a GNRA-like structure, although this was contraindicated by chemogenetic and mutational studies on this region of DI (Boudvillain and Pyle 1998). The structure reveals that the κ-extension possesses some GNRA-like characteristics, such as the sugar edge/Hoogsteen edge base pair between G136 and A140, which is identical to the G–A base-pairing in GNRA tetraloops. Additionally, C139 stacks on A140, as is reminiscent of the stacking of the third tetraloop nucleotide. However, A137 and A138 are flipped out and adopt a conformation that is distinctly different from that of a GNRA tetraloop.
The large lobe of κ forms a binding interface with the noncatalytic face of DV (Boudvillain and Pyle 1998). The shape of the κ region is reinforced by a set of base-pairings that span both lobes of the substructure, including A134–G142 (Hoogsteen edge/sugar edge), G135–C141 (WC), and G136–A140 (sugar edge/Hoogsteen edge). In addition, a continuous stack of bases involving 136 → 135 → 134 → 144 → 143 rigidifies the motif.
Domain III: An interaction hub for joining multiple domains
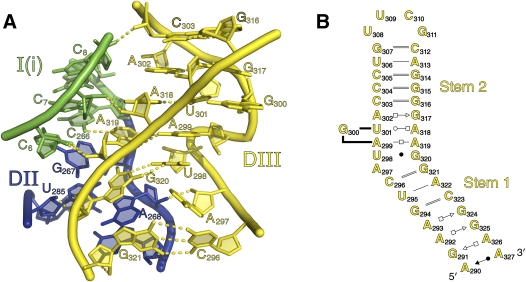
The stems and internal loop of DIII (Fig. 8B) play a key role in organizing structural and catalytic regions of the intron. Stem 1 is an unusual duplex with a wide major groove that is composed almost exclusively of purine–purine pairs, including the Hoogsteen edge/sugar edge pairs A326–G291, A292–G325, and A293–G324, and the sugar edge/WC edge pair A290–A327. Stem 1 forms the “floor” of the intron structure, where it supports the orientation of D5 within the DI cavity and inserts nucleotides of the J2/3 linker into the D5 major groove, thereby forming the catalytic triplex region of the active site (Toor et al. 2008a).
FIGURE 8.
Domain III. (A) Cartoon rendering of the internal loop and S-turn of DIII. Hydrogen bonds to domains 1 and 2 and those within DIII are shown. The strands are color-coded by secondary structural subdomain, as shown in Figure 1A. (B) Secondary structure diagram of DIII. Note that G300 is shown as a bulged nucleotide.
All group II introns contain a large internal loop that is adjacent to stem 1 of DIII (Toor et al. 2001). Multiple biochemical studies have underscored its importance for catalysis (Podar et al. 1995; Jestin et al. 1997; Fedorova and Pyle 2005, 2008); however, its role in intron function has only become fully understood upon inspection of the crystal structure. The substructure created by the DIII loop, comprised of nucleotides 297–302 and nucleotides 317–320, provides an interaction node that joins DIII with the stems of DI and DII, thereby orienting three critical domains of the intron (Fig. 8A).
The most prominent feature of this region is the presentation of G320, which stacks on A268 near the terminus of the DII stem. This arrangement is accommodated by an S-turn (Leontis and Westhof 1998) on the opposite strand of the DIII loop (nucleotides 298–300). The existence of an S-turn at this position was previously predicted from phylogenetic analysis of group IIA introns (Leontis and Westhof 1998). As predicted in that work, the lower portion of the S-turn contains a purine and a uracil on one strand (here, A297 and U298), while only containing a single G in the equivalent position on the other strand (here, G320). In this structure, U298 forms a wobble pair with G320, while the nucleobase of A297 does not participate in any hydrogen-bonding interactions. However, A297 is not pushed out of the helix and instead disrupts base-stacking between the U298–G320 pair and the C296–G321 pair. This allows DIII to bend by roughly 30° between these two pairs, and positions the internal bulge appropriately for interactions with domains 1 and 2. Additional interactions, including hydrogen bonds between G321O2′ → G269N2, A297O2′ → A268O2′, G320O2′ → U285O2′, and G320O2′ → U285O2 appear to further stabilize the interface between DII and DIII.
The DIII loop and stem 1 of DI are joined through a network of minor groove triples and ribose zippers. For example, A319 interacts with the minor-groove edge of the G266–C6 pair at the base of DI, forming an architecturally important base triple interaction. This is reinforced by an array of adjacent ribose zippers that connect the 2′-hydroxyl groups of nucleotides C6, C7, and C8 (at the bottom of the DI stem) with the 2′-hydroxyl groups of A318, A319, and C303 in the DIII loop. Interaction of the DIII loop with the beginning of DI has been proposed for group IIB introns as well (Fedorova and Pyle 2008), suggesting that it may have a similar function in all group II introns.
Domain V and its tertiary interactions within the core
Previous analysis of the group II intron structure has focused on interactions between D5 and the rest of the intron (Toor et al. 2008a,b, 2009). As a result, many of the major tertiary interactions, such as the catalytic triplex, interactions between the D5 bulge and the Z-anchor, and the unusual tetraloop–receptor interaction within ζ–ζ′, have already been evaluated in detail. However, one of the most important interactions between D5 and DI is the κ–κ′ interaction, which has been extensively studied using chemogenetic methodologies (Boudvillain and Pyle 1998). Particularly after additional modeling and refinement (see Materials and Methods), the crystal structure provides valuable insights into the binding interface between D5 and the κ-loop of DI, and it is important to evaluate these in detail.
The interaction interface between κ and D5 is composed exclusively of base–backbone and inter-backbone interactions, the most prominent of which is a hydrogen bond between G359N2 and G135O2′ that was predicted from previous single-atom mutagenesis studies (Konforti et al. 1998). Additional interactions include G385O2′ → A140N1, C361O2′ → A143N1, G385O2P → C141O2′, and C360O2′ → A134O2′, which are in excellent agreement with single-atom mutagenesis and chemogenetic studies that demonstrated the importance of the D5 backbone for molecular recognition and led to the original prediction of the κ interaction (Abramovitz et al. 1996; Boudvillain and Pyle 1998; Konforti et al. 1998). The close agreement with those studies, which were conducted on a completely different intron family (the ai5γ group IIB intron), underscores the likelihood that all group II introns have a very similar core structure.
It is intriguing that there are no base–base interactions between κ and D5, as previous biochemical studies had hypothesized the κ interaction to be a tetraloop–receptor interaction (Boudvillain and Pyle 1998). Instead, the interaction interface consists exclusively of backbone-mediated hydrogen-bonding interactions. The absence of inter-base interactions may be attributable to the lack of complementarity in base-plane orientation between the two domains (e.g., nucleobases within the two motifs are not coplanar, thereby precluding stacks, triples, or quadriplexes). The base planes in κ are twisted by ∼70° from those in D5. Thus, despite a pronounced shape complementarity, the interaction interface is highly unusual, and the basis for its thermodynamic stabilization remains unclear.
A few additional tertiary interactions between D5 and DI have not yet been described. For example, we observe that EBS1 forms a set of tertiary interactions with the terminal tetraloop of D5. Specifically, the A183O2′ group at the center of EBS1 makes hydrogen bonds to C372O2 and G369N2, thereby establishing that EBS1 plays a core structural role in addition to its function as an exon recognition element (Jacquier and Michel 1987). In addition, we observe an interesting pairing that joins the I(i) loop with the highly conserved G378–U365 pair beneath the D5 bulge. Nucleotides G378 and A260 participate in a sugar edge/Hoogsteen edge interaction, which explains the notable conservation of G378 (Costa et al. 1998; Konforti et al. 1998), and biochemical studies implicating the I(i) loop in intron function (Boudvillain and Pyle 1998; Costa et al. 1998).
The bound oligonucleotide target fragment
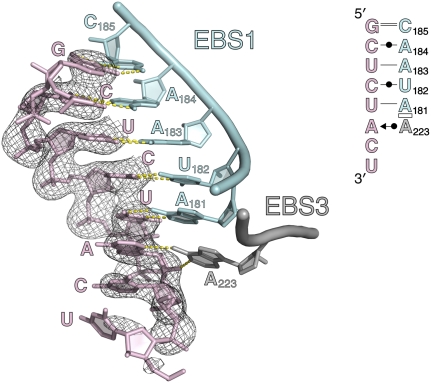
As reported previously, the map for the free intron displays electron density corresponding to an oligonucleotide that is bound to the EBS1 and EBS3 sequences at the same position anticipated for ligated exons (Toor et al. 2008b). While electron density for the resultant EBS/exon duplex and for the coordination loop becomes stronger when the intron is co-crystallized with a short oligonucleotide corresponding to ligated exons (Toor et al. 2008b), it is still prominent even without co-crystallization and had therefore been a puzzling aspect of the crystal structure. The likely identity of this oligonucleotide finally became apparent through two different lines of evidence. First of all, 3′-end mapping of spliced RNA and RNA in the crystal (see Fig. 2 and the section on “Reaction products of O.i. intron self-splicing and autoprocessing”) shows that, after splicing, the dynamic DVI region (which can form semi-complementary interactions with the EBS regions) is cleaved at several positions by the ribozyme. The most abundant intron truncation (Fig. 2B) results from release of oligonucleotide 5′-CGCUCUACUCUAU-3′ (fragment 2), which is partially complementary to EBS1 via the underlined nucleotides. This fragment accumulates after crystallization (see Fig. 2A) and would therefore not have been washed completely away during RNA purification.
A second clue came from electron density in the crystal itself. Weak electron density was consistently observed for bases upstream of nucleotides that pair directly with EBS1, and trailing downstream from the expected cleavage site. Upon close inspection, it was possible to visualize a guanosine extending from the 5′-end of the oligonucleotide fragment. In addition, we previously reported that the first pairing between EBS3 and the oligonucleotide fragment cannot adequately be modeled as a WC pair, and that it is best modeled as a sheared pair (Toor et al. 2008b). Both of these observations are explained if one creates a model in which fragment 2 is paired with EBS1 and EBS3 (sufficient electron density was available to model nucleotides 5′pGCUCU↓ACUp, where the arrow represents the expected target cleavage site). In that case (Fig. 9), fragment 2 pairs with EBS1, but the resultant duplex is capped by a guanosine at the immediate 5′-end, with additional weak density for trailing upstream nucleotides. Binding of fragment 2 places an adenosine opposite the adenosine in EBS3, resulting in a sugar edge/WC edge base pair. This is followed by weak density for additional nucleotides projecting from the 3′-end. Thus, while the binding of other fragments is clearly possible, binding of fragment 2 results in the best fit of the density for oligonucleotide bound to free intron.
FIGURE 9.
Exon binding to the intron. A cartoon rendering of EBS1 and EBS3 is shown, with the bound oligonucleotide target fragment displayed in pink. A 2FO − FC electron density map is shown for the oligonucleotide and is contoured at 1.0σ. (Inset) A secondary structural diagram of the anticipated oligonucleotide binding mode.
Binding of fragment 2 may also answer an important question about RNA reactivity in the crystal: Why does the oligonucleotide remain intact and uncleaved by the ribozyme active site? The answer to this may lie with the sheared configuration of the pairing at EBS3. The sheared pairing induces deviation from the backbone configuration that is normally recognized and cleaved by group II introns, which recognize exon boundaries through WC base-pairings (Su et al. 2001; Pyle and Lambowitz 2006). This suggests that fragment 2 has inadvertently provided an active-site inhibitor complex that enables us to visualize bound substrates in an uncleaved, but potentially chemically relevant conformation.
Conclusions
A detailed analysis of the group II intron tertiary structure reveals that the shape of the molecule is dictated by a set of elaborate tertiary interaction networks within domains I and III. These regions create the scaffold that binds and activates catalytic domain V. The individual interaction networks contain both known and novel motifs, although tertiary substructures are dominated by base-stacking and 2′-hydroxyl group contacts. The preponderance of hydrophobic and RNA backbone interactions may explain the relatively low sequence conservation among group II introns.
MATERIALS AND METHODS
Analysis of the 3′- and 5′-ends of the spliced RNA
Sequence of the 5′-end of the RNA was verified by reverse transcription in the presence of dideoxynucleotide triphosphates using primer Oi20 (5′-CGGGACTCTCACCCTATAGAC) (Invitrogen) and RT AMV (Roche) as previously described (Waldsich et al. 2002). In order to determine the identity of the first and second nucleotides from the 5′-end of the RNA, the RNA was reverse-transcribed in the presence of only one of the four dNTPs at a time using primers Oi2 (5′-CCATGCCGGGCACA) and Oi3 (5′-CCCATGCCGGGCAC), respectively. The 3′-terminal nucleotides of these primers were complementary to the second and third nucleotides of the 5′-end of the spliced RNA, respectively. The samples were analyzed on a 20% denaturing gel.
In order to identify the 3′-end of the spliced RNA before and after crystallization, the RNA was 3′-end-labeled using pCp and T4 RNA ligase as described (England and Uhlenbeck 1978). The 3′-end-labeled RNA was then cleaved by the DNAzyme OiD5 (5′-CACCACCGTAGGCTAGCTACAACGAGTACCGTTCGGT) between nucleotides G378 and U379 as previously described (Pyle et al. 2000). Cleavage products were analyzed on a 20% gel next to alkaline hydrolysis ladder and Decade RNA size marker (Ambion).
Modeling and refinement
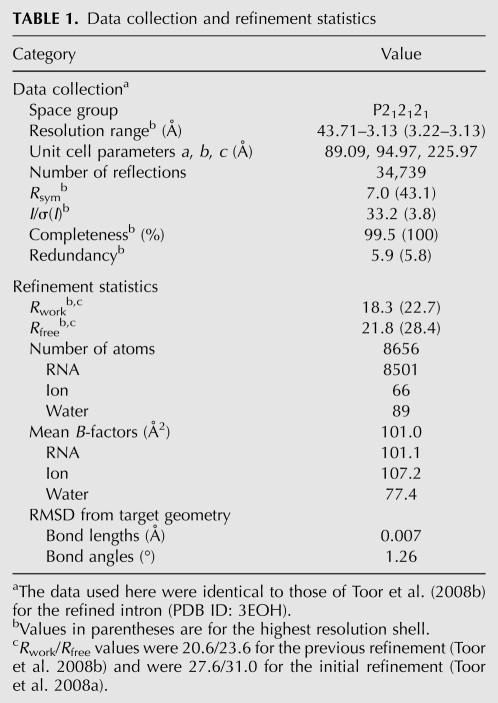
Model building and refinement were carried out to further improve the structure published in Toor et al. (2008b) (pdb code 3EOH) (see Table 1). Model building was done using Coot (Emsley and Cowtan 2004), and the following changes were made: nucleotides U2, C216, A217, and G307–G3111 were added; bases for nucleotides G83, A143, U152, A207, and A287 were added; the bases of A50, A110, G160, G179, and A268 were rotated, altering the base-pairing configuration of these nucleotides; base planes in κ, the coordination loop, and in domain III were adjusted; sugar puckers for a number of nucleotides were adjusted, as guided by MolProbity (Davis et al. 2007); and the sequence of the existing exon-like fragment nucleotides was modified to match the domain VI fragment.
TABLE 1.
Data collection and refinement statistics
Refinement was then carried out using CNS version 1.2.1 (Brunger et al. 1998; Brunger 2007) and Phenix nightly build version 1.4-70 (Adams et al. 2002). This version of Phenix corrects a number of algorithmic issues related to sugar pucker that were present in earlier versions. During refinement, runs of simulated annealing were carried out in Phenix, while structure minimization was done using CNS, as CNS allows for manually entered base-pairing and sugar pucker constraints. Final runs of B factor and TLS minimization were carried out with Phenix using a single TLS group for the entire model.
To test the effect of TLS on the refinement, an additional refinement run was conducted using Phenix with TLS disabled. This resulted in Rwork and Rfree values of 19.6 and 22.5, which are roughly one percentage point higher than the values received with TLS refinement (18.3 and 21.8).
Data deposition
The coordinates and structure factors have been deposited in the Protein Data Bank with accession code 3IGI.
SUPPLEMENTAL MATERIAL
Supplemental material can be found at http://www.rnajournal.org.
ACKNOWLEDGMENTS
We thank Scott Strobel for many valuable discussions, and we are grateful for generous support from the National Institutes of Health (GM50313) and the Howard Hughes Medical Institute. A.M.P. is an Investigator, O.F. is a Research Scientist, and N.T. was a Research Associate of the Howard Hughes Medical Institute. This work is based upon research conducted at the Northeastern Collaborative Access Team beamlines of the Advanced Photon Source, supported by award RR-15301 from the National Center for Research Resources at the National Institutes of Health. Use of the Advanced Photon Source is supported by the U.S. Department of Energy, Office of Basic Energy Sciences, under Contract No. DE-AC02–06CH11357.
Footnotes
Article published online ahead of print. Article and publication date are at http://www.rnajournal.org/cgi/doi/10.1261/rna.1844010.
REFERENCES
- Abramovitz DL, Friedman RA, Pyle AM. Catalytic role of 2′-hydroxyl groups within a group II intron active site. Science. 1996;271:1410–1413. doi: 10.1126/science.271.5254.1410. [DOI] [PubMed] [Google Scholar]
- Adams PD, Grosse-Kunstleve RW, Hung LW, Ioerger TR, McCoy AJ, Moriarty NW, Read RJ, Sacchettini JC, Sauter NK, Terwilliger TC. PHENIX: Building new software for automated crystallographic structure determination. Acta Crystallogr D Biol Crystallogr. 2002;58:1948–1954. doi: 10.1107/s0907444902016657. [DOI] [PubMed] [Google Scholar]
- Adams PL, Stahley MR, Kosek AB, Wang J, Strobel SA. Crystal structure of a self-splicing group I intron with both exons. Nature. 2004;430:45–50. doi: 10.1038/nature02642. [DOI] [PubMed] [Google Scholar]
- Bonen L, Vogel J. The ins and outs of group II introns. Trends Genet. 2001;17:322–331. doi: 10.1016/s0168-9525(01)02324-1. [DOI] [PubMed] [Google Scholar]
- Boudvillain M, Pyle AM. Defining functional groups, core structural features and inter-domain tertiary contacts essential for group II intron self-splicing: A NAIM analysis. EMBO J. 1998;17:7091–7104. doi: 10.1093/emboj/17.23.7091. [DOI] [PMC free article] [PubMed] [Google Scholar]
- Boudvillain M, de Lencastre A, Pyle AM. A new RNA tertiary interaction that links active-site domains of a group II intron and anchors them at the site of catalysis. Nature. 2000;406:315–318. doi: 10.1038/35018589. [DOI] [PubMed] [Google Scholar]
- Brunger AT. Version 1.2 of the crystallography and NMR system. Nat Protoc. 2007;2:2728–2733. doi: 10.1038/nprot.2007.406. [DOI] [PubMed] [Google Scholar]
- Brunger AT, Adams PD, Clore GM, DeLano WL, Gros P, Grosse-Kunstleve RW, Jiang JS, Kuszewski J, Nilges M, Pannu NS, et al. Crystallography & NMR system: A new software suite for macromolecular structure determination. Acta Crystallogr D Biol Crystallogr. 1998;54:905–921. doi: 10.1107/s0907444998003254. [DOI] [PubMed] [Google Scholar]
- Cate JH, Gooding AR, Podell E, Zhou K, Golden BL, Kundrot CE, Cech TR, Doudna JA. Crystal structure of a group I ribozyme domain: Principles of RNA packing. Science. 1996;273:1678–1685. doi: 10.1126/science.273.5282.1678. [DOI] [PubMed] [Google Scholar]
- Chanfreau G, Jacquier A. Catalytic site components common to both splicing steps of a group II intron. Science. 1994;266:1383–1387. doi: 10.1126/science.7973729. [DOI] [PubMed] [Google Scholar]
- Chu V-T, Liu Q, Podar M, Perlman PS, Pyle AM. More than one way to splice an RNA: Branching without a bulge and splicing without branching in group II introns. RNA. 1998;4:1186–1202. doi: 10.1017/s1355838298980724. [DOI] [PMC free article] [PubMed] [Google Scholar]
- Costa M, Michel F. Rules for RNA recognition of GNRA tetraloops deduced by in vitro selection: Comparison with in vivo evolution. EMBO J. 1997;16:3289–3302. doi: 10.1093/emboj/16.11.3289. [DOI] [PMC free article] [PubMed] [Google Scholar]
- Costa M, Deme E, Jacquier A, Michel F. Multiple tertiary interactions involving domain II of group II self- splicing introns. J Mol Biol. 1997;267:520–536. doi: 10.1006/jmbi.1996.0882. [DOI] [PubMed] [Google Scholar]
- Costa M, Christian EL, Michel F. Differential chemical probing of a group II self-splicing intron identifies bases involved in tertiary interactions and supports an alternative secondary structure model of domain V. RNA. 1998;4:1055–1068. doi: 10.1017/s1355838298980670. [DOI] [PMC free article] [PubMed] [Google Scholar]
- Costa M, Michel F, Westhof E. A three-dimensional perspective on exon binding by a group II self-splicing intron. EMBO J. 2000;19:5007–5018. doi: 10.1093/emboj/19.18.5007. [DOI] [PMC free article] [PubMed] [Google Scholar]
- Dai L, Chai D, Gu SQ, Gabel J, Noskov SY, Blocker FJ, Lambowitz AM, Zimmerly S. A three-dimensional model of a group II intron RNA and its interaction with the intron-encoded reverse transcriptase. Mol Cell. 2008;30:472–485. doi: 10.1016/j.molcel.2008.04.001. [DOI] [PMC free article] [PubMed] [Google Scholar]
- Davis IW, Leaver-Fay A, Chen VB, Block JN, Kapral GJ, Wang X, Murray LW, Arendall WB, III, Snoeyink J, Richardson JS, et al. MolProbity: All-atom contacts and structure validation for proteins and nucleic acids. Nucleic Acids Res. 2007;35:W375–W383. doi: 10.1093/nar/gkm216. [DOI] [PMC free article] [PubMed] [Google Scholar]
- Dayie KT, Padgett RA. A glimpse into the active site of a group II intron and maybe the spliceosome, too. RNA. 2008;14:1697–1703. doi: 10.1261/rna.1154408. [DOI] [PMC free article] [PubMed] [Google Scholar]
- de Lencastre A, Hamill S, Pyle AM. A single active-site region for a group II intron. Nat Struct Mol Biol. 2005;12:626–627. doi: 10.1038/nsmb957. [DOI] [PubMed] [Google Scholar]
- Dib-Hajj SD, Boulanger SC, Hebbar SK, Peebles CL, Franzen JS, Perlman PS. Domain 5 interacts with domain 6 and influences the second transesterification reaction of group II intron self-splicing. Nucleic Acids Res. 1993;21:1797–1804. doi: 10.1093/nar/21.8.1797. [DOI] [PMC free article] [PubMed] [Google Scholar]
- Dieckmann T, Suzuki E, Nakamura GK, Feigon J. Solution structure of an ATP-binding RNA aptamer reveals a novel fold. RNA. 1996;2:628–640. [PMC free article] [PubMed] [Google Scholar]
- Emsley P, Cowtan K. Coot: Model-building tools for molecular graphics. Acta Crystallogr D Biol Crystallogr. 2004;60:2126–2132. doi: 10.1107/S0907444904019158. [DOI] [PubMed] [Google Scholar]
- England TE, Uhlenbeck OC. 3′-Terminal labelling of RNA with T4 RNA ligase. Nature. 1978;275:560–561. doi: 10.1038/275560a0. [DOI] [PubMed] [Google Scholar]
- Fedorova O, Pyle AM. Linking the group II intron catalytic domains: Tertiary contacts and structural features of domain 3. EMBO J. 2005;24:3906–3916. doi: 10.1038/sj.emboj.7600852. [DOI] [PMC free article] [PubMed] [Google Scholar]
- Fedorova O, Pyle AM. A conserved element that stabilizes the group II intron active site. RNA. 2008;14:1048–1056. doi: 10.1261/rna.942308. [DOI] [PMC free article] [PubMed] [Google Scholar]
- Fedorova O, Boudvillain M, Kawaoka J, Pyle AM. Nucleotide analog interference mapping and suppression: specific applications in studies of RNA tertiary structure, dynamic helicase mechanism and RNA–protein interactions. Wiley-VCH; Weinheim: 2005. [Google Scholar]
- Ferré-D'Amaré AR, Zhou K, Doudna JA. Crystal structure of a hepatitis delta virus ribozyme. Nature. 1998;395:567–574. doi: 10.1038/26912. [DOI] [PubMed] [Google Scholar]
- Franzen JS, Zhang M, Peebles CL. Kinetic analysis of the 5′-splice junction hydrolysis of a group II intron promoted by domain 5. Nucleic Acids Res. 1993;21:627–634. doi: 10.1093/nar/21.3.627. [DOI] [PMC free article] [PubMed] [Google Scholar]
- Gordon PM, Piccirilli JA. Metal ion coordination by the AGC triad in domain 5 contributes to group II intron catalysis. Nat Struct Biol. 2001;8:893–898. doi: 10.1038/nsb1001-893. [DOI] [PubMed] [Google Scholar]
- Gordon PM, Fong R, Piccirilli JA. A second divalent metal ion in the group II intron reaction center. Chem Biol. 2007;14:607–612. doi: 10.1016/j.chembiol.2007.05.008. [DOI] [PubMed] [Google Scholar]
- Granlund M, Michel F, Norgren M. Mutually exclusive distribution of IS1548 and GBSi1, an active group II intron identified in human isolates of group B streptococci. J Bacteriol. 2001;183:2560–2569. doi: 10.1128/JB.183.8.2560-2569.2001. [DOI] [PMC free article] [PubMed] [Google Scholar]
- Hamill S, Pyle AM. The receptor for branch-site docking within a group II intron active site. Mol Cell. 2006;23:831–840. doi: 10.1016/j.molcel.2006.07.017. [DOI] [PubMed] [Google Scholar]
- Harris-Kerr CL, Zhang M, Peebles CL. The phylogenetically predicted base-pairing interaction between α and α′ is required for group II splicing in vitro. Proc Natl Acad Sci. 1993;90:10658–10662. doi: 10.1073/pnas.90.22.10658. [DOI] [PMC free article] [PubMed] [Google Scholar]
- Jacquier A, Michel F. Multiple exon-binding sites in class II self-splicing introns. Cell. 1987;50:17–29. doi: 10.1016/0092-8674(87)90658-1. [DOI] [PubMed] [Google Scholar]
- Jacquier A, Michel F. Base-pairing interactions involving the 5′ and 3′-terminal nucleotides of group II self-splicing introns. J Mol Biol. 1990;213:437–447. doi: 10.1016/S0022-2836(05)80206-2. [DOI] [PubMed] [Google Scholar]
- Jaeger L, Michel F, Westhof E. Involvement of a GNRA tetraloop in long-range RNA tertiary interactions. J Mol Biol. 1994;236:1271–1276. doi: 10.1016/0022-2836(94)90055-8. [DOI] [PubMed] [Google Scholar]
- Jaeger L, Verzemnieks EJ, Geary C. The UA_handle: A versatile submotif in stable RNA architectures. Nucleic Acids Res. 2009;37:215–230. doi: 10.1093/nar/gkn911. [DOI] [PMC free article] [PubMed] [Google Scholar]
- Jarrell K, Dietrich R, Perlman P. Group II Intron domain 5 facilitates a trans-splicing reaction. Mol Cell Biol. 1988;8:2361–2366. doi: 10.1128/mcb.8.6.2361. [DOI] [PMC free article] [PubMed] [Google Scholar]
- Jestin J-L, Deme E, Jacquier A. Identification of structural elements critical for inter-domain interactions in a group II self-splicing intron. EMBO. 1997;16:2945–2954. doi: 10.1093/emboj/16.10.2945. [DOI] [PMC free article] [PubMed] [Google Scholar]
- Keating KS, Toor N, Pyle AM. The GANC tetraloop: A novel motif in the group IIC intron structure. J Mol Biol. 2008;383:475–481. doi: 10.1016/j.jmb.2008.08.043. [DOI] [PMC free article] [PubMed] [Google Scholar]
- Koch JL, Boulanger SC, Dib-Hajj SD, Hebbar SK, Perlman PS. Group II Introns deleted for multiple substructures retain self-splicing activity. Mol Cell Biol. 1992;12:1950–1958. doi: 10.1128/mcb.12.5.1950. [DOI] [PMC free article] [PubMed] [Google Scholar]
- Konforti BB, Abramovitz DL, Duarte CM, Karpeisky A, Beigelman L, Pyle AM. Ribozyme catalysis from the major groove of group II intron domain 5. Mol Cell. 1998;1:433–441. doi: 10.1016/s1097-2765(00)80043-x. [DOI] [PubMed] [Google Scholar]
- Krasilnikov AS, Mondragon A. On the occurrence of the T-loop RNA folding motif in large RNA molecules. RNA. 2003;9:640–643. doi: 10.1261/rna.2202703. [DOI] [PMC free article] [PubMed] [Google Scholar]
- Lambowitz AM, Zimmerly S. Mobile group II introns. Annu Rev Genet. 2004;38:1–35. doi: 10.1146/annurev.genet.38.072902.091600. [DOI] [PubMed] [Google Scholar]
- Lee JC, Cannone JJ, Gutell RR. The lonepair triloop: A new motif in RNA structure. J Mol Biol. 2003;325:65–83. doi: 10.1016/s0022-2836(02)01106-3. [DOI] [PubMed] [Google Scholar]
- Lehmann K, Schmidt U. Group II introns: Structure and catalytic versatility of large natural ribozymes. Crit Rev Biochem Mol Biol. 2003;38:249–303. doi: 10.1080/713609236. [DOI] [PubMed] [Google Scholar]
- Leontis NB, Westhof E. A common motif organizes the structure of multi-helix loops in 16 S and 23 S ribosomal RNAs. J Mol Biol. 1998;283:571–583. doi: 10.1006/jmbi.1998.2106. [DOI] [PubMed] [Google Scholar]
- Leontis NB, Westhof E. Geometric nomenclature and classification of RNA base pairs. RNA. 2001;7:499–512. doi: 10.1017/s1355838201002515. [DOI] [PMC free article] [PubMed] [Google Scholar]
- Mattick JS. Introns: Evolution and function. Curr Opin Genet Dev. 1994;4:823–831. doi: 10.1016/0959-437x(94)90066-3. [DOI] [PubMed] [Google Scholar]
- Mattick JS. Noncoding RNAs: The architects of eukaryotic complexity. EMBO Rep. 2001;2:986–991. doi: 10.1093/embo-reports/kve230. [DOI] [PMC free article] [PubMed] [Google Scholar]
- Michel F, Umesono K, Ozeki H. Comparative and functional anatomy of group II catalytic introns—A review. Gene. 1989;82:5–30. doi: 10.1016/0378-1119(89)90026-7. [DOI] [PubMed] [Google Scholar]
- Michel F, Costa M, Massire C, Westhof E. Modeling RNA tertiary structure from patterns of sequence variation. Methods Enzymol. 2000;317:491–510. doi: 10.1016/s0076-6879(00)17031-4. [DOI] [PubMed] [Google Scholar]
- Michel F, Costa M, Westhof E. The ribozyme core of group II introns: A structure in want of partners. Trends Biochem Sci. 2009;34:189–199. doi: 10.1016/j.tibs.2008.12.007. [DOI] [PubMed] [Google Scholar]
- Nagaswamy U, Fox GE. Frequent occurrence of the T-loop RNA folding motif in ribosomal RNAs. RNA. 2002;8:1112–1119. doi: 10.1017/s135583820202006x. [DOI] [PMC free article] [PubMed] [Google Scholar]
- Nissen P, Ippolito JA, Ban N, Moore PB, Steitz TA. RNA tertiary interactions in the large ribosomal subunit: The A-minor motif. Proc Natl Acad Sci. 2001;98:4899–4903. doi: 10.1073/pnas.081082398. [DOI] [PMC free article] [PubMed] [Google Scholar]
- Noah JW, Lambowitz AM. Effects of maturase binding and Mg2+ concentration on group II intron RNA folding investigated by UV cross-linking. Biochemistry. 2003;42:12466–12480. doi: 10.1021/bi035339n. [DOI] [PubMed] [Google Scholar]
- Pley HW, Flaherty KM, McKay DB. Model for an RNA tertiary interaction from the structure of an intermolecular complex between a GAAA tetraloop and an RNA helix. Nature. 1994;372:111–113. doi: 10.1038/372111a0. [DOI] [PubMed] [Google Scholar]
- Podar M, Dib-Hajj S, Perlman PS. A UV-induced Mg2+-dependent cross-link traps an active form of domain 3 of a self-splicing group II intron. RNA. 1995;1:828–840. [PMC free article] [PubMed] [Google Scholar]
- Pyle AM, Green JB. Building a kinetic framework for group II intron ribozyme activity: Quantitation of interdomain binding and reaction rate. Biochemistry. 1994;33:2716–2725. doi: 10.1021/bi00175a047. [DOI] [PubMed] [Google Scholar]
- Pyle AM, Lambowitz AM. Group II introns: Ribozymes that splice RNA and invade DNA. In: Gesteland R, et al., editors. The RNA world. Cold Spring Harbor Laboratory Press; Cold Spring Harbor, NY: 2006. pp. 469–506. [Google Scholar]
- Pyle AM, Chu VT, Jankowsky E, Boudvillain M. Using DNAzymes to cut, process and map RNA molecules for structural studies or modification. Methods Enzymol. 2000;317:140–146. doi: 10.1016/s0076-6879(00)17012-0. [DOI] [PubMed] [Google Scholar]
- Pyle AM, Fedorova O, Waldsich C. Folding of group II introns: A model system for large, multidomain RNAs? Trends Biochem Sci. 2007;32:138–145. doi: 10.1016/j.tibs.2007.01.005. [DOI] [PubMed] [Google Scholar]
- Rest JS, Mindell DP. Retroids in Archaea: Phylogeny and lateral origins. Mol Biol Evol. 2003;20:1134–1142. doi: 10.1093/molbev/msg135. [DOI] [PubMed] [Google Scholar]
- Ryder SP, Ortoleva-Donnelly L, Kosek AB, Strobel SA. Chemical probing of RNA by nucleotide analog interference mapping. Methods Enzymol. 2000;317:92–109. doi: 10.1016/s0076-6879(00)17008-9. [DOI] [PubMed] [Google Scholar]
- Sontheimer EJ, Gordon PM, Piccirilli JA. Metal ion catalysis during group II intron self-splicing: Parallels with the spliceosome. Genes & Dev. 1999;13:1729–1741. doi: 10.1101/gad.13.13.1729. [DOI] [PMC free article] [PubMed] [Google Scholar]
- Su L, Qin P, Michels W, Pyle A. Guiding ribozyme cleavage through motif recognition: The mechanism of cleavage site selection by a Group II intron ribozyme. J Mol Biol. 2001;306:665–668. doi: 10.1006/jmbi.2000.4323. [DOI] [PubMed] [Google Scholar]
- Swisher J, Duarte C, Su L, Pyle A. Visualizing the solvent-inaccessible core of a group II intron ribozyme. EMBO J. 2001;20:2051–2061. doi: 10.1093/emboj/20.8.2051. [DOI] [PMC free article] [PubMed] [Google Scholar]
- Toor N, Hausner G, Zimmerly S. Coevolution of group II intron RNA structures with their intron-encoded reverse transcriptases. RNA. 2001;7:1142–1152. doi: 10.1017/s1355838201010251. [DOI] [PMC free article] [PubMed] [Google Scholar]
- Toor N, Robart AR, Christianson J, Zimmerly S. Self-splicing of a group IIC intron: 5′ exon recognition and alternative 5′ splicing events implicate the stem–loop motif of a transcriptional terminator. Nucleic Acids Res. 2006;34:6461–6471. doi: 10.1093/nar/gkl820. [DOI] [PMC free article] [PubMed] [Google Scholar]
- Toor N, Keating KS, Taylor SD, Pyle AM. Crystal structure of a self-spliced group II intron. Science. 2008a;320:77–82. doi: 10.1126/science.1153803. [DOI] [PMC free article] [PubMed] [Google Scholar]
- Toor N, Rajashankar K, Keating KS, Pyle AM. Structural basis for exon recognition by a group II intron. Nat Struct Mol Biol. 2008b;15:1221–1222. doi: 10.1038/nsmb.1509. [DOI] [PMC free article] [PubMed] [Google Scholar]
- Toor N, Keating KS, Pyle AM. Structural insights into RNA splicing. Curr Opin Struct Biol. 2009;19:260–266. doi: 10.1016/j.sbi.2009.04.002. [DOI] [PMC free article] [PubMed] [Google Scholar]
- Vogel J, Borner T. Lariat formation and a hydrolytic pathway in plant chloroplast group II intron splicing. EMBO J. 2002;21:3794–3803. doi: 10.1093/emboj/cdf359. [DOI] [PMC free article] [PubMed] [Google Scholar]
- Waldsich C, Masquida B, Westhof E, Schroeder R. Monitoring intermediate folding states of the td group I intron in vivo. EMBO J. 2002;21:5281–5291. doi: 10.1093/emboj/cdf504. [DOI] [PMC free article] [PubMed] [Google Scholar]
- Zimmerly S, Hausner G, Wu X. Phylogenetic relationships among group II intron ORFs. Nucleic Acids Res. 2001;29:1238–1250. doi: 10.1093/nar/29.5.1238. [DOI] [PMC free article] [PubMed] [Google Scholar]


