Abstract
Microdialysis is a well-developed membrane-based tool relying on diffusion to sample diffusible constituents of complex media, such as biological tissue. The objective of this research is to expand the utility of microdialysis by combining transmembrane convection with diffusion to enhance solute exchange between microdialysis probes and the surrounding medium. We have developed a mathematical model to describe probe performance and performed validation experiments utilizing tracer solutes and commercially available probes with 100-kDa molecular weight cutoff membranes. Diffusive and fluid permeabilities of the probe membranes are evaluated for probes immersed in well-stirred bathing media in vitro. Transmembrane convection alters the solute extraction fraction, i.e., the fractional loss of a solute from the probe perfusate during delivery and the fractional gain by the perfusate during sampling. The extraction fraction change depends upon the magnitude and direction (inward or outward) of fluid movement across the membrane. However, for solutes with zero reflection coefficients, equality is maintained between these delivery and sampling extraction fractions. This equality is a prerequisite for probe calibration approaches that rely on analyte delivery from the perfusate. Thus, we have provided the theoretical and experimental basis for exploiting convection in a quantitative manner to enhance solute delivery and sampling in microdialysis applications.
Keywords: microdialysis, diffusion, convection, ultrafiltration, mathematical modeling
1. Introduction
Microdialysis is a term applied to a membrane-based technology developed for sampling diffusible constituents of tissue extracellular space. Microdialysis probes utilize hollow fiber synthetic membranes to enable solute exchange between the perfusate solution and the tissue into which the probe is implanted. With bi-directional exchange across the membrane, solutes added to the perfusate can be delivered to the tissue concurrent with the sampling operation. Although sampling applications have been predominant to date, the dual capability enlarges the utility of the technology.
It is customarily assumed that no significant amount of the perfusate fluid is lost across the probe membrane and that solute exchange across the membrane occurs by diffusion. These assumptions serve two purposes. First, quantitative description of the phenomena governing microdialysis in vivo is simplified if diffusion is the dominant mechanism for solute movement through the membrane and the surrounding tissue. Second, it is less likely that fluid would accumulate between the membrane and the tissue to confound interpretation of measurements. These assumptions often appear reasonable because of the confluence of two factors: the fluid permeabilities of many of the hollow fiber membranes commonly employed are relatively low, and the diffusivities for the low molecular weight solutes of interest are relatively high.
However, the membranes of probes in current use vary considerably in their fluid permeabilities. Perfusate transmembrane loss has been sufficiently pronounced with some probes that various counter measures have been proposed, such as using hyperosmotic perfusates [1–3] and push-and-pull pumping [4–7] or imposing an inwardly directed hydrostatic pressure difference across the membrane [8, 9]. Even with low-fluid-permeability membranes, a significant fraction of the perfusate can be driven across the membrane by elevating the probe internal pressure [10, 11]. Transmembrane convection can be utilized to augment the rate of delivery of solutes to the external medium, as demonstrated for probes perfused with a solution of ethanol [12]. The degree to which fluid might accumulate at the tissue interface for probes implanted in vivo is an open question. However, considerable understanding of interstitial flow rates that tissue can accommodate has been acquired through studies of direct infusion of solutions into tissue. Many of these studies have been conducted in the context of promoting the delivery of therapeutic agents [13]. Such convection-enhanced delivery (CED) is particularly attractive for macromolecular agents for which diffusion is insufficient to achieve the desired spatial and temporal distribution. The use of membrane devices in CED is potentially advantageous because the infusate can be delivered over larger surface areas compared with needles or multiport catheters, as demonstrated by Oh et al. [14] for dye and adenovirus gene vector delivered to mouse brain from a hollow fiber catheter. Delivery instead via microdialysis probes would offer the additional advantage of permitting sampling to occur simultaneously, since a portion of the dialyzed perfusate is collected for subsequent assay [15].
Our intent is to provide a basis for incorporating ultrafiltration into microdialysis practice. Through mathematical modeling we have described the influence of ultrafiltration on the performance of microdialysis probes for sampling and delivering solutes. The effects from both inward and outward ultrafiltration are considered. In the present report we apply the model to in vitro conditions for a probe immersed in a well-stirred constant temperature solution. The model predictions are substantiated by experimental measurements for model solutes with existing commercial microdialysis probes. Extension of the model to predict performance in vivo will be treated in a subsequent publication.
2. Steady-state solute transport theory
Existing microdialysis theory describes solute exchange across the probe membrane as a purely diffusional process driven by spatial gradients in concentration [16, 17]. For steady-state conditions the expressions for the efficiency of solute exchange reduced to explicit transcendental equations. These equations permit experiment planning and data analysis in readily available spreadsheet software. This desirable level of simplicity has been retained in extending the theory to incorporate transmembrane convection as a second mechanism for solute exchange. The simplification was achieved by invoking a number of reasonable assumptions, the most important of which are the following:
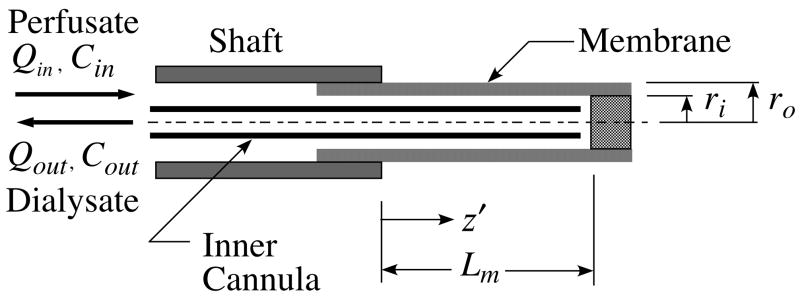
Axial symmetry is maintained with a cylindrical hollow fiber membrane and a concentrically positioned inner cannula as shown schematically in Fig. 1.
Concentration polarization does not occur because solutes of interest are sufficiently small that the membrane and the external medium do not reject them.
The membrane is homogeneous, i.e., the structure and physical properties are uniform in both the radial and axial directions.
The axial annulus pressure drop is small compared with the transmembrane pressure drop so that axial variation in the transmembrane fluid flux can be neglected.
Diffusive and convective contributions to the solute flux across the annulus-membrane and membrane-external medium interfaces are simply additive because of concentration linearity in the governing equations.
Fig. 1.
Schematic cross-sectional view of a portion of a microdialysis probe showing the cylindrical hollow fiber membrane attached to the end of the shaft. The single inner cannula is assumed to be aligned parallel to the membrane in the concentric position. Net analyte movement across the membrane results in a difference between the inflowing perfusate concentration, Cin, and the exiting dialysate concentration, Cout. Diffusional loss or gain of analyte may be supplemented by transmembrane convection associated with a difference between the perfusate and dialysate volumetric flow rates, Qin and Qout. Cylindrical coordinates, r′ and z′, indicate location with respect to the origin positioned on the axis of the membrane at the inlet end. The geometry of the membrane is specified by the inner and outer radii, ri and ro, respectively, and the length, Lm, of the portion accessible for analyte exchange. The outer radius of the internal cannula is rcann.
Development of the mathematical framework rests on the formulation of conservation equations for solute mass and fluid within the perfusate and membrane. In the mass balances, C denotes the concentration of the solute of interest. A prime (′) indicates a variable with units to distinguish it from a subsequent nondimensional normalized form. Quantities associated with the perfusate solution within the probe annulus are designated by a subscript “a”, while those associated with the effluent dialysate sample are indicated by a subscript “d”. Membrane quantities are indicated by subscripts “f” or “m” depending upon whether they are associated with the accessible fluid-filled portion or the whole membrane volume, respectively.
As indicated in Fig. 1, the inner and outer radii of the probe membrane are ri and ro, respectively. The segment of the membrane that is accessible for fluid and solute exchange is of length, Lm. The inner and outer membrane surface areas are then
| (1) |
The outer radius of the single cannula inside of the membrane is rcann. For radial symmetry the spatial variations in the dependent variables occur only in the radial, r′, and axial, z′, directions.
2.1. Perfusate balances
The perfusate volumetric flow rate into the probe is Qin, while the dialysate effluent flow rate is Qout. The difference is the fluid loss or gain by transmembrane flow. Dividing the difference by Qin defines a dimensionless ultrafiltration factor
| (2) |
The perfusate rate, Qin, will be treated as a positive quantity. In the case of fluid loss (Qout<Qin ) fQ is positive and may exceed unity for retrograde dialysate flow (negative Qout). For fluid gain (Qout>Qin), fQ is negative and unbounded.
For transmembrane flow that does not vary appreciably with axial position, the uniform volumetric fluid flux across inner surface of the membrane is given by
| (3) |
The flow rate of the retained annular fluid then either increases or decreases with axial position, z′, according to
| (4) |
The rates of flow in and out of the membrane are the same, so the volumetric fluxes across the inner and outer surfaces are related by
| (5) |
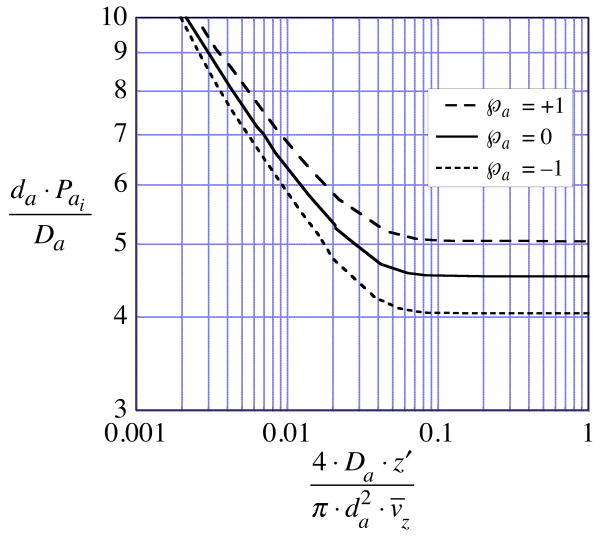
Accompanying the fluid loss is a convective flux of solute into the membrane given by , in which is the solute concentration at the annular fluid-membrane interface at z′. Let denote the radially averaged solute concentration at the same axial position. There will be, as well, a diffusive contribution to the loss of solute to the membrane. The governing equations are linear in concentration, which suggests that the diffusive portion can be incorporated as an additive flux empirically represented by , in which Pai is the annulus diffusional permeability (referenced to the membrane inner surface area). Determination of the annulus permeability from the equations for fully coupled diffusive and convective transport is described in the Appendix. Equating the sum of the two loss contributions to the steady-state decrease in solute content per unit axial distance yields a differential mass balance for the solute in the annular fluid
| (6) |
Solute diffusion in the axial direction is neglected. Applying the chain rule for differentiation to the left-hand-side of Eq. (6) and substituting
| (7) |
converts the solute balance to
| (8) |
2.2. Membrane balances
The equation of continuity for steady flow across the membrane is
| (9) |
in which the vector velocity, , can be related to dynamic pressure, p′, through Darcy’s Law
| (10) |
where κm is the Darcy conductivity for the membrane and η is the perfusate viscosity. The solute mass flux resulting from convection and diffusion through the membrane can be described by
| (11) |
in which Dm is an effective coefficient of diffusion for the solute in the membrane [17]. Both Dm and are based on the membrane volume, not on the accessible or mobile fluid volumes within the membrane. The steady-state solute mass balance within the membrane, neglecting diffusion and convection in the axial direction, is
| (12) |
This formulation incorporates Eq. (11) and the conservation of fluid volume constraint, Eq. (9). The effective diffusion coefficient is presumed to be uniform throughout the membrane region to which Eq. (12) is applied. The value may differ between layers in the case of membranes with layered asymmetric structures.
2.3. Boundary conditions
The following constraints on continuity of solute concentration and flux across the interfaces are to be applied. At the fluid-membrane interface, r′ = ri,
| (13) |
and
| (14) |
At the membrane-external medium interface, r′ = ro,
| (15) |
in which Pext is a diffusive permeability for the external medium. In addition, at the inlet end of the membrane, z′ = 0,
| (16) |
2.4. Dimensionless form
In boundary conditions (15) and (16), Cext and Cin are constants. Since the governing equations are linear, the variables can be normalized according to definitions
| (17) |
| (18) |
Recast in nondimensional form the governing differential equations become
| (19) |
from Eq. (12),
| (20) |
and from Eq. (9),
| (21) |
The nondimensionalized boundary conditions can then be written from Eq. (13),
| (22) |
| (23) |
| (24) |
and from Eq. (16),
| (25) |
The membrane Péclet number denoted by  is a dimensionless measure of the importance of convection relative to diffusion
| (26) |
in which the uniformity of the Péclet number follows from Eq. (5). The above governing equations as written presume that the membrane is homogeneous. They could be adapted to describe transport in layered asymmetric membranes in which the properties of individual layers can be treated as uniform.
2.5. Diffusive permeability definitions
The assumptions of linearity and additivity of the convective and diffusive contributions to the solute fluxes across the interfaces permits the diffusive portions to be represented in terms of permeabilities defined for the membrane by
| (27) |
and
| (28) |
Flow in the annulus is assumed to be laminar, so the annulus diffusive permeability is similarly defined by
| (29) |
2.6. Overall permeability
Substituting Eq. (27) into Eq. (23) and using the resulting expression and the other interface boundary conditions to eliminate Cai from Eq. (19) leads to a compact form of the differential perfusate balance
| (30) |
where ξ represents the ratio
| (21) |
in which  is an overall probe diffusive permeability defined as
| (32) |
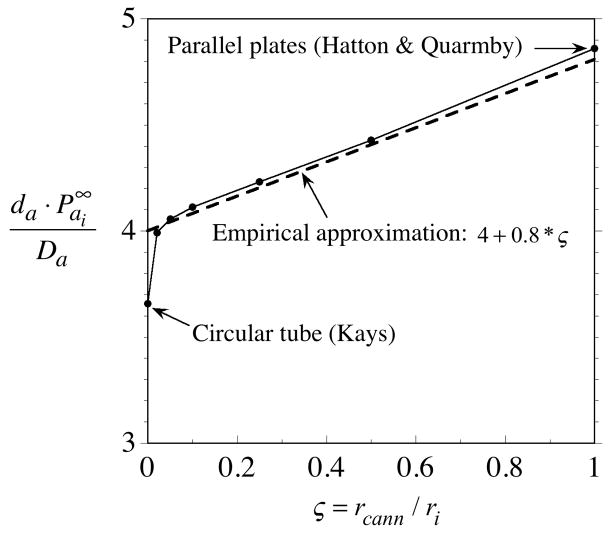
Since Ji = 0 for no ultrafiltration, the dimensionless ratio, ξ, varies strongly with the degree of convection through the membrane and becomes positively or negatively unbounded as Ji → 0. To render Eq. (30) directly integrable, the z-dependence of  has been eliminated by replacing the annulus permeability in Eq. (32) with its asymptotic value,
. The asymptote is explained in the Appendix, and a simple expression is developed for computing approximate values.
2.7. Extraction fractions
In the absence of transmembrane fluid flow, the usual metric for characterizing the difference between perfusate and dialysate concentrations arising from gain or loss of solute by diffusion is the concentration-based extraction fraction defined as
| (33) |
In the presence of transmembrane fluid flow, a second dimensionless metric is needed for characterizing the difference between perfusate and dialysate solute mass flow rates. Integration of differential mass balance, Eq. (6), over the length of the membrane suggests defining a mass-based extraction fraction as
| (34) |
The two extraction fraction definitions are interrelated through the ultrafiltration factor. Substituting Eqs. (2), (3) and (33) into Eq. (34) yields
| (35) |
The two metrics, EC and EM, are thus not independent. Measurement of one, together with fQ, is equivalent to determination of the other. The above definitions are intended to be applicable to situations of non-negative dialysate flow rate, which implies a restriction to values of fQ ≤ 1 from Eq. (2).
A salient feature of the set of dimensionless governing equations, (19)-(32) and the definitions (33) and (34) is that the direction of the net transmembrane movement of the solute is unspecified. This is a consequence of assumptions that the underlying processes dependent upon the concentrations of the solute of interest are first order, i.e. the rates of the processes are proportional to the relevant concentration. As a result, the value of an individual metric, either EC or EM, should be the same whether the solute is being delivered from the perfusate to the external medium or being sampled from the external medium by the perfusate. This prediction is a key feature of the modeling effort. It implies that all of the probe calibration techniques developed for pure diffusion microdialysis should be applicable under ultrafiltration conditions. Thus, for example, in the presence of ultrafiltration the EC obtained by delivery from the perfusate (retrodialysis) should apply to sampling of the same solute under the otherwise identical ultrafiltration conditions.
Expressions for the extraction fractions in terms of the model parameters can be obtained by integrating the perfusate balance, Eq. (30). With the assumption that for steady state the permeabilities and the ultrafiltration factor do not vary in the z direction, Eq. (30) can be integrated directly. Incorporating boundary condition (25) in the solution yields
| (36) |
Hence, from Eq. (33) the concentration extraction fraction is given by
| (37) |
and from Eq. (35) the mass extraction fraction is given by
| (38) |
Thus, the magnitudes of both EC and EM are functions of fQ and, through ξ, the permeabilities. However, for a given fQ value, the value of EC is independent of the direction of the concentration driving force, i.e., the value is the same whether Cin>Cext or Cin < Cext. Likewise, the EM value for inward and outward diffusion is identical. As noted in the paragraph above, this symmetry between the sampling and delivery modes of microdialysis operation is an important consequence of the linearity of the governing equations that is retained in the presence of transmembrane fluid flow.
In the absence of ultrafiltration (Ji = 0 and fQ = 0), the concentration and mass extraction fractions become identical and Eqs. (37) and (38) reduce to the previously derived expression [16, 17] for the diffusional extraction fraction, Ed. This can be shown by employing the identity, (1 − fQ)ξ = exp[ξ · ln(1 − fQ)], and the asymptotic expansion, ln[1 − fQ]~ − fQ in the limit as Jo → 0. For example, from Eq. (37)
| (39) |
| (40) |
The equality of EC and EM in the no ultrafiltration limit follows directly from Eq. (35) or from Eq. (38) and the limit
| (41) |
2.8. 1-D approximation by axial averaging
The membranes employed in commercial microdialysis probes have radii in the range 0.1 < ro < 0.3 mm and accessible lengths of 1 < Lm < 30 mm. Furthermore, the membrane thicknesses, ro − ri, are much smaller than either radii. As a result, the contributions of diffusion and convection in the axial direction within the membrane are generally small compared with those in the radial direction. Neglecting the axial contributions permits simplifying analytical solutions to the governing membrane equations. In addition, there is good justification for neglecting axial variation in the parameters, such as the permeabilities. This facilitates explicitly rendering the governing equations one-dimensional by axial averaging. The definition of the axial average concentration is
| (42) |
Applying axial averaging to Eq. (20) and boundary conditions (22) and (23) leads to the concentration profile in the fluid phase of a homogenous porous membrane given by
| (43) |
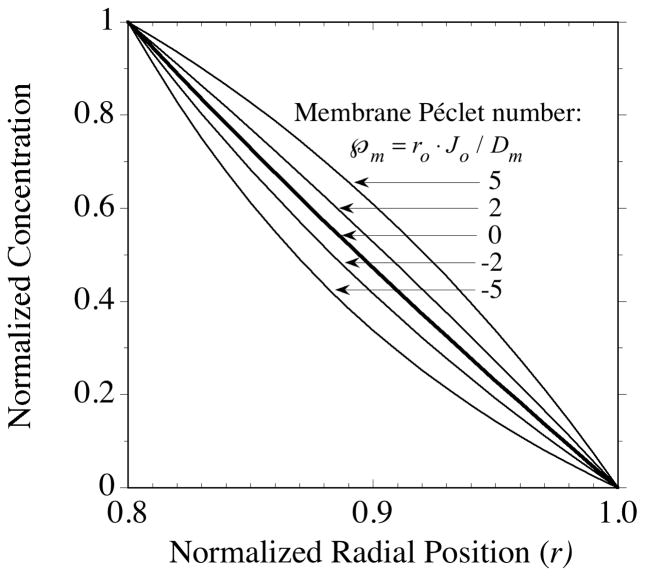
Illustrative profiles generated from Eq. (43) are displayed in Fig. 2 for several positive and negative values of  in the range to be encountered in the experiments of section 4. In the absence of convection (
 = 0), Eq. (43) reduces to
Fig. 2.
Steady-state solute concentration profiles calculated from Eqs. (43) and (44) for the fluid phase of a porous membrane. The membrane inner and outer radius ratio was chosen to be ri/ro = 0.8 for this illustration and membrane properties are assumed uniform. Radial position, r = r′/r0, is normalized with respect to the membrane outer radius. The axial-averaged concentration is normalized relative to the difference between the inner and outer interface concentrations, (〈Cf 〉 − 〈Cfo;〉)/(〈Cfi〉 − 〈Cfo〉). With this definition for the ordinate the plot is applicable to solute movement in either the outward (delivery) or inward (sampling) directions. The membrane Péclet number,  , indicates the magnitude of convection relative to diffusion within the membrane. The profile in the absence of convection is indicated by the single thicker curve labeled,
  = 0. The Péclet number is positive for flow in the outward direction and negative for inwardly directed flow.
| (44) |
For thin membranes the profile from Eq. (44) is nearly linear, as indicated by the bold intermediate curve in Fig. 2. Transmembrane convection distorts the profiles in the flow direction.
The assumption of axial uniformity in the permeabilities leads to the following expressions for dimensionless permeabilities from solution (43) and axial averaging of definitions (27) and (28)
| (45) |
| (46) |
The presence of the membrane Péclet number on the right-hand-sides indicates that the magnitudes of these solute diffusive permeabilities are influenced by convection. The Péclet number can be either positive or negative depending on the direction of the fluid flux, but the permeabilities are positive quantities that simplify in the absence of transmembrane flow to
| (47) |
The solution to Eq. (21) for radial flow in the membrane is
| (48) |
Substituting Eqs. (43) and (48) into the axially averaged form of the equation for solute flux, Eq. (11), leads to the following nondimensional expression for the solute flux at any radial position in the membrane
| (49) |
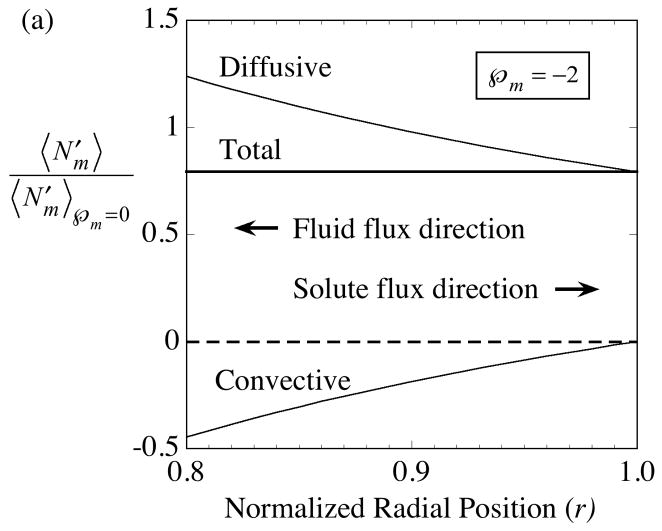
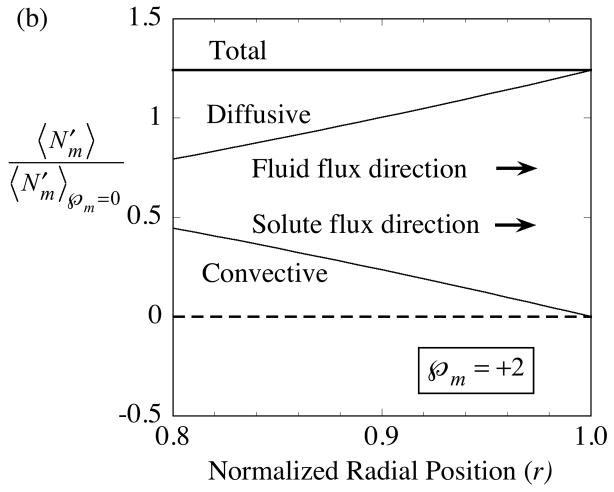
Although the total solute flux from Eq. (49) is proportional to 1/r, the diffusive and convective contributions exhibit a stronger opposing dependence on radial position. These separate contributions can be expressed as
| (50) |
and
| (51) |
In the absence of convection the flux reduces to
| (52) |
The interplay between diffusion and convection within the membrane is illustrated in Fig. 3 for delivery with . To highlight the difference generated by convection, the fluxes in the presence of convection, Eqs. (49)-(51), are divided by the pure diffusive flux, Eq. (52).
Fig. 3.
Solute movement across the membrane is the sum of diffusive and convective contributions. Whereas the separate contributions vary significantly with normalized radial position, r, the total solute flow rate is uniform across the membrane. The ordinate is the axial-average solute flux in the presence of convection divided by the corresponding flux in the absence of convection,
. The illustrative cases shown are for solute delivery with the direction of ultrafiltrate fluid flow either: (a) inward as indicated by the negative membrane Péclet number,  = −2, or (b) outward as indicated by the positive membrane Péclet number,
  = +2. The membrane fluid phase axial-average concentration at the outside surface is maintained at
.
2.9. Membrane diffusivity evaluated from no-fluid-flux condition
The dependence of the membrane diffusive permeabilities, Pmi and Pmo, on transmembrane fluid flow has been expressed through Eqs. (45) and (46). To calculate a permeability for any desired level of fluid flux requires a value for the solute effective diffusion coefficient in the membrane, Dm. Our approach to determining the latter is to calculate the value from the permeability at the inner surface in the absence of transmembrane flow
| (53) |
The pure diffusion Pmi can be calculated from the rearranged limiting form of Eq. (40)
| (54) |
using a value for the pure diffusion extraction fraction obtained by interpolation or extrapolation to fQ = 0 of EC or EM values measured in the presence of transmembrane flow, i.e., for various non-zero values of fQ. The superscript “ws” indicates that we assume the external medium is sufficiently well stirred to render the term, (Pmo / Pmi) / Pext, of negligible magnitude in comparison with the sum of reciprocals of the annulus and membrane permeabilities in Eq. (32). Also, for the annulus permeability we employ the asymptote, , derived in the Appendix.
3. Steady-state fluid transport theory
For membranes of sufficiently high fluid permeability the fluid transport (hydraulic) properties of the probe can be conveniently assessed under in vitro conditions shown schematically in Fig. 4. Quantitative characterization of the hydraulics requires a separate fluid transport mathematical model from the model developed for evaluation of the solute transport parameters. The model uses the hydraulic conductivity, Hm, as one measure of the ease of fluid permeation through the membrane. This property is defined as the coefficient of proportionality between the ultrafiltrate fluid flux and the transmembrane pressure difference, Δpm,
Fig. 4.
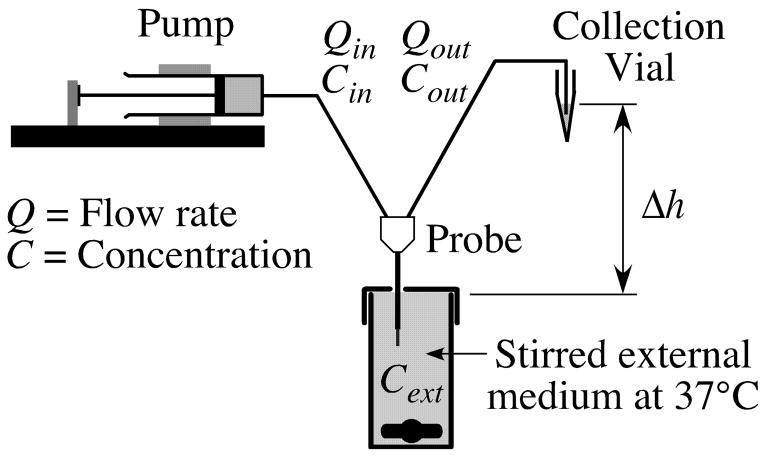
Schematic for in vitro experiments in which probes were immersed in a well-stirred aqueous solution maintained at 37°C. The extent of perfusate ultrafiltration was varied by two means. Changing the inflow rate, Qin, alters the hydrodynamic contribution to the transmembrane pressure drop. This portion arises from resistance to flow of the retained fluid through the effluent tubing and the passages within the probe downstream of the membrane. Adjusting the height of the dialysate collection vial relative to the probe alters the effluent fluid hydrostatic contribution to the transmembrane pressure drop. That contribution is associated with the difference in elevation between the dialysate meniscus in the collection vial and the external medium surface denoted by Δh.
| (55) |
where,
| (56) |
is the log mean surface area of the membrane. A measure with less temperature sensitivity than Hm is the membrane Darcy conductivity in Eq. (10), which is related to the hydraulic conductivity in Eq. (55) by
| (57) |
The ultrafiltration is driven by the total transmembrane pressure difference (Δpm), which is the sum of the dynamic (Δpdyn), hydrostatic (Δphyd), and osmotic pressure differences (Δpπ). The latter has been neglected in the present treatment, since the perfusate and external medium solutions in the current experiments differed only in low concentrations of the analyte and the membrane was not selectively permeable to any of the solution constituents. However, there are a number of reports in the literature in which osmotic pressure differences have been deliberately imposed to avoid net transmembrane flow by counteracting the hydrostatic and dynamic pressure effects [1–3] or to augment inward ultrafiltration [8, 9]. Also, the probes are likely to be used with larger solutes whose transport through the membrane may be hindered. Consequently, there would be merit in a future extension of the model to include the influence of osmotic pressure. For present purposes the model will be developed to support generating a wide range of controlled transmembrane flow by varying Δphyd and Δpdyn.
The treatment of hydrostatic pressure is simplified, since the densities of the perfusate and external media were the same, except for minor differences due to temperature and concentration of the analyte solute. The transmembrane hydrostatic pressure difference is then generated only by the effluent fluid column. This pressure difference thus depends upon the elevation of the collection vial relative to the probe and can be represented by
| (58) |
where ρ is the solution density, g is the gravitational constant and Δh is the difference in height between the fluid interfaces in the collection vial and the external medium as shown in Fig. 4. In the experiments the vertical position of the collection vial relative to the level of the unstirred external medium interface was varied by an apparent height, Δhapp. The offset, h+, between Δh and Δhapp was an additional parameter that, where necessary, could be determined from the experiments. The offset may represent additional driving forces, such as surface tension effects or pressure associated with stirring of the external medium
| (59) |
The dynamic pressure varies because of resistance to flow within the afferent and effluent tubing, the probe annulus and the other intervening channels within the probe. To obtain the contribution to transmembrane pressure from the annulus dynamic pressure, pa, we will assume the annulus is concentric and the pressure gradient in the fluid can be approximated by the following expression
| (60) |
in which the annular flow rate for uniform transmembrane flow from Eq. (4) is
| (61) |
and the resistance to annular flow is
| (62) |
with, ς = rcann / ri. Equation (62) expresses the resistance for steady annular flow in the absence of fluid loss or gain through the annulus walls [18]. Combining Eqs. (60) and (61) and integrating from z to z =1 gives
| (63) |
Applying axial averaging to Eq. (63) leads to the desired difference between the axial-average annulus pressure, , and the pressure at the outlet end of the membrane
| (64) |
The pressure drop in the effluent dialysate downstream of the membrane will be denoted by Δpeff. Expressed in terms of flow resistance, this is given by
| (65) |
the latter form of which utilizes the limit of Eq. (61) at z =1, . In experiments to determine probe hydraulic properties, Qout can be negative for values of fQ >1 corresponding to dialysate flow from the collection vial into the probe. However, for measurement of solute extraction fraction by dialysate sampling from the collection vial, the above expressions are restricted to positive values of Qin and Qout, and hence, fQ < 1.
Summing the hydrostatic and dynamic pressure contributions to the transmembrane pressure difference gives
| (66) |
Combining Eqs. (55), (64), (65) and (66) to eliminate Δpm and rearranging leads to
| (67) |
This relationship suggests the following two procedures for evaluating the probe hydraulic properties.
3.1. Assessing hydraulic properties by varying hydrostatic pressure
Under the assumption that the resistances are not affected by pressure, Eq. (67) predicts a linear relationship between fQ and ρgΔhapp at fixed Qin with a coefficient of proportionality
| (68) |
and an intercept for Δhapp = 0 of
| (69) |
Combining the above equations yields the following expressions
| (70) |
and
| (71) |
If ρgh+ can be neglected, Hm and the effluent resistance can be estimated directly from these expression using values for mh and bh obtained for each Qin by linear regression between pairs of fQ and ρgΔhapp measurements. If ρgh+ is significant, this offset is amenable to estimation as well in the following manner.
3.2. Assessing hydraulic properties by varying perfusate flow rate
An alternative procedure to test for the hydraulic properties is to measure the ultrafiltration factor as a function of perfusate flow rate. According to Eq. (67) the dependence of fQ upon 1/Qin is linear with a slope and intercept given by
| (72) |
and
| (73) |
Solving Eqs. (72) and (73) for the hydraulic properties yields,
| (74) |
and
| (75) |
If measurement data sets of fQ as a function of 1/ Qin are obtained for several values of Δhapp, then Eq. (72) suggests that linear regression of the mQ slopes against Δhapp could yield an equation for estimating the offset pressure as
| (76) |
Comparing Eqs. (69) and (73) reveals a useful interrelationship between the intercepts for the two approaches is
| (77) |
which represents the limit at which the dynamic contribution dominates over the hydrostatic. Estimates for other parameters appearing in the model equations are summarized in Table 1.
Table 1.
Solute and fluid transport model parameters evaluated for CMA/12 microdialysis probes with polyethersulfone (PES) membrane.
| Symbol | Description | Value | Units | Source |
|---|---|---|---|---|
| Lm | Length of accessible membrane | 0.3, 0.4 | cm | Nominal value from manufacturer |
| Lout | Length of effluent FEP tubing | 50 | cm | Measured |
| Qin | Perfusate volumetric flow rate | 0.5, 1, 2, 4 | μL/min | Calibrated pump setting |
| rcann | Outer radius of probe internal cannula | 0.0125 | cm | Measured |
| ri | Inner radius of PES membrane | 0.0205 | cm | Nominal value from manufacturer [27] |
| ro | Outer radius of PES membrane | 0.0250 | cm | Nominal value from manufacturer [27] |
| rout | Inner radius of effluent FEP tubing | 0.006 | cm | Nominal value from manufacturer |
| Sm | Log mean surface area of membrane | 0.042, 0.057 | cm2 | Eq. (56) |
| ς | Annulus radius ratio | 0.61 | -- | rcann/ri |
| η | Perfusate viscosity | 0.007 | g/(cm·s) | For water at 37°C |
| ℜa | Annulus hydraulic resistance | 0.011 | cm H2O ·min/μL | Eq. (62) |
3.3. Assessing probe internal hydraulic resistance
The effluent resistance can be subdivided into two contributions: ℜint, the probe internal hydraulic resistance for effluent flow downstream of the membrane, and ℜout, the resistance to flow in the outflow tubing
| (78) |
The outflow tubing resistance can be estimated from the Hagen-Poiseuille equation
| (79) |
in which Lout and rout are the tube length and inner radius, respectively. The internal resistance, ℜint, can vary between probes or between applications when a probe is reused. Equations (78) and (79) provide the means for determining this probe hydraulic property from the estimates for effluent resistance.
4. Experimental methods
Quantitative characterization of microdialysis probes was performed in vitro with the probes immersed in a well-stirred fluid medium at constant temperature. Well-stirred is meant to imply the absence of resistance to mass transport of the solute of interest within the external medium. When this condition is achieved, well-stirred extraction fraction measurements reflect the solute transport properties of the probe.
Measurements were made with a 20-ml vial filled with artificial cerebrospinal fluid (aCSF) that was stirred by a magnetic bar spun at maximal rotational speed. The aCSF temperature was maintained at 37°C by a thermostatically controlled water jacket. A CMA/12 probe (CMA Microdialysis, North Chelmsford, MA) was suspended in the aCSF through a hole in the vial cap as shown schematically in Fig. 4. The probe was perfused with aCSF from a screw-drive syringe pump at a steady inflow rate, Qin. The effluent dialysate flow rate, Qout, was determined gravimetrically from the difference between the initial and final weights of the collection vial. The ultrafiltration factor, fQ, was calculated from Eq. (2). FEP tubing 50-cm in length and 0.12 mm in inside diameter was used for both the afferent flow from the pump to the probe and the effluent flow from the probe to the vial. In experiments to determine the effect of varying the inflow rate on fQ, the pump was set to deliver 0.5, 1, 2 or 4 μL/min. To alter the hydrostatic pressure within the probe, the vertical position of the collection vial was varied, with measured differences in elevation of the menisci in the collection relative to that in the immersion vial, Δh, being maintained typically at −25, −12.5, 0, +12.5 or +25 cm. The hydraulic conductivities and effluent resistances were determined from the fQ measurements for CMA/12 probes constructed with 3-mm and 4-mm lengths of 100-kDa nominal molecular weight cutoff (MWCO) polyethersulfone (PES) membrane. In an experiment to validate the fluid transport model, both perfusate flow rate and collection vial elevation were varied for a single 4-mm probe.
In an experiment to concurrently measure extraction fractions for sampling and delivery, probes were perfused with a solution containing difluorofluorescein (2FF, D6145) while immersed in a solution of fluorescein (FLR, F1300), both dyes purchased from Molecular Probes, Eugene, OR. The dialysate samples were analyzed for both compounds using HPLC with fluorescence detection and the concentration-based extraction fractions were calculated from Eq. (33) as
| (80) |
The corresponding mass-based extraction fractions, , were calculated from Eq. (35).
Alternatively, loss and gain extraction fractions for [14C]-mannitol (CAS No. 88404-24-4, Moravek Biochemicals, La Brea, CA) were obtained separately by adding the radiotracer to either the perfusate for delivery (loss) experiments or to the external medium for sampling (gain) experiments. Although variation in fQ was achieved for the hydraulic property characterization by altering both Qin and Δh, only the latter was varied for the extraction fraction measurements. The dialysate and the external medium samples (200 μL) for each Δh were sampled in triplicate, and 4 mL of scintillation fluid (ScintiSafe Econol cocktail; Fisher Scientific Co., Pittsburgh, PA) was added to each sample. The 14C radioactivity was determined by liquid scintillation counting (LS-6500; Beckman Coulter, Inc., Fullerton, CA). Probes employed for multiple experiments were stored in glycerin between uses.
5. Results
The equations governing fluid and solute transport as formulated in sections 2 and 3 were rendered amenable to analytical solution by invoking simplifying assumptions of linearity, geometric symmetry and uniformity of physical properties. As a result, data analysis for validating the models and determining probe properties could be performed with spreadsheet software.
5.1. Validating the fluid transport model
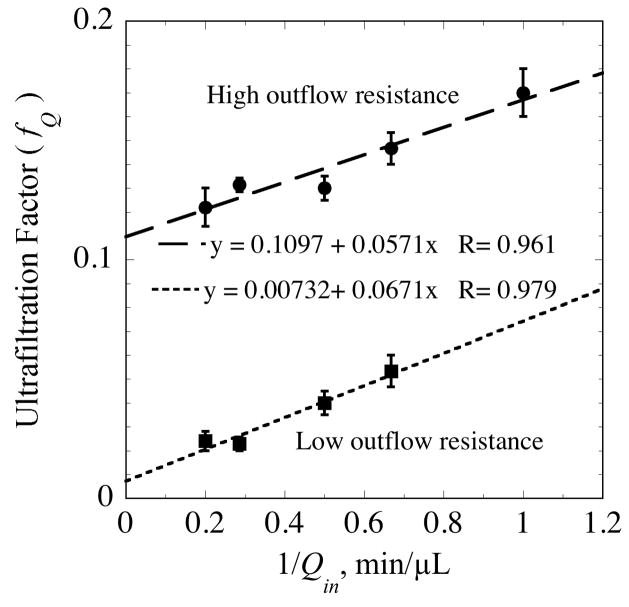
As predicted by model Eq. (67), measured ultrafiltration factor (fQ) values varied linearly with either the inverse of the perfusate flow rate (Fig. 5a) or the elevation of the collection vial, (Fig. 5b). The range of these control variables, Qin and Δhapp, was sufficient to drive fQ values over a wide range from −0.8 to +1.7. Values of fQ exceeding unity indicate that the outwardly directed ultrafiltrate consisted of all the afferent perfusate fluid supplemented by reverse flow from the collection vial to the probe. In these experiments the collection vial was prefilled with aCSF and raised to the high elevation of +25 cm. Negative values of fQ correspond to situations of inwardly directed transmembrane flow, which causes the effluent dialysate flow rate to exceed the perfusate flow rate. Inward flow across the membrane can occur when the internal pressure is made less than that in the external solution by locating the collection vial well below the probe, such as at the −25 cm elevation. The model predicts that the lines in Fig. 5a converge to a common intercept, Eq. (77), representing the condition at which the hydrostatic contribution to ultrafiltration is negligible relative to that from the hydrodynamic pressure.
Fig. 5.
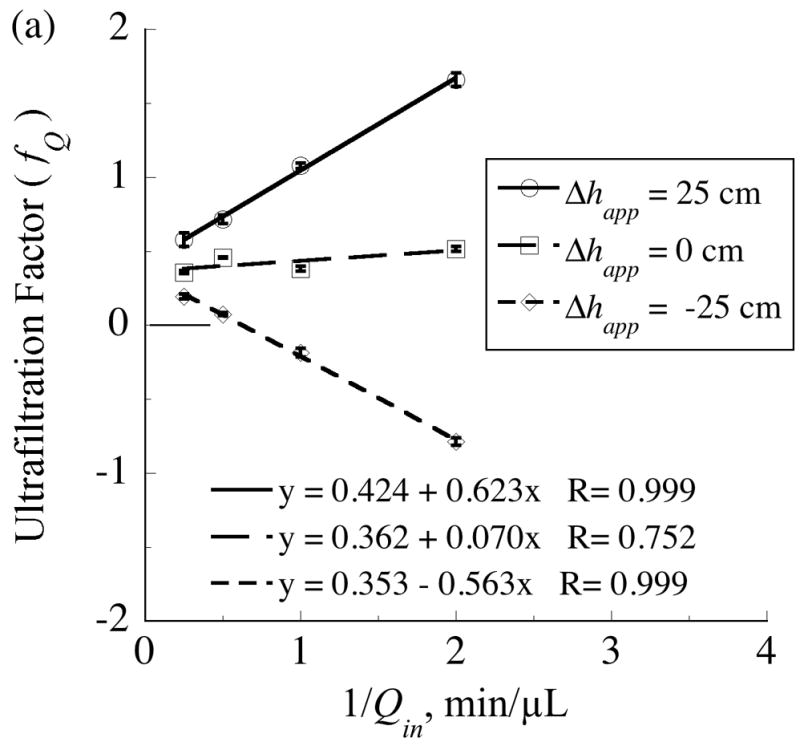
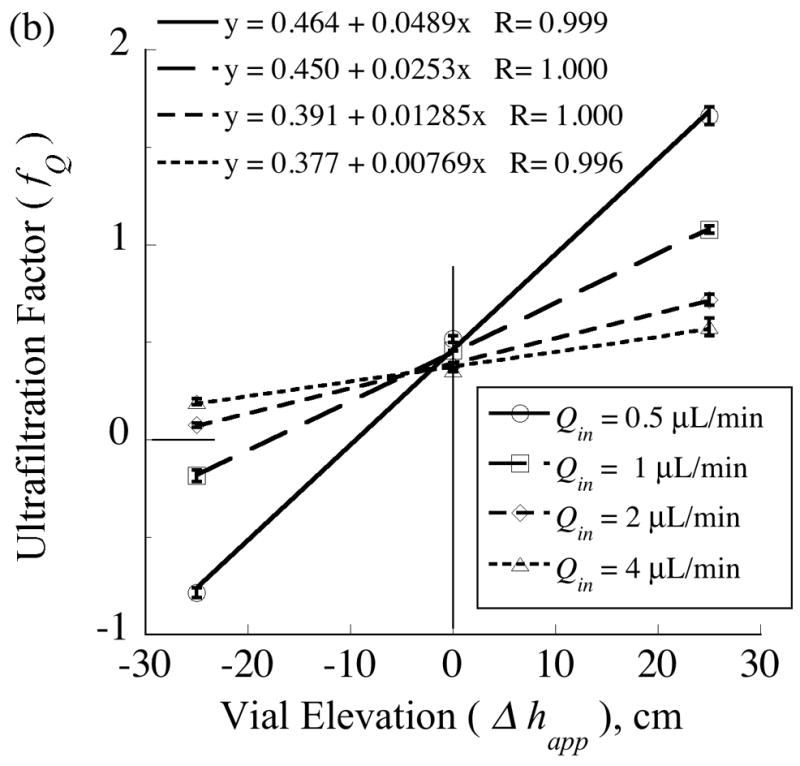
The ultrafiltration factor, fQ =1 − Qout/Qin, varies linearly with either: (a) the reciprocal of the inflow rate, Qin, or (b) the apparent elevation of the collection vial, Δhapp. The measurements were obtained from a single probe (4•1) with a 4-mm length of polyethersulfone membrane (100-kDa MWCO). The collection vials and effluent tubing were preloaded with artificial cerebrospinal fluid (aCSF) and the end of the effluent tubing was submerged in the vial fluid. For measurements in which fQ exceeds unity, Qout was negative as aCSF flowed in the reverse direction from the vial to the probe and contributed to the outward transmembrane flow.
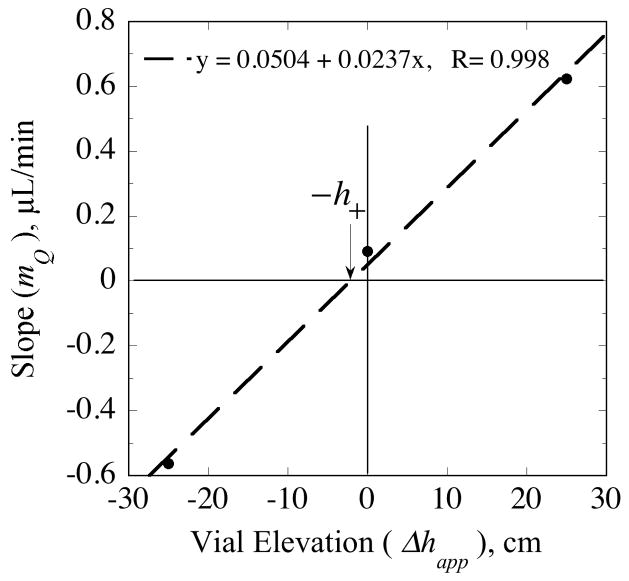
The slopes, mQ, of the regression lines in Fig. 5a depend linearly upon vial elevation (Fig. 6) as predicted by Eq. (72). According to Eq. (72), the elevation corresponding to mQ = 0 is the offset parameter, h+, whose value obtained from the regression equation is 2.1 cm. The source for this pressure offset is undetermined, but could in part represent contributions from external medium stirring or interfacial tension in the collection vial.
Fig. 6.
The linear dependence of the slopes from Fig. 5a on vial elevation as predicted by Eq. (72) provides the means for estimating the elevation offset, h+.
5.2. Assessing probe hydraulic properties
The slope and intercept values obtained by linear regression to the data in Figs 5a and 5b permit estimation of quantities characterizing the hydraulic performance of the probes: the membrane hydraulic conductivity (Hm) from either Eq. (70) or Eq. (74), and the effluent resistance (ℜeff) from either Eq. (71) or Eq. (75). These calculations require the probe geometric dimensions and the estimate for the annulus resistance (ℜa) given in Table 1. The elevation offset value, h+ = 2.1 cm, is used as well, although the calculations are relatively insensitive to the magnitude of this parameter. The values obtained for the hydraulic properties for probe 4•1 are given in Table 2. The apparent Darcy conductivity values (κm) calculated from Hm using Eq. (57) are also included. The coefficient of variation of 22% suggests the reproducibility obtainable for Hm and κm from repeated measurements on a given probe. The conductivity value for Hm obtained for the vial elevation of Δhapp = 0 is unreliable, since the calculation is too sensitive to errors in determination of the value for the small slope, mQ, in the denominator of Eq. (74). Excluding the Δhapp = 0 values reduces the coefficient of variation to 9% for the remaining six conductivity values. The conductivity values remained within a narrow range in repeated uses of the probe during a two-month period (Tables 2 and 3). However, for a second probe the conductivity significantly increased over a similar seven-week interval (Table 4).
Table 2.
Hydraulic property estimates for the CMA/12 probe (4•1) used in the fluid transport model validation measurements (Figs. 5 and 6) and solute transport measurements in Fig. 11. The 100-kDa MWCO polyethersulfone membrane was 4-mm in length. Both perfusate flow rate (Qin) and collection vial apparent elevation (Δhapp) variations were employed to alter the ultrafiltration factor. The hydraulic properties are effluent resistance (ℜeff), and membrane hydraulic (Hm) and Darcy (κm) conductivities.
| Qin | Δhapp | ℜeff | Hm | κm × 10+13 | ||
|---|---|---|---|---|---|---|
| μL/min | cm | cm2 | ||||
| 0.5, 1, 2, 4 | 25 | 18.5 | 0.70 | 3.7 | ||
| 0.5, 1, 2, 4 | 0 | 8.0 | 1.15 | 6.1 | ||
| 0.5, 1, 2, 4 | −25 | 14.3 | 0.67 | 3.5 | ||
| 0.5 | −25, 0, +25 | 14.7 | 0.67 | 3.6 | ||
| 1 | −25, 0, +25 | 15.7 | 0.73 | 3.9 | ||
| 2 | −25, 0, +25 | 14.2 | 0.71 | 3.8 | ||
| 4 | −25, 0, +25 | 11.7 | 0.84 | 4.5 | ||
| Mean±SD | 13.9±3.3 | 0.78±0.17 | 4.1±0.9 | |||
Table 3.
Repetitive determination of hydraulic properties for the same single 4-mm PES membrane CMA/12 probe (4•1) used in the measurements of Table 2 and Figs 5, 6 and 11. The collection vial apparent elevation (Δhapp ) was varied at fixed perfusate flow rates (Qin). Time lapsed refers to the approximate time since the measurements for Table 2 were performed.
| Lapsed time | Qin | Δhapp | ℜeff | Hm | κm ×10+13 | ||
|---|---|---|---|---|---|---|---|
| μL/min | cm | cm2 | |||||
| 3 weeks | 1 | −25, −13, 0, +13, +25 | 19.6 | 0.80 | 4.3 | ||
| 5 weeks | 1 | −25, −13, 0, +13, +25 | 20.5 | 0.79 | 4.2 | ||
| 7 weeks | 2 | −25, −13, 0, +13 | 28.5 | 0.69 | 3.7 | ||
| 8 weeks | 2 | −25, −13, 0, +13 | 18.3 | 0.96 | 5.1 | ||
| Mean±SD | 21.7±4.6 | 0.81±0.11 | 4.3±0.6 | ||||
Table 4.
Repetitive determination of hydraulic properties for the same CMA/12 probe (4•2) with a 4-mm 100-kDa MWCO polyethersulfone membrane used in the solute transport measurements in Fig. 10. The collection vial apparent elevation (Δhapp) was varied at fixed perfusate flow rates (Qin). Time lapsed refers to the approximate time since the first measurement was performed.
| Lapsed time | Qin | Δhapp | ℜeff | Hm | κm ×10+13 | ||
|---|---|---|---|---|---|---|---|
| μL/min | cm | cm2 | |||||
| -- | 1 | −26, −13, −1, +11, +24 | 17.6 | 0.48 | 2.5 | ||
| 1 week | 1 | −26, −13.5, −1, +11, +24 | 21.0 | 0.49 | 2.6 | ||
| 6 weeks | 2 | −26, −1, +12 | 4.4 | 1.16 | 6.2 | ||
| 7 weeks | 1 | −26, −9, −1 | 27.0 | 1.42 | 7.5 | ||
| Mean±SD | 17.5±9.6 | 0.89±0.47 | 4.7±2.5 | ||||
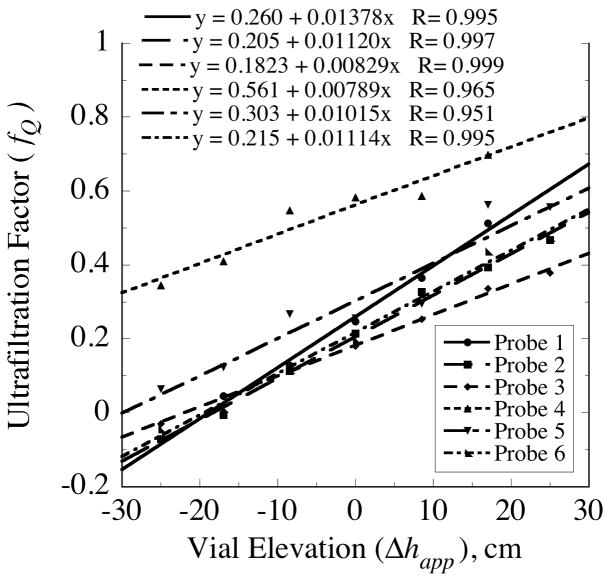
The variability in probe hydraulic properties among probes was assessed for six probes with 3-mm nominal membrane lengths (Fig. 7 and Table 5). The coefficient of variation in the conductivity values was 21% indicating a consistency in this property among probes of the same length. It was anticipated that the conductivity would be independent of membrane length. However, the mean value of Hm = 0.35 μL/(min·cm2·cmH2O) for the 3-mm membranes appeared to be appreciably less than the values obtained for the probes with 4-mm membranes (Tables 2, 3 and 4). The magnitude of the Hm values fall within the broad range of water permeability values tabulated by Aptel and Clifton [19] for other commercial ultrafiltration membranes of varied composition, configuration and MWCO. They are comparable to values of 0.34 and 0.22 μL/(min·cm2·cmH2O) calculable from the water permeability data of Kanamori et al. [20] for polyacrylonitrile and polysulfone hemodialysis fibers, respectively.
Fig. 7.
Variation in ultrafiltration factor, fQ, with apparent elevation of dialysate collection vial, Δhapp, in vitro at 37°C for six CMA/12 probes with 100-kDa MWCO polyethersulfone (PES) membranes, 3-mm in nominal length.
Table 5.
Hydraulic properties of six CMA/12 probes with 3-mm 100-kDa MWCO polyethersulfone membranes obtained by varying the collection vial apparent elevation (Δhapp) at a fixed perfusate flow rate of Qin = 1 μL/min. Values for the probe downstream internal resistance, ℜint, were obtained from Eq. (78) and the estimates for the effluent resistance, ℜeff, together with the resistance in the outflow tubing at 23.5°C, ℜout = 15.4cmH2O · min/mL, calculated from Eq. (79).
| Probe | Δhapp | ℜint | Hm | κm ×10+13 | ||
|---|---|---|---|---|---|---|
| cm | cm2 | |||||
| 3 • 1 | −18, −9.5, −1, +7.5, +16 | 4.4 | 0.44 | 2.4 | ||
| 3 • 2 | −26, −18, −9.5, −1, +7.5, +16, +24 | 3.9 | 0.33 | 1.8 | ||
| 3 • 3 | −26, −18, −9.5, −1, +7.5, +16, +24 | 7.6 | 0.24 | 1.3 | ||
| 3 • 4 | −26, −18, −9.5, −1, +7.5, +16 | 56.7 | 0.43 | 2.3 | ||
| 3 • 5 | −26, −18, −9.5, −1, +7.5, +16, +24 | 15.5 | 0.35 | 1.8 | ||
| 3 • 6 | −−26, −18, −9.5, −1, +7.5, +16, +24 | 4.9 | 0.34 | 1.8 | ||
| Mean±SD | 15.5±20.6 | 0.35±0.07 | 1.9±0.4 | |||
As noted in section 5.1, both inward and outward transmembrane flow was generated in several of the data sets in Figs. 5 and 7. No change in slope was found in transitioning between inward and outward flow. This suggests that the hydraulic conductivity of this asymmetric membrane is independent of the direction of transmembrane flow, in contrast to observations with a different asymmetric polyethersulfone hollow fiber by Li et al. [7]
While the coefficient of variation for the Hm values was only 21%, the internal resistance ℜint varied over more than a 14-fold range among the probes (Table 5). This resistance, was noticeably high for probe 3•4, but also elevated for probe 3•5. It is uncertain whether this variability in ℜint arises from variation in probe geometry or to factors introduced during preparation for the measurements, such as debris or air bubbles trapped downstream of the membrane despite filtering and degassing of the perfusate solutions.
Snyder et al. [11] demonstrated that lower MWCO membranes in commercial microdialysis probes were also susceptible to perfusate loss through ultrafiltration as a consequence of backpressure generated in the outflow tubing. These authors tested three membranes differing in MWCO from 6 kDa to 29 kDa. In all three membranes the degree of loss varied with the outflow hydraulic resistance and the effluent flow rate as illustrated in Fig. 8. At a typical flow rate of 1 μL/min, the loss varied between 4% and 17% for the three membranes and different outflow resistances. However, the authors do not mention the influence of hydrostatic pressure and do not report the relative position of the probe and the collection vial required by Eq. (74). As a result, the probe hydraulic properties values cannot be reliably determined from their data. However, it is possible from the high outflow resistance results to estimate upper bounds on the membrane hydraulic and Darcy conductivities, assuming that the vial elevation was kept the same within the measurements for each probe type. With this assumption, Eqs. (72) and (73) can be combined to yield,
Fig. 8.
Fluid permeability of 29-kDa MWCO polycarbonate membranes in vitro assessed from measurements of Snyder et al. [11] for effluent tubing of differing hydraulic resistances. The low resistance tubing was a 3-cm length of 120-μm i.d. FEP and the high resistance tubing was a 50-cm length of 75-μm i.d. fused silica.
| (81) |
The total effluent resistance, ℜeff, is not known, but the effluent tubing contribution can be estimated from Eq. (79). Substituting ℜout for ℜeff in Eq. (81) leads to the upper bound estimates in Table 6. As expected, the aqueous permeability of these membranes is considerably less than that of the 100-kDa asymmetric PES membrane used in the current study.
Table 6.
Upper bound on hollow fiber membrane hydraulic properties estimated from the ultrafiltration factor measurements of Snyder et al. [11] obtained by varying the perfusate flow rate into microdialysis probes with 4-mm membrane lengths.
| Membrane | Nominal molecular weight cutoff | Hm | κm ×1013 | |
|---|---|---|---|---|
| Daltons | cm2 | |||
| Polyacrylonitrile | 29,000 | 0.043 | 0.34 | |
| Polycarbonate | 20,000 | 0.021 | 0.17 | |
| Cuprophan | 6,000 | 0.016 | 0.06 |
5.3. Validating the solute transport model
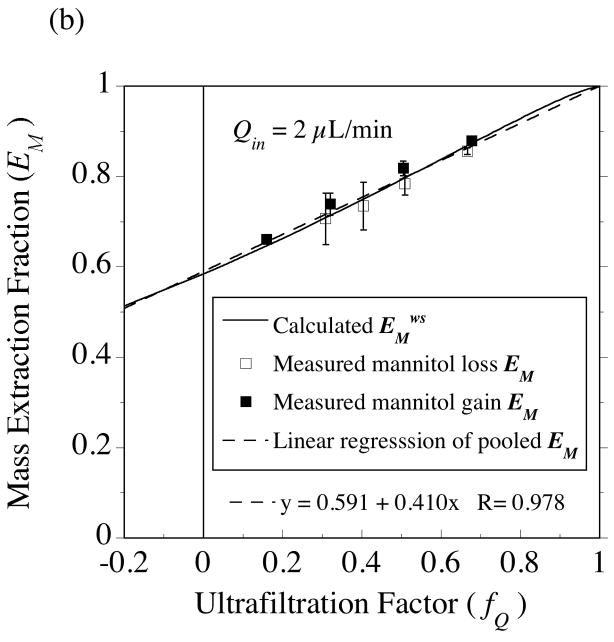
The solute transport measurements were all conducted at fixed perfusate flow rates of either 1 or 2 μL/min. Ultrafiltrate flow was altered by varying the height of the collection vial. Concurrent measurement of gain and loss extraction fractions (Fig. 9) was achieved by examining the sampling of fluorescein (FLR, MW 332.3 Da) from the bathing medium while delivering a fluorescein analog, difluorofluorescein (2FF, MW 368.29 Da). In subsequent measurements with [14C]-mannitol (MW 184.19 Da), the gain and loss extraction fractions were determined in separate experiments.
Fig. 9.
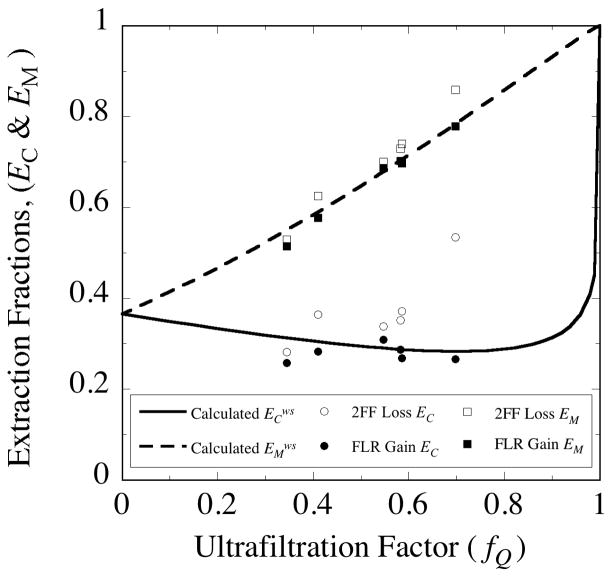
The concentration- and mass-based extraction fractions differ in their dependence on the ultrafiltration factor, fQ. Probe 3•4 from Table 5 was immersed in well-stirred bathing solution maintained at 37°C. The perfusate contained difluorofluorescein (2FF) and the bathing solution contained fluorescein (FLR) to permit concurrent measurement of FLR gain (closed symbol) and 2FF loss (open symbol) extraction fractions. The measured concentration-based (EC) and mass-based (EM) extraction fractions are distinguished by circles and squares, respectively. The corresponding curves were generated from the mathematical model Eqs. (37) and (38) simplified by the assumption of well-stirred conditions in the external medium. The calculations use the parameters in Table 1, the estimate of Da = 6.7 × 10⁻⁶ cm2/s for the free diffusion coefficient in the annulus fluid and an approximated value of Dm = 8.7 × 10⁻⁷ cm2/s for the diffusion coefficient in the probe membrane.
The concentration-based extraction fraction (EC) for gain of FLR during sampling exhibited little dependence on fQ (Fig. 9). There was wider variation in the EC values for loss of 2FF during delivery and the values were somewhat higher than those for sampled FLR, but generally of similar magnitude. The mass-based extraction fractions (EM) exhibit strong, nearly linear dependence on fQ. The probe used in these measurements exhibited a high internal hydraulic resistance (3•4, Table 5), which accounts for the high degree of ultrafiltration (0.35< fQ <0.7). The procedure for applying the solute transport model involves determining the value for the extraction fraction at the no-flux point (fQ = 0) as indicated in section 2.8. Extrapolation to the no-fluid-flux condition could not be done reliably with this data set. Instead, the value for the effective diffusion coefficient in the membrane was adjusted by trial and error to Dm = 8.7×10⁻⁷ cm2/s to generate the curves for the concentration and mass extraction fractions shown in Fig. 9. The values for the free solution diffusion coefficients were estimated from the value for sucrose assuming an inverse square root of molecular weight dependence. The ratio of the diffusion coefficient values is Dm/Da = 0.13.
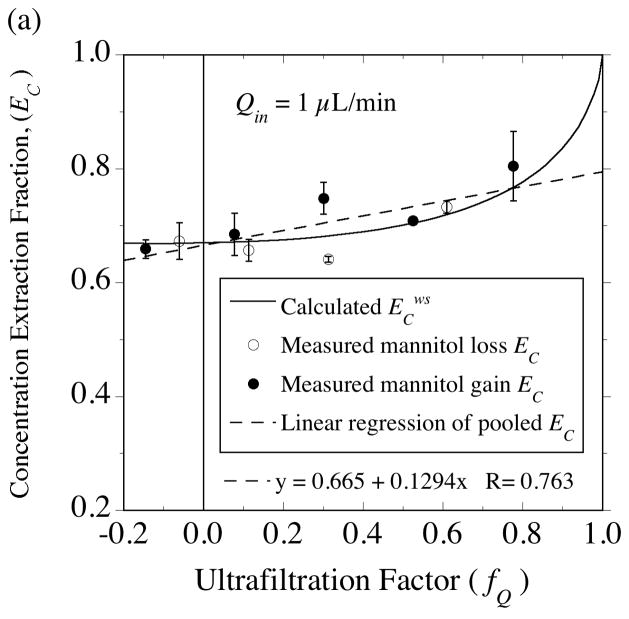
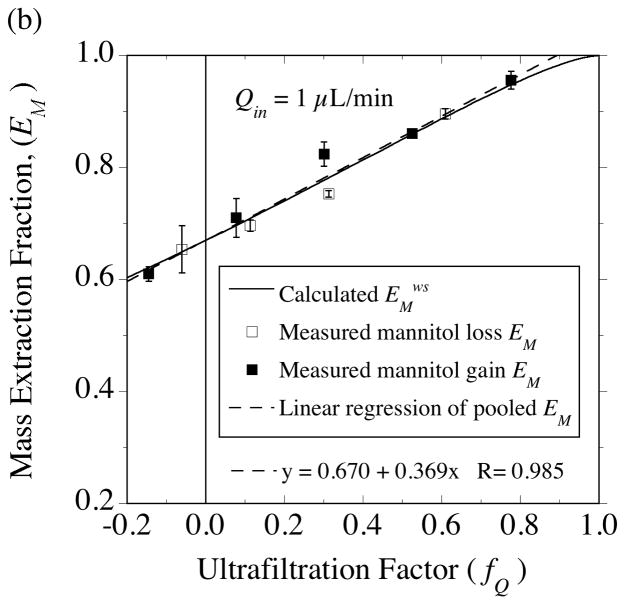
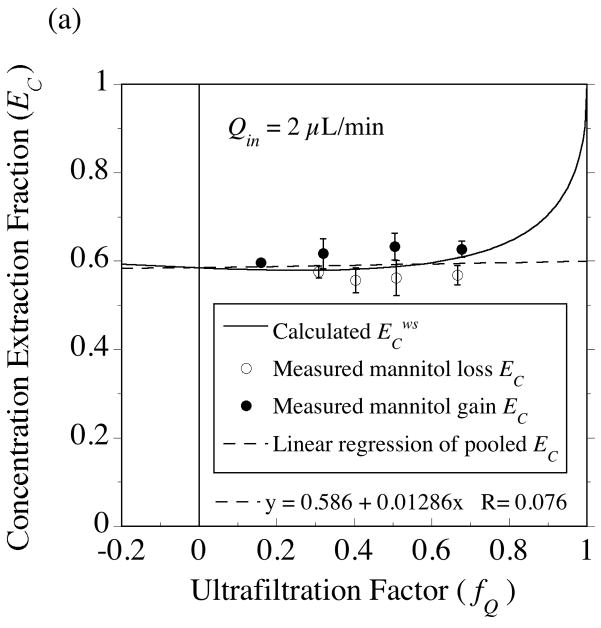
Two 4-mm PES membrane probes were used in the solute transport measurements with [14C]-mannitol. The extraction fractions were measured at an inflow rate of 1 μL/min for probe 4•2 (Fig. 10) and at 2 μL/min for probe 4•1 (Fig. 11). For the same 50-cm variation in collection vial elevation, a much larger variation in fQ is produced at 1 μL/min (−0.15≤ fQ ≤ +0.78) than at 2 μL/min (+0.16≤ fQ ≤ +0.68), as in Fig. 5b. As a result, the extraction fractions for no fluid flux (fQ = 0) could be determined by interpolation at the lower flow rate (Fig. 10), while extrapolation was required in Fig. 11. At the point of no fluid flux, solute exchange across the membrane occurs by diffusion, hence these extraction fraction intercepts permit estimation of the effective diffusion coefficient in the membrane (Dm) from Eqs. (53) and (54). Dm is the only remaining parameter in the solute transport model whose value needs to be determined from the data. Whereas mean hydraulic conductivity values were similar between the two probes (Tables 2, 3 and 4), the mannitol Dm values differed between the probes (Table 7). However, the Dm values obtained from the separate sampling and delivery experiments were close for each probe. Hence, for the purpose of comparing the extraction fraction measurements to model predictions for each probe, the sampling and delivery data were pooled to yield a common Dm value. Although it would be preferable to perform a non-linear fit of Eqs. (37) or (38) to the data to estimate the no-fluid-flux extraction fractions, simple linear regressions appear to suffice as shown for the results in Figs. 10 and 11. This seems more reasonable for regressing the mass-based extraction fractions, EM, in Figs 10B and 11B, since the predicted dependence on fQ is much closer to linear than for EC in Figs. 10A and 11A. However, for both probes, the EC intercept agreed with the EM intercept to within 1% as required by Eq. (54).
Fig. 10.
Testing the equality of gain and loss extraction fractions for [14C]-mannitol in the presence of ultrafiltration. (a) Concentration-based extraction fraction, EC. (b) Mass-based extraction fraction, EM. The gain (closed symbol) and loss (open symbol) measurements were made 9 days apart using a CMA/12 probe (4•2) with a 4-mm PES membrane immersed in vigorously stirred bathing solutions at 37°C and perfused at an inlet flow rate of 1 μL/min. The extraction fraction intercept at the point of no fluid flux (indicated by the vertical line at fQ = 0) was determined by interpolation from linear regressions (dashed lines) of the pooled gain and loss data. Under the assumption that conditions in the external medium were well stirred, the intercept was used with Eqs. (53) and (54) to obtain the estimate, Dm = 1.7 × 106 cm2/s, for the effective diffusion coefficient in the membrane (Table 7). The solid curves were calculated from the form of Eqs. (37) and (38) corresponding to the well-stirred limit.
Fig. 11.
Testing the equality of gain and loss extraction fractions for [14C]-mannitol employing the 4-mm probe (4•1) from Figs. 5 and 6 with an inlet perfusate flow rate of 2 μL/min. As indicated in the caption for Fig. 10, linear regression of the pooled gain and loss data was used. The extraction fractions were extrapolated to the point of no fluid flux from which the effective membrane diffusion coefficient was estimated to be Dm = 3.0×10⁻⁶ cm2/s.
Table 7.
Effective diffusion coefficient values for [14C]-mannitol in 100-kDa MWCO polyethersulfone membranes of CMA/12 probes at 37°C obtained from point of no-fluid-flux extraction fraction values using Eqs. (51) and (52). For each probe the values for diffusional delivery from the perfusate to the external solution were similar to the values for diffusion in the opposite direction (sampling). However, the difference in mean values between probes was significant (2 tail t-test, P<0.03). The free diffusion coefficient (Da) value used for mannitol at 37°C is 8.5 × 10⁻⁶ cm2/s [28].
| Dm×106, cm2/s | ||
|---|---|---|
| Probe 4•1 | Probe 4•2 | |
| Delivery (loss) | 2.9 | 1.6 |
| Sampling (gain) | 3.1 | 1.8 |
| Mean±SD | 3.0±0.16 | 1.7±0.08 |
| Dm/Da | 0.35 | 0.20 |
6. Discussion
In conventional microdialysis loss or gain of fluid through the membrane is minimized through system design or use of osmotic agents. The reliance on diffusion to produce solute exchange across the membrane imposes limitations. Incorporating transmembrane convection may lead to performance improvements and greater opportunities for utilizing the technology, such as improving local delivery of therapeutic agents for in vivo applications. The principal objective in the current study was to describe the influence of transmembrane flow on solute exchange to provide a knowledge base for exploiting “convective microdialysis”.
6.1. Characterizing probe hydraulic properties
A prerequisite for these studies was to be able to produce controlled, but variable, loss or gain of fluid across the membranes. For commercially available probes the necessary transmembrane pressures were achieved by a combination of varying the inflowing perfusate volumetric flow rate and the relative vertical positions of the effluent collection vial and the probe. These procedures altered the dynamic and hydrostatic pressure contributions to the transmembrane pressure, respectively. Gravimetric measurement of the probe effluent, together with mathematical modeling, permitted the evaluation of membrane fluid conductivities and effluent hydraulic resistances for probes with an MWCO of 100 kDa (Tables 2–5). Table 5 includes illustrative probe internal hydraulic resistance values, ℜint, estimated by subtracting the tubing contribution from the overall effluent resistance, ℜeff. The ability to assess the internal resistance can provide an indication of undesirable problems, such as leaks or constrictions to dialysate flow within the probe that could affect probe performance by altering the degree of ultrafiltration. The results in Table 5 suggest that differences in ultrafiltration between nominally identical probes are more likely to arise from high interprobe variability in ℜint, rather than from variation in membrane hydraulic conductivity.
Upper bounds on the membrane hydraulic conductivity were also estimated from published fluid loss measurements on other commercial microdialysis probes with 6, 20 and 29-kDa MWCO membranes (Table 6). However, the absence of hydrostatic pressure data precluded the estimation of internal hydraulic resistances for these probes.
6.2. Equality of sampling and delivery extraction fractions
Solute exchange between the perfusate and the external medium was then examined by determining loss and gain extraction fractions for several fluorescent or radiolabeled low-molecular-weight tracer solutes. Equality was obtained between sampling (gain) and delivery (loss) extraction fractions in the presence of transmembrane convection, thus supporting a key prediction from the linear solute transport model. This equality is important because it means that probes can be calibrated in the presence of transmembrane convection using the same techniques developed for traditional diffusional microdialysis, such as retrodialysis and no-net flux that involve delivery of a calibrator solute from the perfusate to the external medium.
The equality of gain and loss extraction fractions would have been expected from the dimensional concentration profiles in Fig. 2 that are applicable regardless of the direction of diffusion and convection. The profiles of the normalized concentration for solute delivery are mirror images of the profiles for solute sampling. In both situations, transmembrane convection causes the concentration profiles to bow in the direction of fluid flow.
This result arises from the linearity of the governing equations. Linearity imposes constraints, such as the absence of appreciable concentration polarization [19] of the solute in the annular and external solutions. The 100-kDa MWCO probes used in the experiments were intended, in part, for use with higher molecular weight solutes for which the effect of concentration polarization could be an important consideration. This may have been a factor in the large discrepancies between gain and loss extraction fractions obtained by Li et al. [7] for 10-kDa and 70-kDa dextrans with probes constructed from a 3,000 kDa MWCO polyethersulfone hollow fiber. The discrepancies were only obtained when transmembrane flow was inward. No significant differences were noted in the absence of ultrafiltration or when the flow was outward. If concentration polarization was a factor in this result, the asymmetric structure of the membrane may also have played a role.
6.3. Influence of transmembrane convection on extraction fraction
Although equality is predicted, the magnitude of both gain and loss extraction fractions varies with fQ and other parameter values. The dependence of the mass-based extraction fraction, EM, is a strong and monotonically increasing function of fQ as illustrated by Figs. 9, 10B and 11B. This monotonic behavior corresponds to the predictions in Fig. 3 in which the total outward solute flux across the membrane is reduced by inward fluid flux ( < 0) and increased by outward fluid flux (
 > 0).
> 0).
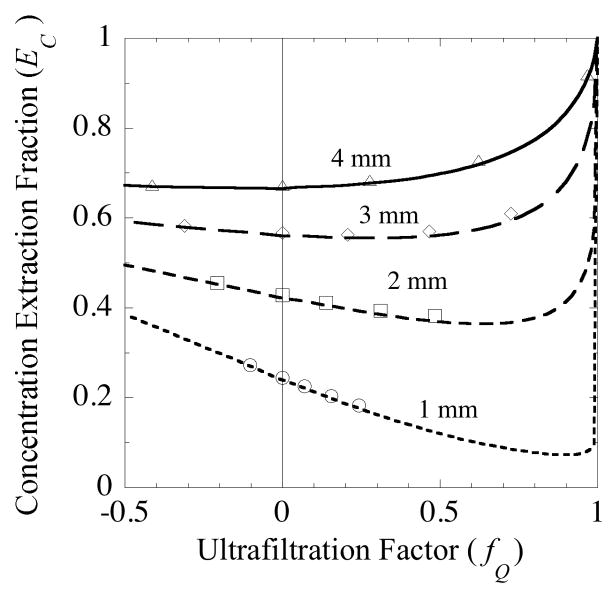
The concentration extraction fraction, EC, has a much different dependence upon fQ than EM. EC always exhibits a minimum, since it approaches unity for both extremes of fQ → − ∞ and fQ → +1. The model predicts there is a steep increase in EC as fQ → 1. However, there are conditions over which the variation in EC with fQ is weak, as for example for mannitol in Figs. 10A and 11A for small and moderate values of fQ. Snyder et al. [11] found no significant variation in EC with fQ for uric acid and phenothalein glucuronide for polycarbonate membrane probes with ultrafiltration fractions in the range 0.02–0.17 and polyacrylonitrile membrane probes with fQ from 0.03–0.13. This weak dependence is probably not true, in general, as indicated by Fig. 12. The family of curves in this figure is based on the mannitol parameter values from the data in Fig. 10. The only parameter that has been altered is the length of the membrane. The curve for a 4-mm long membrane with a weak dependence over most of the fQ range is the same as that in Fig. 10a. However, for successively shorter membrane segments, the fQ-dependence becomes progressively more pronounced.
Fig. 12.
Comparison of concentration extraction fraction values for mannitol predicted by the analytical model (line plots) and the finite element simulation (symbols). Results are shown for membrane lengths of 1, 2, 3 and 4 mm. All other parameter values correspond to those used in analyzing the data in probe (4•2) from Fig. 10, consequently the 4-mm curve in this figure is the same as that in Fig. 10a.
6.4. Inward ultrafiltration increases concentration extraction fraction
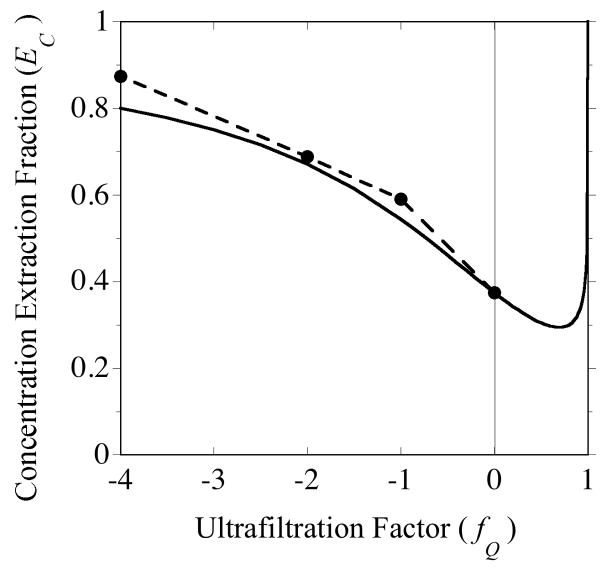
As noted in the previous section, increasing inward transmembrane flow tends to elevate EC. The portions of the curves in Fig. 12 for fQ < 0 illustrate this behavior. Li et al. [7] found higher EC gain values for all solutes tested when flow was inward than either in the absence of ultrafiltration or when flow was outward. This finding included small solutes (glucose, lactate and phenol red), dextrans (10- and 70-kDa) and proteins (lysozyme and bovine serum albumin).
Kjellström et al. [21] proposed exploiting this propensity by controlling the perfusate and dialysate flow rates with separate “push” and “pull” pumps, respectively. With the same 100-kDa membrane as in our measurements, these authors obtained higher extraction fractions sampling five model proteins with inward ultrafiltration than by conventional diffusional microdialysis. The current mathematical model does not incorporate concentration polarization, which is promoted by inward flow across the outer membrane surface. This may account for discrepancies between the experimental data and model simulations. However, the model does capture the trend for one of the proteins, α-lactalbumin (MW 14 kDa), as shown in Fig. 13. In addition to increasing EC, inward flow can greatly increase the mass flow rate of the analyte into the sample as indicated below.
Fig. 13.
Inward ultrafiltration (negative fQ) increases the concentration extraction fraction as illustrated by sampling of α-lactalbumin (MW 14 kDa) from a stirred external solution. The filled circles represent experimental measurements from Fig. 4 of Kjellström et al. [21] and the solid line was generated from model Eq. (37). The experiments utilized a polysulfone membrane with an MWCO of 100 kDa and overall accessible length of 25 mm. The effective diffusion coefficient of the protein was estimated from extraction fraction measurements obtained under non-ultrafiltering conditions.
6.5. Transmembrane mass flow rates
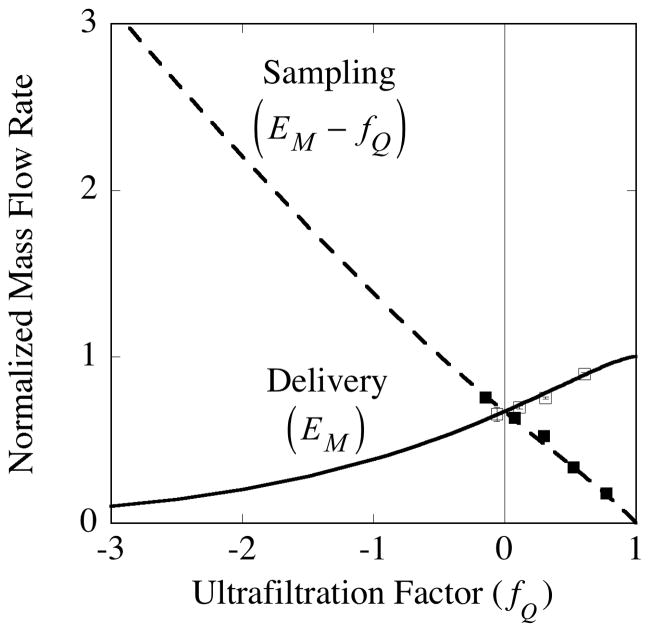
Although the symmetry between gain and loss also applies to the mass extraction fraction, EM, as defined in Eq. (34), it is important to stress that the analyte mass flow rate across the membrane at any fQ value is different between sampling and delivery modes. To illustrate this, consider the solute mass flow from the perfusate to the external medium during a delivery experiment. From Eq. (34) the normalized rate of solute mass flow is given by
| (82) |
whereas the corresponding mass flow rate from the external medium to the dialysate for the sampling experiment is
| (83) |
in which EM in both of the above equations can be calculated from Eq. (38). For these normalized definitions, the mass flow rates are positive even though the direction of mass flow for Eq. (82) is opposite to that for Eq. (83). The direction of mass flow is determined by the direction of the diffusional contribution. For these experiments, convection can modify the magnitude, but cannot reverse the direction of mass flow across the membrane.
The difference between the delivery and sampling rates predicted by the above equations is illustrated for mannitol in Fig. 14. The parameter values obtained from the data in Fig. 10 were used to calculate the curves. Similarly, the points are derived from the data in Fig. 10. Figure 14 provides a quantitative demonstration of the degree to which outward ultrafiltration (fQ > 0) can be used to enhance the mass rate of delivery, while inward ultrafiltration (fQ < 0) augments the mass sampling rate. For an application in which one analyte is being delivered while another is sampled, ultrafiltration will improve one rate and diminish the other depending upon whether the value of fQ is chosen to be positive or negative. As expected, in the limit at which all of the perfusate is ultrafiltered (fQ = 1), there is no sample to collect, (dM / dt)sampling = 0, and the normalized delivery rate is complete, (dM / dt)delivery = 1. At the inward ultrafiltration extreme (fQ → −∞), delivery vanishes, (dM / dt)delivery → 0, and the sampling rate becomes positively unbounded, (dM / dt)sampling → −fQ. Thus, in the trade-off between sampling and delivery rates, the ability to alter the magnitude and direction of ultrafiltrate flow ought to provide a valuable additional optimization tool.
Fig. 14.
Ultrafiltration produces opposing changes in the analyte mass flow rates between sampling and delivery. The solid squares represent experimentally derived values for dialysate gain during sampling of mannitol, while the open squares represent mannitol loss from perfusate during delivery experiments. The curves are calculated from the model equations for the normalized rate of mass flow. The parameter values for the calculations were obtained from the pooled data for probe (4•2) in Fig. 10. The normalized delivery mass flow rate from the perfusate to the external medium is the same as the mass extraction fraction, EM, according to Eq. (82), while the normalized sampling flow rate from the external medium to the dialysate is EM − fQ by Eq. (83). Because of normalization the mass flow rates are positive even though the direction of mass flow is opposite between the sampling and delivery conditions.
6.6. Finite element simulations used to validate analytical model assumptions
As indicated at the beginning of section 2, a number of simplifying assumptions were employed in developing the analytical models. To substantiate some of the assumptions more complete model equations were solved numerically by finite element analysis using Comsol Multiphysics (Comsol, Inc., Burlington, MA). Two-dimensional, axisymmetric steady-state velocity profiles were obtained by simultaneously solving the Navier-Stokes equations in the annulus and the Brinkman equations for flow through the membrane. The expression for fully developed laminar flow was used as the axial velocity condition at the annulus inlet. Transmembrane flow was achieved by imposing pressures differences between the annulus outlet and the outer surface of the membrane. The resulting velocities were then used to obtain concentration profiles by solving Eq. (12) for the membrane and the corresponding differential mass balance for diffusion and convection in the annulus. The parameter values in Table 1 were supplemented with a membrane Darcy permeability of κm = 2.6×10⁻¹³ cm2 and diffusivities of 8.5×10⁻⁶ and 1.7×10⁻⁶ cm2/s for mannitol in the annulus and membrane, respectively. The defaults provided by Comsol were used for the solver parameters.
As an overall test of the solute transport analytical model, probe performance under well-stirred conditions was simulated. Analytical model predictions are in good agreement with finite element results as illustrated by the concentration extraction fraction calculations in Fig. 12. The agreement lends support to the assumptions in this model, such as the additivity of diffusive and convective contributions to solute transport in the annulus invoked in developing Eq. (6). Some of the other major assumptions are addressed individually in the following sections.
6.7. Axial uniformity of ultrafiltrate flux
Both the solute and fluid transport models in sections 2 and 3 assume that the transmembrane fluid flux is the same at any axial location, implying uniformity in the transmembrane pressure drop. This is a valid approximation when the pressure drop along the probe annulus is small compared to the mean transmembrane pressure drop. According to Eq. (63) the annulus axial pressure drop is given by
| (84) |
This equation assumes the membrane remains cylindrical and concentrically aligned with respect to the inner cannula [18]. Deviations from these assumptions would tend to reduce the pressure drop. Equation (84) indicates that an upper bound on the pressure drop can be estimated as ℜa·Qmax, where Qmax is the larger of Qin and Qout. This follows because fQ is positive for leakage out of the probe (Qin>Qout ) and negative for inward accumulation of fluid across the membrane (Qin<Qout).
In the experiments the probe temperature was maintained at 37°C, while the effluent tubing was exposed to room temperature. Heat transfer calculations suggest that the effluent fluid temperature equilibrates with that of the tubing within a short distance along the tubing. The average room temperature during the in vitro measurements was 23.5°C. From Eq. (79) the estimated flow resistance of 50-cm of effluent tubing for this temperature is ℜout = 15.4 cm H2O · min/ μL. The corresponding outflow pressure drop would be Δpout= ℜout· Qout = 15.4 cm H2O for a flow rate of Qout = 1 μL/min. The pressure drop within the annulus fluid at this flow rate is Δpa = 0.01 cm H2O, as estimated from Eq. (84) when there is no net ultrafiltration (fQ = 0). This value is small compared to both Δpout and the Δpint calculable from ℜint derived from the fits to the experimental data. Consequently, the spatial variation in pressure along the inner surface of the membrane is small compared to the magnitude of the transmembrane pressure, Δpm, from Eq. (66), except when Δh is sufficiently negative to bring Δpm close to zero. Although the uniform transmembrane flux assumption may not be valid for a situation in which Δpm is small and comparable to Δpa, the flux is also small in such a case. These estimates provide justification for assuming that uniform flux was achieved in these experiments. The validity of the assumption may be different for other probes because the pressure drops depend upon the fourth power of the radii of the annulus in Eq. (84) and of the effluent tubing in Eq. (79). By appropriate consideration of these factors, relatively uniform ultrafiltration appears readily achievable.
6.8. Membrane diffusive permeability
The membrane diffusive permeability is a function of the transmembrane fluid flow. Hence establishing the near axial uniformity of fluid flux in the previous section provides justification for the model assumption that the membrane permeability does not vary in the axial direction. However, the scheme used for estimating the membrane diffusive permeability involves interpolation to the condition of fQ = 0. This constraint only implies that there is no net transmembrane fluid movement for the membrane as a whole, whereas the estimation scheme assumes the fluid is stagnant everywhere within the membrane. This assumption is inconsistent with the existence of a non-zero axial pressure drop in the annulus fluid. It is likely that there is some outward flow in the upstream half of the membrane and inward flow across the downstream half, although these flows should be small as a corollary to the arguments in the previous section that the annulus pressure drop is small for the short membrane lengths employed in this study. Kanamori et al. [20] suggested that this unavoidable local variation in transmembrane flow influences the calculated diffusive permeability values, but less than expected even for longer membrane lengths than were used in the current experiments. Finite element simulations for the case of fQ = 0 provided further support for the conclusion that axial variations in transmembrane flow were small in the current experiments.
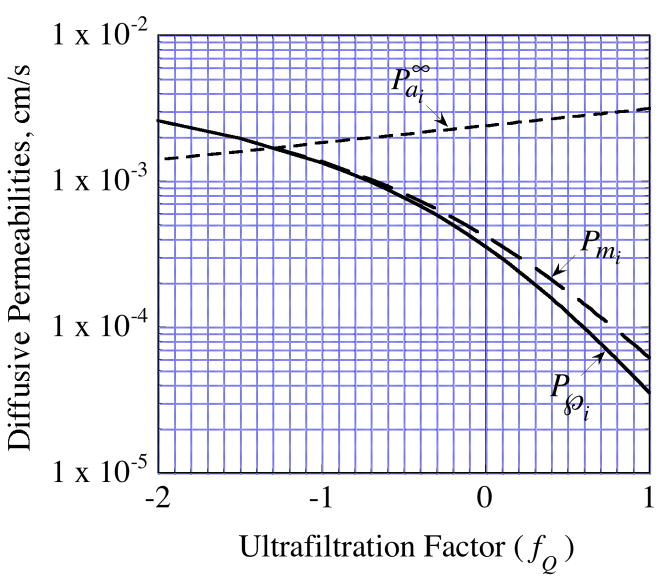
In the absence of transmembrane convection, the membrane permeability is typically small compared to the annulus permeability. However, this may change when transmembrane flow occurs because the effect on two permeabilities differs. Figure 15 illustrates a situation in which the model predicts that inward convection will produce a reversal in the relative magnitudes of the two permeabilities. However, the membrane permeability is the dominant contributor to the overall permeability,  , over the full range of fQ.
Fig. 15.
Analytical model prediction for the effect of transmembrane fluid flow on mannitol diffusive permeabilities in a probe of the same characteristics as (4•2), but with a 1-mm membrane length. The annulus permeability,
, was calculated from Eq. (A.6), the membrane permeability, Pmi, from Eq. (45) and the overall permeability,  , from Eq. (32) for a well-stirred external medium (Pext = 0).
6.9. Membrane effective diffusivities
The membrane effective diffusion coefficient is the one physical parameter that is evaluated from the experiments. Conversely, it is the one probe characteristic, in addition to the geometric parameters, that is necessary for using the model to predict behavior for other probes and other solutes. Schutte et al. [22] made effective Dm measurements for proteins and dextrans of a wide range of molecular weights in 100-kDa polyethersulfone membranes using a different model microdialysis probe from the same manufacturer as in the current study. These authors measured dialysate sample weights in their experiments and reported no mean transmembrane flow, but a wide variation in fluid gain and loss (fQ = 0.0±0.4). Reanalyzing the data of Schutte et al. [22] with the solute transport model of section 2 for fQ = 0 yielded the Dm / Da values in Table 8. Except for the smallest solute pair, the Dm / Da values were of similar magnitude between proteins and dextrans, but considerably smaller than the mean value of 0.28 for 184-Da [14C]-mannitol from Table 7 and the mean value of 0.13 for FLR and 2FF with an average molecular weight of 350 Da.
Table 8.
Effective diffusion coefficient values for proteins and dextrans in 100-kDa MWCO polyethersulfone membranes of CMA probes obtained by reanalyzing data from the literature. The calculations employed the radii values in Table 1 and the solute transport model of section 2 for the situation of no transmembrane convection.
| From data of Schutte et al. [22] |
From data of Trickler [3] |
||||
|---|---|---|---|---|---|
| Proteins | Dm / Da | Dextrans | Dm / Da | Dextrans | Dm / Da |
| Insulin (5.7 kDa) | 0.07 | 3 kDa | 0.18 | 3 kDa | 0.08 |
| Lysozyme (14.4 kDa) | 0.08 | 10 kDa | 0.08 | 10 kDa | 0.07 |
| SBTIa (20.1 kDa) | 0.08 | 20 kDa | 0.05 | 19 kDa | 0.05 |
| Ovalbumin (45 kDa) | 0.06 | 40 kDa | 0.08 | 40 kDa | 0.07 |
| BSAb (66.2 kDa) | 0.07 | 70 kDa | 0.07 | ||
| IgGc (150 kDa) | 0.02 | 150 kDa | 0.02 | ||
Soybean trypsin inhibitor,
Bovine serum albumin,
Immunoglobulin G
Trickler and Miller [3] used the equivalent of Eq. (40) to calculate overall permeability-area products for fluorescein and dextrans in the absence of ultrafiltration. These authors used the same model CMA/12 probes with 4-mm PES membranes as we did. They prevented the ultrafiltration by adding bovine serum albumin to the perfusate as an osmotic agent to counteract the effluent backpressure. Their measurements were made at room temperature with the probes immersed in a well-stirred solution of the analytes. For an assumed constant temperature of 23°C, Dm / Da values calculated using Eq. (53) for the dextrans are given in Table 8. The values are consistent with those obtained from the measurements of Schutte et al. [22].
Trickler and Miller [3] reported fluid loss occurred when the probes were perfused with the same buffered electrolyte solution as that used for the external medium. The ultrafiltration factor of the order of fQ = 0.16 appeared to be independent of Qin. The outward ultrafiltration reduced extraction fraction values for all of the analytes as predicted by the model of section 2. In calculating overall permeability-area products as the slopes of linear regressions between −ln[1− EC]and 1 / Qin, Trickler and Miller [3] implicitly assumed that membrane permeability is independent of transmembrane fluid flux. This is in conflict with Eqs. (45) and (46) that predict the permeability to be a function of membrane Péclet number.
6.10. Membrane asymmetry
The polyethersulfone membrane in the CMA probes is asymmetric in structure with a thin inner layer of lower permeability supported by a thick open outer layer [23]. The solute transport model as presented applies to membrane of uniform properties. However, since it is a linear model, it is amenable to modification to describe transport across layers of a composite membrane in which the properties of the individual layers are separately uniform but different in value. In the present results, properties values such as the effective diffusion coefficient in the membrane represent weighted averages of the contributions of the layers.
6.11. External medium permeability
It has been assumed that well-stirred conditions were obtained in the solute transport measurements. This assumption was not verified. The same degree of vigorous stirred was maintained for all of the measurements. The presence of a non-negligible contribution by the external medium permeability term to Eq. (54) could have caused the effective membrane diffusion coefficients to be underestimated. Any underestimation would likely have been comparable in the sampling and delivery experiments and, if so, not have resulted in a difference between the gain and loss extraction fractions.
7. Conclusions
We have delineated the influence of ultrafiltration in the use of microdialysis probes for sampling and delivery of low molecular weight solutes. The principal limitations in the treatment are the neglect of concentration polarization in the internal and external fluids and the assumption of concentration linearity. The mathematical expressions obtained are readily programmed in spreadsheet software for the design and interpretation of experiments. As a consequence of linearity, equality of sampling and delivery extraction fractions is retained in the presence of ultrafiltration. Thus, the solute calibration techniques employed in traditional diffusion-based microdialysis remain applicable. This permits sampling for estimating external fluid concentrations while simultaneously utilizing transmembrane convection to improve rates of delivery from perfusate to the external medium. The ultrafiltrate flow is affected by probe internal hydraulic resistance, which can vary considerably among nominally identical probes. Quantitative protocols should probably include determination of mass and fluid transport characteristics for each probe when encountering substantial transmembrane convection. For probes with high molecular weight cutoff membranes and attendant high hydraulic conductivities, ultrafiltration is difficult to avoid without the use of separate pumps for the afferent and effluent streams [7, 21]. The current analysis provides a basis for assessing the effect of ultrafiltration on extraction fractions, whether unintended or deliberately imposed for the purpose of enhancing sampling or delivery capabilities.
Acknowledgments
This research was supported [in part] by the Intramural Research Programs of the NIH, including the National Institute of Biomedical Imaging and Bioengineering. The authors are grateful to Dr. Robert L. Dedrick for his critical assistance in preparation of the manuscript and to Professor Rueben A. Gonzales for establishing that backpressure from effluent flow can produce transmembrane fluid loss in probes constructed from low fluid permeability cellulosic membranes. The latter observation was the initial stimulus for the present analysis.
Abbreviations
- aCSF
artificial cerebrospinal fluid
- CED
convection-enhanced delivery
- 2FF
difluorofluorescein
- FLR
fluorescein
- MW
molecular weight
- MWCO
molecular weight cutoff
- PES
polyethersulfone
Nomenclature
- b
intercept
- C
solute concentration
- D
diffusion coefficient
- d
diameter
- E
extraction fraction
- fQ
ultrafiltration factor defined in Eq. (2)
- g
gravitational constant
- H
hydraulic conductivity
- h
height
- J
fluid volume flux in radial direction
- L
length
- M
mass
- m
slope
- N
solute mass flux in radial direction

nondimensionalized diffusive permeability (Nusselt number)
- P
diffusive permeability
- p
pressure

Péclet number
- Q
volumetric flow rate
- ℜ
hydraulic resistance
- r
radial position relative to probe axis
- S
superficial area of membrane exchange surface
- t
time
- v
velocity
- z
axial position relative to inlet end of membrane exchange surface
Greek letters
- η
viscosity
- κ
Darcy conductivity
- ρ
density
- ς
ratio of annulus radii
- ξ
ratio of overall permeability to the ultrafiltrate flux
Subscripts
- a
annulus
- app
apparent value
- C
concentration basis
- cann
inner cannula
- d
dialysate
- dyn
dynamic
- eff
effluent dialysate
- ext
external medium
- f
fluid phase in membrane
- h
related to varying the height of dialysate collection vial
- hyd
hydrostatic
- i
inner surface of membrane
- in
inlet end of membrane exchange surface
- int
effluent fluid internal to probe
- j
index number
- M
mass basis
- m
membrane; based on whole membrane volume
- o
outer surface of membrane
- out
outlet end of membrane exchange surface or outflow tubing

probe (annulus fluid+membrane)
- Q
volumetric flow rate basis
Superscripts
- ws
well-stirred conditions
- ∞
spatial asymptote in radial or axial direction
Diacritical marks
- ¯
flow-rate-weighted radial average in the annulus
- ′
dimensional variable
- _
vector
Brackets
- [ ]
follows a function symbol to indicate the variables upon which it depends
- 〈 〉
axial average from z′ = 0 to z′ = Lm
Appendix: Diffusive permeability of annulus fluid
The permeability, Pai, introduced in Eq. (6) to represent the diffusive contribution to solute exchange between the annulus fluid and the membrane is generally a function of axial position and should vary with the rates of annular and transmembrane fluid flow. As with the other permeabilities in the model, under linear conditions Pai is the same for analyte transport into or out of the annulus, i.e., for both sampling and delivery modes. This symmetry is maintained in the presence of transmembrane convection. As indicated in section 6.8, Pai is expected to have a minor influence compared with the membrane diffusive permeability, Pmi. This suggested that the overall analysis could be facilitated by developing a simple expression to estimate values for Pai as follows.
We first computed values for Pai over a wide range of axial and transmembrane flow conditions from defining Eq. (29). The calculations employed the concentration profiles obtained by simultaneously solving the two dimensional, axisymmetric, steady-state incompressible Navier-Stokes equations and the differential balance for convective and diffusive mass transport. The computations utilized the finite element software Comsol Multiphysics (Comsol, Inc., Burlington, MA) with default solver parameters. The boundary conditions for concentration were uniform, but different, values at the annulus inlet and on the annulus-membrane interface. No-flux, no-slip conditions were imposed on the inner wall of the annulus. The fully developed annulus velocity profile was applied at the inlet. Inward and outward convection at the membrane interface was generated through setting either a positive or negative, but uniform, radial velocity across this surface. The annulus Reynolds number varied from 0.005 to 5 in the simulations, a much broader range than in the experiments for which the maximum value was of the order of 0.2.
When nondimensionalized as the Nusselt number,  ≡ da · Pai/Da, the permeability for a concentric annulus becomes a function of the dimensionless axial position,
. The latter is defined to reduce to the reciprocal of the Graetz number in the absence of the internal cannula. The Graetz number appears in the analysis of heat and mass is the transfer in flow through tubes of uniform cross-section. In these dimensionless groups, v̄z annulus average fluid velocity in the axial direction and da is the hydraulic diameter
| (A.1) |
The annulus permeability approaches asymptotic values when the dimensionless axial position exceeds about 0.1, as shown by the curves in Fig. A1. The asymptotic values, to be denoted by
, appear to be good approximations for microdialysis probes. For example, the dimensionless axial position for mannitol at the outlet of a 4-mm CMA/12 probe perfused at 1 μL/min with no ultrafiltration is calculated to be 0.7 at 37°C, which is a value well along on the asymptotic portion of the curve in Fig. A1 labeled  = 0. The corresponding outlet dimensionless axial position for solutes as large as albumin would still be essentially within the asymptotic range. The asymptotic value provides a lower bound for Pai. Since the influence of annulus permeability on extraction fraction is a function of the reciprocal, 1/Pai, the asymptotic value serves as measure of the maximal effect. Furthermore, the asymptote,
, is employed in the definition of the overall diffusive permeability, Eq. (32), to remove dependence upon axial position, which greatly simplifies the expression obtained for the extraction efficiency.
Fig. A1.
Annulus diffusive permeability, Pai, calculated by finite element analysis for a concentric annulus delineated by the outer radius of the cannula, rcann, and the inner radius of the membrane, ri, for a value of the ratio, ς = rcann/ri = 0.61. The ordinate is the dimensionless Nusselt number. The abscissa is the axial distance from the inlet end of the membrane, z′, rendered dimensionless by the solute free solution diffusion coefficient, Da, the hydraulic diameter, da = 2· (ri−rcann) and the mean annulus fluid velocity in the axial direction, v̄z. The influence of fluid loss or gain is a function of the radial Péclet number,  = da·Ji/Da, in which Ji is the fluid flux across the interface at r = ri. The solid curve represents no convective flux across the interface (
 = 0), the dotted curve illustrates that inward convection (
 = −1) reduces the permeability and the dashed curve illustrates that outward convection (
 = +1) increases the permeability.
When fluid is gained or loss at a uniform flux across the annulus wall, Ji, the permeability also becomes a function of the annulus radial Péclet number
| (A.2) |
The change in  produced by ultrafiltration is illustrated in Fig. A1 by the curves for outward flow (
 = +1) and inward flow (
 = −1). The asymptote varies exponentially with the Péclet number, as indicated by the following regression equation obtained from asymptote values calculated for −5 ≤
  ≤ +5
≤ +5
| (A.3) |
The dependence is relatively weak as indicated by the magnitude of the coefficient, 0.111, multiplying  . The radial Péclet number can vary over a wide range, but for comparison, the maximum value for mannitol with outward ultrafiltration from CMA/12 probes perfused at 1 μL/min is approximately
  = 0.6.
The permeability is a function as well of the annulus radius ratio, ς = rcann/ri. The curves in Fig. A1 were generated for the CMA/12 probe value of ς =0.61. For application to most microdialysis situations, it should be sufficient to determine the dependence of just the asymptotic values,
. This can be done by finite element analysis. However, the dependence in the special case of no transmembrane flow ( = 0) is already known from analysis of fully developed heat transfer. Figure A2 was constructed from values tabulated by Lundberg et al. [24] for heat transfer in flow through annular passages (0 <
  <1), together with values for the two bounding cases of
  = 0 and
  = 1. The value for
  = 0 from Kays [25] corresponds to the step change in wall surface temperature for fully developed flow in a circular tube. The value for
  = 1 from Hatton & Quarmby [26] corresponds to the step change in wall surface temperature for fully developed flow between parallel plates. Except for
  values close to zero,
varies nearly linearly with
  and the asymptotic permeability can be estimated from the empirical relation
Fig. A2.
The asymptotic values of the normalized annulus diffusive permeability (asymptotic Nusselt number) vary almost linearly with the ratio of the annulus radii, except in the tube flow limit (ς = 0). The symbols are the same as in Fig. A1, except for
, which is the asymptotic value of Pai. Only values for no convection across the annulus walls are shown. Consequently, the asymptote for the  = 0 curve from Fig. A1 corresponds to the value on this plot at ς = 0.61.
| (A.4) |
For microdialysis probes that do not have an internal cannula, historically denoted as “linear” probes in microdialysis literature, the asymptotic permeability can be estimated from the solution for a step change in uniform surface concentration in tube flow
| (A.5) |
If all other factors are the same, this indicates that removal of the inner cannula leads to a lower asymptotic value. However, this may be counterbalanced by larger Graetz numbers and increase in the Pai averaged over the length of the membrane.
Finally, combining Eqs. (A.3) and (A.4) leads to a simple semi-empirical relation for approximating the annulus permeability for microdialysis probes with a concentric internal cannula in the presence or absence of transmembrane convection
| (A.6) |
This method of estimation is an improvement over the single value derived from the solution for the step change in solute flux into a planar membrane as proposed by Bungay et al. [16], which corresponds to
| (A.7) |
Footnotes
Publisher's Disclaimer: This is a PDF file of an unedited manuscript that has been accepted for publication. As a service to our customers we are providing this early version of the manuscript. The manuscript will undergo copyediting, typesetting, and review of the resulting proof before it is published in its final citable form. Please note that during the production process errors may be discovered which could affect the content, and all legal disclaimers that apply to the journal pertain.
Contributor Information
Peter M. Bungay, Email: bungayp@mail.nih.gov.
Tianli Wang, Email: wangx826@tc.umn.edu.
Hua Yang, Email: yang@mpi.com.
William F. Elmquist, Email: elmqu011@umn.edu.
References
- 1.Rosdahl H, Ungerstedt U, Henriksson J. Microdialysis in human skeletal muscle and adipose tissue at low flow rates is possible if dextran-70 is added to prevent loss of perfusion fluid. Acta Physiol Scand. 1997;159:261–262. doi: 10.1046/j.1365-201X.1997.123358000.x. [DOI] [PubMed] [Google Scholar]
- 2.Hamrin K, Rosdahl H, Ungerstedt U, Henriksson J. Microdialysis in human skeletal muscle: effects of adding a colloid to the perfusate. J Appl Physiol. 2002;92:385–393. doi: 10.1152/jappl.2002.92.1.385. [DOI] [PubMed] [Google Scholar]
- 3.Trickler W, Miller DW. Use of osmotic agents in microdialysis studies to improve the recovery of macromolecules. J Pharm Sci. 2003;92:1419–1427. doi: 10.1002/jps.10410. [DOI] [PubMed] [Google Scholar]
- 4.Asai S, Kohno T, Ishii Y, Ishikawa K. A newly developed procedure for monitoring of extracellular proteins using a push-pull microdialysis. Anal Biochem. 1996;237:182–187. doi: 10.1006/abio.1996.0226. [DOI] [PubMed] [Google Scholar]
- 5.Sjögren S, Svensson C, Anderson C. Technical prerequisites for in vivo microdialysis determination of interleukin-6 in human dermis. Br J Dermatol. 2002;146:375–382. [PubMed] [Google Scholar]
- 6.Winter CD, Iannotti F, Pringle AK, Trikkas C, Clough GF, Church MK. A microdialysis method for the recovery of IL-1 beta, IL-6 and nerve growth factor from human brain in vivo. J Neurosci Methods. 2002;119:45–50. doi: 10.1016/s0165-0270(02)00153-x. [DOI] [PubMed] [Google Scholar]
- 7.Li Z, Hughes D, Urban JPG, Cui Z. Effect of pumping methods on transmembrane pressure, fluid balance and relative recovery in microdialysis. J Membrane Sci. 2008;310:237–245. [Google Scholar]
- 8.Rosenbloom AJ, Ferris R, Sipe DM, Riddler SA, Connolly NC, Abe K, Whiteside TL. In vitro and in vivo protein sampling by combined microdialysis and ultrafiltration. J Immunol Methods. 2006;309:55–68. doi: 10.1016/j.jim.2005.11.013. [DOI] [PubMed] [Google Scholar]
- 9.Rosenbloom AJ, Sipe DM, Weedn VW. Microdialysis of proteins: Performance of the CMA/20 probe. J Neurosci Methods. 2005;148:147–153. doi: 10.1016/j.jneumeth.2005.04.018. [DOI] [PubMed] [Google Scholar]
- 10.Gonzales RA, Tang A, Robinson DL. Quantitative microdialysis for in vivo studies of pharmacodynamics. In: Lui Y, Lovinger DM, editors. Methods in Alcohol-Related Neuroscience Research. CRC Press; Boca Raton: 2002. pp. 287–317. [Google Scholar]
- 11.Snyder KL, Nathan CE, Yee A, Stenken JA. Diffusion and calibration properties of microdialysis sampling membranes in biological media. Analyst. 2001;126:1261–1268. doi: 10.1039/b102488b. [DOI] [PubMed] [Google Scholar]
- 12.Bungay PM, Gonzales RA. Pressure-enhanced delivery of solutes in in vivo microdialysis. 7th International Conference on in vivo Methods: Monitoring Molecules in Neuroscience; Santa Cruz de Tenerife: The University of La Laguna; 1996. pp. 17–18. [Google Scholar]
- 13.Morrison PF, Laske DW, Bobo H, Oldfield EH, Dedrick RL. High-flow microinfusion: tissue penetration and pharmacodynamics. Am J Physiol. 1994;266:R292–R305. doi: 10.1152/ajpregu.1994.266.1.R292. (Regulatory Integrative Comp. Physiol. 35) [DOI] [PubMed] [Google Scholar]
- 14.Oh S, Odland R, Wilson SR, Kroeger KM, Liu C, Lowenstein PR, Castro MG, Hall WA, Ohlfest JR. Improved distribution of small molecules and viral vectors in the murine brain using a hollow fiber catheter. J Neurosurg. 2007;107:568–577. doi: 10.3171/JNS-07/09/0568. [DOI] [PMC free article] [PubMed] [Google Scholar]
- 15.Bungay PM, Yang H, Wang T, Elmquist WF. Expanding microdialysis capabilities by incorporating ultrafiltration. 5th International Symposium on Microdialysis in Drug Research and Development; The Netherlands: Leiden; 2007. [Google Scholar]
- 16.Bungay PM, Morrison PF, Dedrick RL. Steady-state theory for quantitative microdialysis of solutes and water in vivo and in vitro. Life Sci. 1990;46:105–119. doi: 10.1016/0024-3205(90)90043-q. [DOI] [PubMed] [Google Scholar]
- 17.Bungay PM, Morrison PF, Dedrick RL, Chefer VI, Zapata A. Principles of quantitative microdialysis. In: Westerink BHC, Cremers TIFH, editors. Handbook of Microdialysis: Methods, Applications and Perspectives. Academic Press/Elsevier; Amsterdam: 2007. pp. 131–167. [Google Scholar]
- 18.Bird RB, Stewart WE, Lightfoot EN. Transport Phenomena. John Wiley & Sons; New York: 1960. [Google Scholar]
- 19.Aptel P, Clifton M. Ultrafiltration. In: Bungay PM, Lonsdale HK, de Pinho MN, editors. Synthetic Membranes: Science, Engineering and Applications. D. Reidel Publishing Co; Dordrecht, Holland: 1986. pp. 249–305. [Google Scholar]
- 20.Kanamori T, Shinbo T. Mass transfer of a solute by diffusion with convection around a single hollow-fiber membrane for hemodialysis. Desalination. 2000;129:217–225. [Google Scholar]
- 21.Kjellström S, Lindberg S, Laurell T, Marko-Varga G. Development of a push-pull microdialysis sampling technique for the quantitative determination of proteins. Chromatographia. 2000;52:334–339. [Google Scholar]
- 22.Schutte RJ, Oshodi SA, Reichert WM. In vitro characterization of microdialysis sampling of macromolecules. Anal Chem. 2004;76:6058–6063. doi: 10.1021/ac0493626. [DOI] [PubMed] [Google Scholar]
- 23.Wang XD, Stenken JA. Microdialysis sampling membrane performance during in vitro macromolecule collection. Anal Chem. 2006;78:6026–6034. doi: 10.1021/ac0602930. [DOI] [PubMed] [Google Scholar]
- 24.Lundberg RE, McCuen PW, Reynolds WC. Heat transfer in annular passages. Hydrodynamically developed laminar flow with arbitrarily prescribed wall temperatures or heat fluxes. Int J Heat Mass Transfer. 1963;6:495–529. [Google Scholar]
- 25.Kays WM. Convective Heat and Mass Transfer. In: Drake RM, Kline SJ, editors. McGraw-Hill Series in Mechanical Engineering. McGraw-Hill Book Co; New York: 1966. [Google Scholar]
- 26.Hatton AP, Quarmby A. Heat transfer in the thermal entry length with laminar flow in an annulus. Int J Heat Mass Transfer. 1962;5:973–980. [Google Scholar]
- 27.Stenken JA. Microdialysis sampling. In: Webster JG, editor. Encyclopedia of Medical Devices and Instrumentation. John Wiley & Sons, Inc; Hoboken: 2006. pp. 400–420. [Google Scholar]
- 28.Nicholson C. Diffusion and related transport mechanisms in brain tissue. Rep Prog Phys. 2001;64:815–884. [Google Scholar]


