

Abstract
This study examined the occurrence in wastewater of 11 aromatic biocides, pesticides and degradates, and their fate during passage through U.S. treatment plants, as well as the chemical mass contained in sewage sludge (biosolids) destined for land application. Analyte concentrations in wastewater influent, effluent and sludge from 25 facilities in 18 U.S. states were determined by liquid chromatography electrospray (tandem) mass spectrometry. Dichlorocarbanilide, fipronil, triclocarban, and triclosan were found consistently in all sample types. Dichlorophene, hexachlorophene, and tetrachlorocarbanilide were detected infrequently only, and concentrations of the phenyl urea pesticides diflubenzuron, hexaflumuron, and linuron were below the limit of detection in all matrixes. Median concentrations (± 95% confidence interval) of quantifiable compounds in influent ranged from 4.2 ± 0.8 µg L−1 for triclocarban to 0.03 ± 0.01 µg L−1 for fipronil. Median concentrations in effluent were highest for triclocarban and triclosan (0.23 ± 0.08 and 0.07 ± 0.04 µg L−1, respectively). Median aqueous-phase removal efficiencies (± 95% CI) of activated sludge treatment plants decreased in the order of: triclosan (96 ± 2%) > triclocarban (87 ± 7%) > dichlorocarbanilide (55 ± 20%) > fipronil (18 ± 22%). Median concentrations of organohalogens were typically higher in anaerobically than in aerobically digested sludges, and peaked at 27,600 ± 9,600 and 15,800 ± 8,200 µg kg−1 for triclocarban and triclosan, respectively. Mass balances obtained for three primary pesticides in six activated sludge treatment plants employing anaerobic digestion suggested a decreasing overall persistence from fipronil (97 ± 70%) to triclocarban (87 ± 29%) to triclosan (28 ± 30%). Nationwide release of the investigated organohalogens to agricultural land via municipal sludge recycling and into surface waters is estimated to total 258,000 ± 110,00 kg yr−1 (mean ± 95% confidence interval), with most of this mass derived from antimicrobial consumer products of daily use. This study addresses some of the data gaps identified by the National Research Council in its 2002 study on standards and practices of biosolids application on land.
Introduction
Of the approximately 82,000 chemicals listed in the Toxic Substances Control Act inventory(1), at least 80 compounds have been identified as organic wastewater compounds (OWCs)(2). However, these chemicals, which include a number of pharmaceuticals and personal care products (PPCPs), very likely represent only a small fraction of the total number of manmade chemicals entering wastewater treatment plants (WWTPs) and surface waters nationwide in raw sewage and treated effluent, respectively. Similarly, the chemical composition of treated sewage sludge (biosolids) at present is not well defined. In 2002, a National Research Council committee formed ad hoc by the National Academies of the U.S., identified important knowledge gaps hampering the risk assessment for land application of biosolids(3). Recent studies addressing these data gaps concentrated on both biological and chemical contaminants in biosolids destined for land application(4, 5). Whereas many biological agents are inactivated during sewage sludge digestion(4), a number of organic OWCs have been observed to resist treatment and accumulate in biosolids(5). Since many of the more recalcitrant substances in biosolids are organohalogen compounds(5–8), several of them were selected as analytical targets for the present survey of WWTPs from across the United States.
This study concentrated on the trichlorinated diphenyl ether triclosan, seven phenyl urea compounds of varying chlorine content, two chlorinated diphenylmethanes and the hexafluorinated pesticide fipronil. Triclosan (TCS) is a disinfectant added to a multitude of personal care products such as soap, dishwashing detergent, toothpaste and deodorant. Ecotoxicological and human health concerns over this antimicrobial compound mostly revolve around its environmental persistence and potential for endocrine disruption, as well as its ability to induce multi-drug resistance in microorganisms(9). Since TCS is not effectively transformed during wastewater treatment, it is a common contaminant of U.S. surface waters(2) and biosolids(5, 7). Its widespread environmental occurrence is of concern, because TCS can activate the pregnane X receptor in humans(10), alter thyroid hormone receptor gene expression in tadpoles(11) and interfere with thyroid hormone levels in male junvenile rats(12). Additional laboratory studies showed an ability of TCS to cause cross-resistance in Escherichia coli O157:H7 to multiple clinically important antibiotics(13).
The chlorinated diphenyl urea compound triclocarban (TCC) is a sanitizing agent added to many personal care products of daily use including cosmetics and soaps. It is toxic to a number of aquatic organisms(14) and its transformation in the environment is known to yield carcinogenic and toxic degradates in the form of mono- and dichloroaniline(15). TCC has been shown to persist during wastewater treatment(6). Additionally, it has been detected in wastewater effluent receiving surface waters, sewage sludge amended fields and in estuarine sediments(16–18). TCC also may cause endocrine disruption, potentially by a novel mechanism, as shown in vitro in cell-based assays and in vivo in rats(19). Also examined in this work are production impurities and degradation products of TCC, including non-chlorinated carbanilide (NCC), dichlorocarbanilide (DCC) and tetrachlorocarbanilide (TetCC). Previous studies had identified the above five carbanilide congeners as common contaminants of U.S. aquatic environments(16, 17, 20).
Additional halogenated phenyl urea compounds monitored in this study include the agricultural pesticides linuron, diflubenzuron (DFBU) and hexaflumuron (HFU). These were chosen as targets due to their structural similarity to TCC and an analogous potential for yielding as degradation products toxic chloroanilines that have been detected in surface waters featuring WWTP effluent inputs(20). Linuron is one of the most widely used herbicides in the U.S. and thus may enter domestic wastewater as runoff captured by combined sewer systems or as a residue in food scraps disposed of into wastewater. Linuron can induce endocrine disruption and alter gene expression during development by functioning as an androgen receptor antagonist(21). As a result of its widespread agricultural use, linuron has been detected in drinking water samples(22). The phenyl urea compounds DFBU and HFU are insecticides marketed under the brand names Micromite® and Sentricon®, respectively. DFBU was identified as a ligand of the pregnane X receptor in in vitro experiments using transfected cervical cancer HeLa cells(23). In mice, an induction by DFBU was observed of several enzymes of the cytochrome P450 superfamily in multiple organs(24).
The chlorinated diphenyl methane compounds dichlorophene (DCP) and hexachlorophene (HCP) were selected due to structural features and uses similar to those of TCS. Hexachlorophene once was contained as a topical antiseptic agent in over 400 personal care products. However, its widespread use was banned by the Food and Drug Administration (FDA) in 1972 following reports of brain damage in newborn rats and monkeys; dermal absorption followed by symptoms consistent with HCP toxicity later were confirmed in infants(25). The presence of HCP in wastewater and sludge was reported in the 1970s(26) but more recent data are lacking. The 1972 ban of HCP allows for continued use of this organohalogen compound as a preservative in cosmetics at a level of no more than 0.1% by weight.
Fipronil is a recently introduced hexafluorinated insecticide with a growing number of household uses and was recently detected in indoor dust samples(27). Fipronil has been shown to exhibit toxicity to shrimp in estuarine mesocosms(28) and was observed to cause infertility in the estuarine, meiobenthic harpacticoid copepod, Amphiascus tenuiremis(29). Additionally, there is some evidence of fipronil bioaccumulation in eel(30).
Study objectives were (i) to determine the occurrence of the above organohalogen compounds in U.S. wastewater, (ii) to elucidate the fate of these analytes during sewage treatment, and (iii) to determine their overall persistence in treated effluent and biosolids. Rather than carrying out an extensive sampling campaign at a single treatment plant with the focus on a single compound(6), this study examined a large number of facilities from across the U.S. to obtain estimates for the nationwide release of multiple organohalogens compounds into wastewater, U.S. surface waters, and the transfer of these chemicals to agricultural land as a result of biosolids disposal on land.
Methods
Treatment facility enrollment and sampling
All samples (influent, effluent, and sludges) were obtained between April 2005 and July 2007 through a network of volunteers established with assistance of the Water Environment Federation, a not-for-profit technical and educational organization that was formed in 1928 and that represents some 50,000 water quality professionals. For sample acquisition, pre-cleaned bottles (I-Chem, Rockwood, TN) were placed in special shipping containers for diagnostic specimen (EXAKT Technologies, Oklahoma City, OK) and mailed to the volunteers with detailed sampling, handling, storage and shipping instructions. For each plant, duplicate influent and effluent samples were collected as 24-hour composite samples (except for two plants where grab sampling was employed). As is customary for this matrix(5), sludges were collected as a single grab sample on the day the liquid samples were obtained. All samples where shipped to the analytical laboratory on ice. Upon arrival at the lab, samples were immediately stored in a freezer at −20°C until further use, as is customary for the storage and analysis of biosolids collected for and analyzed by the U.S. Environmental Protection Agency.
Sample preparation
The processing of samples was described elsewhere in detail(31). In brief, aqueous samples were spiked with stable isotope labeled surrogate standards (13C6-TCS, 13C6-TCC) and centrifuged (effluent: 2,000 × g; influent: 10,000 × g) for 20 min to separate suspended solids from the aqueous phase. The supernatant was subsequently extracted using Oasis HLB SPE columns (Waters Corp., Milford, MA) and eluted with methanol. Suspended solids were subjected to organic solvent extraction by orbital shaking overnight at room temperature in a mixture of methanol and acetone (50:50) with a ratio of solvent-to-solids (mL g−1) of approximately 100. Sludge samples were dried at 60°C and extracted similar to the suspended solids.
Methods of detection
Monitoring of TCS and TCC was performed as described previously(31). In brief, using a Shimadzu autosampler (SIL-10ADvP) the samples were introduced into a Shimadzu HPLC system (LC-10ADvp gradient pumps), chromatographically separated on a Restek IBD column (150 mm; 2.1 mm; 5 µm) and detected by a single quadrupole mass spectrometer (Shimadzu LCMS 2010A) in negative electrospray ionization (ESI−) mode. All other, less abundant target compounds were monitored with a more sensitive technique, i.e., tandem mass spectrometry, using a Thermo TSQ Ultra triple quadrupole mass spectrometer (Thermo Fisher; San Jose, CA) after analyte separation on a BetaBasic-18 column (100 mm; 2 mm; 5 µm; Thermo Hypersil-Keystone, Bellefonte, PA), connected to a Thermo Surveyor HPLC/autosampler system. To maximize analytical sensitivity and selectivity, compounds were detected in selective reaction monitoring (SRM) mode.
Methods of quantification
TCS and TCC were quantified using the isotope dilution technique and 13C6-TCS and 13C6-TCC, respectively, as surrogate standards added prior to sample preparation; this allowed for correction for both recovery and ion suppression. The carbanilide congeners NCC, DCC, and TetCC also were quantified using 13C6-TCC as a surrogate standard. Linuron was quantified by adding linuron-d6 internal standard to the samples directly prior to analysis, which allowed for correction for ion suppression only but not analyte recovery. All remaining analytes were quantified using external calibration. For analytes quantified on the single quadrupole instrument eight-point calibration curves were performed, ranging from 2.5 – 200 µg L−1, while for the triple quadrupole instrument nine-point calibration curves ranging from 0.01 – 10 µg L−1.
Quality control
Analyte recovery was determined for each sample matrix by spiking 3 replicate samples with an analyte mixture at 3 different levels each. Aliquots of effluent (100 mL) were spiked at 0, 10 and 100 ng, whereas influent (100 mL) and sludge (5 mL) were spiked at 0, 50 and 500 ng per sample. Method detection limits (MDLs) in sludge were determined according to procedure described in the Code of Federal Regulations, Part 136, Appendix B (1993). In brief, 5 mL of digested sludge were spiked with 100 ng of analyte mass and processed as described above. The MDL was calculated by multiplying the standard deviation with the Student’s t-value associated with the 99% confidence interval for six degrees of freedom. For influent and effluent analysis, MDLs were estimated by using the lowest concentration of the calibration curve for each compound with a signal-to-noise ratio of at least 10 and dividing this concentration by the concentration factor of the corresponding sample processing protocol. Non-detect values were included into the data analysis by assigning a concentration of one-half of the MDL. If an analyte was never detected in a given matrix, no average loading rates were calculated. The limit of quantification (LOQ) was defined as the lowest calibration standard having a signal-to-noise ratio of 10.
Calculations
Mass balances were calculated based on measured concentrations and reported rates of aqueous flow and sludge production. For each plant, the average concentration of biocides measured in influent, effluent and sewage sludge were multiplied with the corresponding flow rate of each matrix at the time of sampling. Subsequently, the calculated mass of each target analyte in effluent and sludge was subtracted from the mass entering the plant (influent mass), resulting in the mass of each analyte lost or transformed. The resultant mass balance for each plant was expressed in chemical mass fractions (%) detectable in (i) sludge, (ii) effluent, and (iii) lost or transformed, relative to the calculated initial loading (100%). To obtain nationwide estimates, the fraction found in each matrix was averaged over all plants sampled. Per-capita release estimates were obtained by multiplying the average influent concentration of each plant with the corresponding flow rate. The resultant chemical mass was divided by the population of the plant served. To obtain nationwide release estimates, per-capita rates were multiplied with the U.S. population count reported in the U.S. 2003 census.
Release estimates for all individual plants were averaged to arrive at national estimates. Land application estimates for biosolids were obtained in an analogous fashion. For each plant, the mass of individual compounds present in sludge was calculated, and the obtained value first divided by the population served, and then multiplied with the U.S. population count. Finally, the chemical mass calculated to be sequestered in sludge per year by each plant was multiplied with a factor of 0.63, to account for the fraction of sludge that is applied on land (63%) (3). Estimates of release rates from individual plants were then averaged to obtain nationwide release rates.
To explore determinants of chemical release, demographic information (e.g., median income and median age) for the various sewersheds was extracted from the U.S. census bureau database (http://factfinder.census.gov) and compared to chemical release rates by using scatter plots and linear regression analysis.
Results
Participating treatment facilities
Sixty-one individuals responded to the call for study participants that was advertised on the Internet webpage of the Water Environment Federation (WEF) and in the organization’s printed newsletter. After elimination of redundant facilities and those where supervisory approval could not be gained for sampling activities, 25 municipal WWTPs representing 18 U.S. states took part in this study (Figure 1). This sample included 20 activated sludge treatment works, two sequential batch reactor (SBR) plants, and one facility each using trickling filter, primary-only and oxidation ditch treatment. For sludge processing, most plants utilized anaerobic digestion (n = 14). Other types of sludge treatment regimes were aerobic digestion (n = 3) or dewatering and/or lime treatment without digestion (n = 8). The size of the plants sampled in terms of daily flow ranged from 0.4 – >800 million liters per day (MLD) (Figure 1). A diagram illustrating the treatment train of participating plants is provided in the Supplemental Information (Figure S-1). All volunteers participated under the condition of confidentiality with respect to reporting of plant performance and biosolids composition.
Figure 1.

Map of states sampled and distribution of wastewater treatment plant size, here expressed as flow rate in million liters per day (MLD).
Method development and quality control results
Analytical methods employed allowed for the analysis of 11 targets and 3 surrogate standards (Figure 2). All analytes produced the most favorable signals in negative ionization mode. Expansion of protocols previously reported for TCS and TCC(32) allowed for the separation and detection by LC-MS/MS of all additional compounds in a single analytical run.
Figure 2.
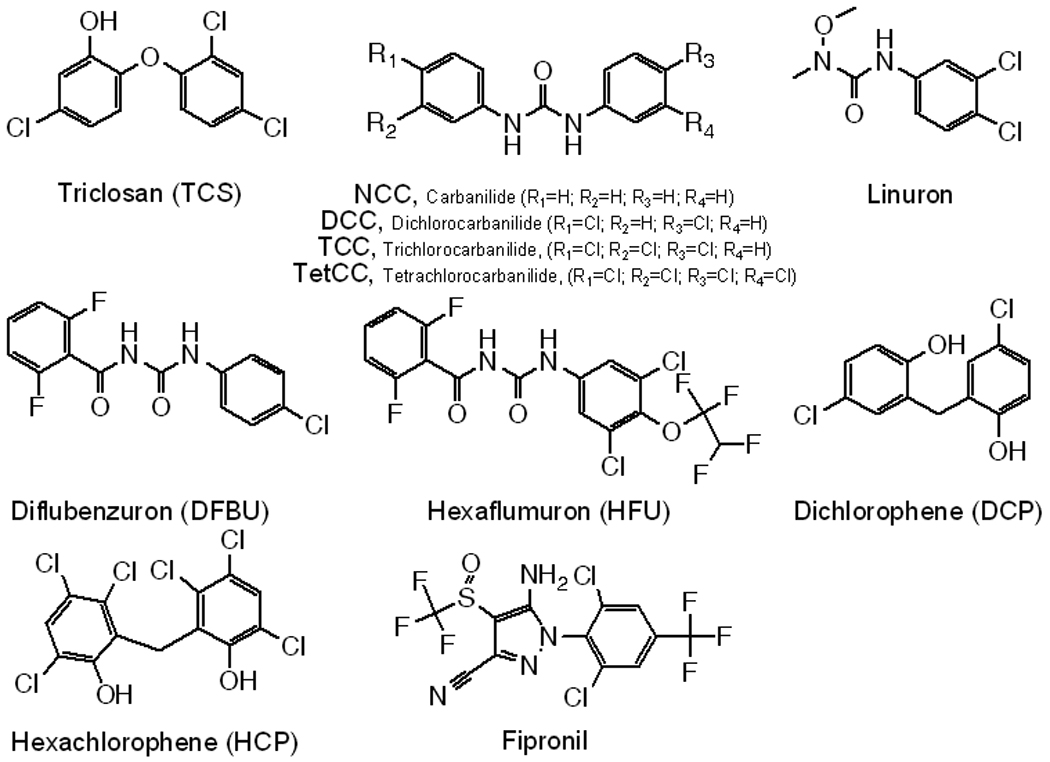
Structures of chemicals investigated in this study.
Characteristic mass transitions were identified in multiple reaction monitoring, and fragmentation and collision energies were optimized for each compound to maximize signal intensities (Table 1). Recovery rates for analytes in influent, effluent and biosolids averaged 90, 74, and 59%, respectively. Unfavorable results were noted particularly for HCP in effluent (16 ± 1%) and in anaerobically digested sludge (8 ± 6%) (Supplemental Information; Table S-1). Method detection limits (MDLs) for influent, effluent and sludge were on the order of 0.02 – 0.32 µg L−1, 0.01 – 0.03 µg L−1, and 0.2 – 3.9 µg kg−1, respectively (Table S-1). Limits of quantification (LOQ) were in the range of 0.1 – 25 pg onto column (Table S-1). Resulting calibration curves showed generally a linear correlation with R2 values > 0.995 (Table S-1).
Table 1.
Properties of analytes and instrument parameters used for chemical monitoring.
| Compound | CAS Registry Number |
Log KOWa | Water solubility (mg/L)b |
Transition (m/z) |
Collision Energyc |
|---|---|---|---|---|---|
| Carbanilide | 102-07-8 | 3.0 | 190 | 211 → 92 | 17 |
| 4,4’-Dichlorocarbanilide | 1219-99-4 | 4.3 | 3.9 | 279 → 126 | 18 |
| Dichlorophene | 97-23-4 | 4.3 | 13 | 267 → 160 | 25 |
| Diflubenzuron | 35367-38-5 | 3.6 | 23 | 309 → 289 | 10 |
| Fipronil | 120068-37-3 | 6.6 | 0.01 | 435 → 230 | 18 |
| Hexachlorophene | 70-30-4 | 6.9 | 0.07 | 404 → 195 | 31 |
| Hexaflumuron | 86479-06-3 | 5.6 | 0.14 | 459 → 276 | 24 |
| Linuron | 330-55-2 | 2.9 | 62 | 247 → 160 | 15 |
| (Linuron-d6) | (253 → 161) | ||||
| 3,3’,4,4’-Tetra- chlorocarbanilide |
4300-43-0 | 5.6 | 0.11 | 347 → 160 | 20 |
| Triclocarban | 101-20-2 | 4.9 | 0.66 | 313 → 160 | 17 |
| (13C6-TCC) | (319 → 160) | (18) | |||
| Triclosan | 3380-34-5 | 4.8 | 4.1 | 287 | N/A |
| (13C6-TCS) | (293) |
Estimated using EPI Suite KOWWIN v1.67
Estimated using Advanced Chemistry Development (ACD/Labs) Software V8.14
Arbitrary instrument unit digested sludge (8 ± 6%) (Supplemental Information; Table S-1). Method
Influent concentrations
Four of 11 target compounds (36%) were detected with a detection frequencies of 100% in quantifiable concentrations: DCC, fipronil, TCC and TCS (Table 2). Carbanilde, DCP and TetCC were detected but low-level background contamination in method blanks prevented successful quantification. The median concentration of TCS with 4.1 µg L−1 (range: 0.8 – 23.9 µg L−1) was comparable to that of TCC, calculated at 4.2 µg L−1 (range: 1.3 – 20.5 µg L−1) (Figure 3A). Other frequently detected compounds occurred at lower levels. The median concentration of DCC equaled 0.09 µg L−1 (range: 0.05 – 0.48 µg L−1), and that of fipronil 0.03 µg L−1 (range: 0.02 – 0.06 µg L−1).
Table 2.
Concentrations of analytes measured in different process streams of 25 U.S. wastewater treatment plantsa.
| Compound | Influent (ppb) |
Effluent (ppb) |
Aqueous removal efficiency (%) ± 95% CI |
Undigested, excess sludgeb (ppb) |
Anaerobically digested sludge (ppb) |
Aerobically digested sludge (ppb) |
|||||
|---|---|---|---|---|---|---|---|---|---|---|---|
| Median ± 95% CI [Mean] |
Range (90th Percentil e) |
Median ± 95% CI [Mean] |
Range (90th Percenti le) |
Median ± 95% CI [Average] |
Range or (90th Percentile) |
Median ± 95% CI [Mean] |
Range (90th Percentile) |
Average | Range | ||
| 4,4’-Dichloro- carbanilide |
0.09 ± 0.04 [0.12] (n = 11) |
0.05 – 0.48 (0.15) |
0.04 ± 0.01 [0.05] (n = 9) |
0.02 – 0.12 (0.09) |
55 ± 20 (n = 9) |
[420] (n = 2) |
250 – 590 | 1,500 ± 3,900 [3,100] (n = 7) |
30 – 14,900 (7,600) |
470 (n = 2) |
210 – 740 |
| Dichlorophene | NQ | NQ | NQ | NQ | N/A | [< 0.5] (n = 2) |
< 0.5 | 10 ± 40 [50] (n = 7) |
5 – 140 (110) |
< 0.5 (n = 2) |
< 0.5 |
| Fipronil | 0.03 ± 0.01 [0.03] (n = 11) |
0.02 – 0.06 (0.05) |
0.03 ± 0.01 [0.03] (n = 9) |
< 0.01 – 0.07 (0.04) |
18 ± 22 (n = 9) |
[160] (n = 2) |
130 – 180 | 70 ± 30 [60] (n = 7) |
3 – 100 (100) |
130 (n = 2) |
110 – 160 |
| Hexachlorophene | [< 0.11] (n = 2) |
< 0.11 | < 0.02 (n = 2) |
< 0.02 | N/A | [270] (n = 2) |
180 – 370 | 120 ± 60 [120] (n = 7) |
20 – 240 (210) |
280 (n = 2) |
190 – 360 |
| 3,3’,4,4’-Tetrachlorocarbanilide | NQ | NQ | NQ | NQ | N/A | [3,000] (n = 2) |
1,700 – 4,300 |
1,600 ± 1,300 [1,800] (n = 7) |
40– 5,000 (3,800) |
2,500 (n = 2) |
2,400 – 2,700 |
| Triclocarban | 4.2 ± 0.8 [4.8] (n = 77c) |
1.3 – 20.5 (7.4) |
0.23 ± 0.08 [0.38] (n = 70c) |
0.01 – 1.78 (0.83) |
87 ± 7 (n = 25) |
34,900 ± 7,200 [33,400] (n = 5) |
21,600 – 43,200 |
27,600 ± 9,600 [29,500] (n = 12c) |
4,700 – 63,000 (55,000) |
18,000 (n = 2) |
16,400 – 19,600 |
| Triclosan | 4.1 ± 1.1 [5.9] (n = 77c) |
0.8 – 23.9 (11.1) |
0.07 ± 0.04 [0.15] (n = 70c) |
< 0.01 – 0.84 (0.31) |
96 ± 2 (n = 25) |
3,400 ± 6,000 [5,700] (n = 5) |
1,100 – 17,500 |
15,800 ± 8,200 [17,900] (n = 12c) |
410 – 46,000 (34,900) |
580 (n = 2) |
550 – 610 |
Data were rounded to closest integer or decimal unit; NQ: Non-quantifiable due to high background in method blanks; NA: Not applicable;
Carbanilide, diflubenzuron, hexaflumuron, and linuron were not detected;
Includes different types of sludge treatment (thickening, lime stabilization);
Figure 3.
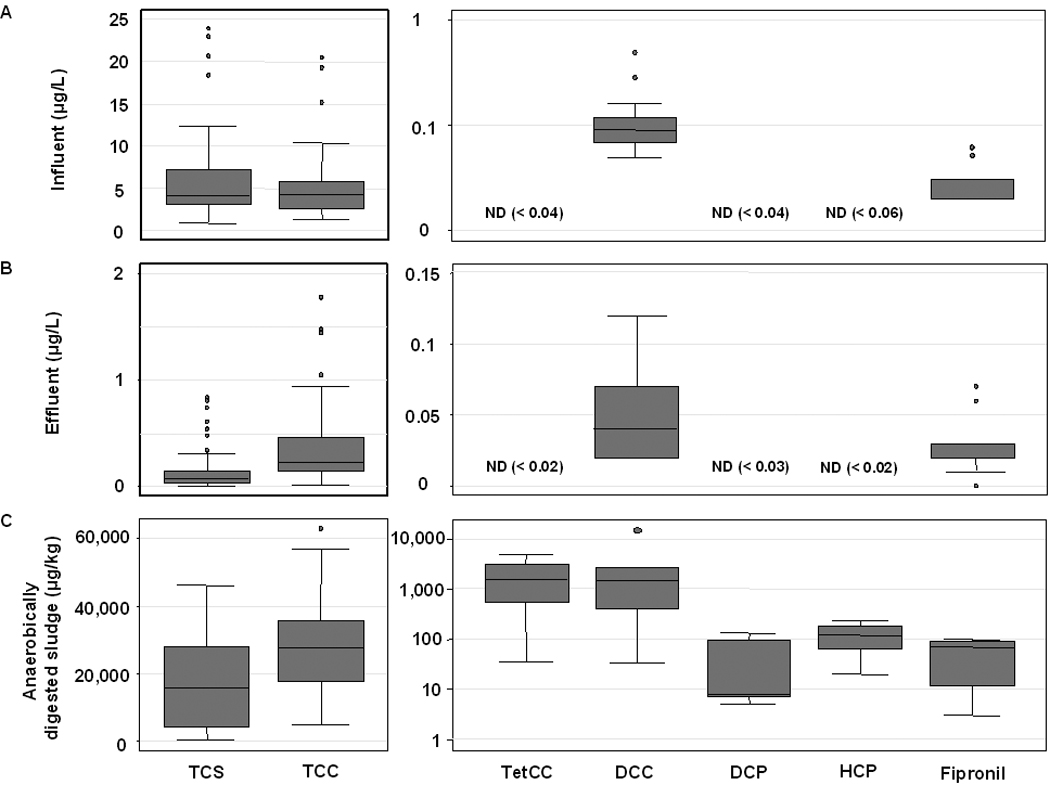
Box plots of organohalogen concentrations measured in influent (A), effluent (B) and digested sludge (C) for analytes including triclosan (TCS), triclocarban (TCC), 3,3’,4,4’-tetrachlorocarbanilide (TetCC), 4,4’-dichlorocarbanilide (DCC), dichlorophene (DCP) and hexachlorophene (HCP).
Effluent concentrations and aqueous removal efficiencies
In WWTP effluent, TCC, DCC and fipronil were found consistently (100%) above the limit of quantification. TCS also was detected frequently (87%). Other compounds that were detected but could not be quantified, included DCP, NCC, and TetCC. TCS and TCC were quantified in effluent at median concentrations of 0.07 µg L−1 (90th percentile range: <0.01 – 0.84 µg L−1) and 0.23 µg/L (range: 0.01 – 1.78 µg L−1), respectively (Figure 3B, Table 2). Calculated removal efficiencies ± 95 confidence interval were 96 ± 2% for TCS and 87 ± 7% for TCC. Median concentrations of DCC and fipronil in effluent, at 0.04 µg L−1 (90th percentile range: 0.02 – 0.12 µg L−1) and 0.03 µg L−1 (range: <0.01 – 0.07 µg L−1), respectively, were comparable to those found in influent. The average removal efficiency for DCC was 55 ± 20%. Fipronil showed the lowest removal efficiency, calculated at 18 ± 22%.
Concentrations found in digested sludge
Among the 11 compounds monitored, seven were detected and quantified in digested sludge (Figure 3C, Table 2). Carbanilide was detected in this matrix but not quantified, due to elevated background levels in method blanks. Among the quantifiable compounds, DCC, fipronil, TCC, TetCC, and TCS were detected in 100% of the samples. DCP and HCP were detected in 42% and 67% of the samples, respectively. The highest median concentrations, reported on a dry weight basis, were measured for TCC and TCS; all other compounds occurred at much lower levels. TCC occurred at a median concentration of 27,600 µg Kg−1 (90th percentile range: 4,700 – 63,000 µg Kg−1) in anaerobically digested biosolids, and averaged 18,000 µg Kg−1 (16,400 – 19,600 µg Kg−1) and 34,900 µg Kg−1 (range: 21,600 – 43,200 µg Kg−1), respectively, in aerobically digested and undigested sludge. TCS was found in anaerobically digested sludge at a median concentration of 15,800 µg Kg−1 (90th percentile range: 410 – 46,000 µg Kg−1), and at comparatively lower levels (580 µg Kg−1; range: 550 – 610 µg Kg−1) in aerobically digested and in undigested sludge (3,400 µg Kg−1; 1,100 – 17,500 µg Kg−1) (see Figure 3C, Table 2). For the additional analytes that occurred at much lower levels, the computation of median concentrations was sometimes not possible due to a low n of 2. Concentrations of DCC showed a median value of 1,500 µg Kg−1 in anaerobically digested sludge and averaged 470 and 420 µg Kg−1 in aerobically digested and undigested sludge, respectively. For TetCC, the median concentration in anaerobically digested sludge was 1,600 µg Kg−1, whereas aerobically digested and undigested sludges averaged 2,500 and 3,000 µg Kg−1, respectively. Fipronil showed a median level of 70 µg Kg−1 in anaerobically digested biosolids and occurred at an average level of 130 and 160 µg Kg−1 in aerobically digested and undigested sludge, respectively. Among the diphenylmethane compounds, median concentrations were 10 µg Kg−1 for DCP, which was only detected in anaerobically digested sludge, and 120 µg Kg−1 for HCP. The latter compound averaged 280 and 270 µg Kg−1 in aerobically digested and undigested sludge, respectively.
Mass balance results
Available data allowed for the computation of mass balances for a total of four analytes (Figure 4). For the TCC degradate DCC, a net formation of analyte mass was observed during all treatment approaches other than activated sludge processing in conjunction with aerobic sludge digestion. Mass tracking of fipronil showed a tendency for this insecticide to persist in the aqueous phase (Figure 4). The majority of the TCS entering the different plant types could not be accounted for, indicating a significant degree of transformation during treatment. Less favorable results were observed in a trickling filter plant and in a treatment train involving primary-treatment only in conjunction with anaerobic sludge digestion; in both cases, more than 50% of the initial TCS mass was sequestered and persisted in biosolids. Whereas the degree of compound transformation differed with treatment strategy employed, the mass fraction passing though the plant in effluent showed less variation. Compared to TCS, TCC showed a greater persistence and a more pronounced tendency for accumulation in sludge. Regardless of the treatment strategy employed, over 50% of the chemical mass entering the plant was observed to persist contained in biosolids (Figure 4). The sole trickling filter plant showed a considerable fraction of the triclocarban loading passing through the plant contained in effluent.
Figure 4.
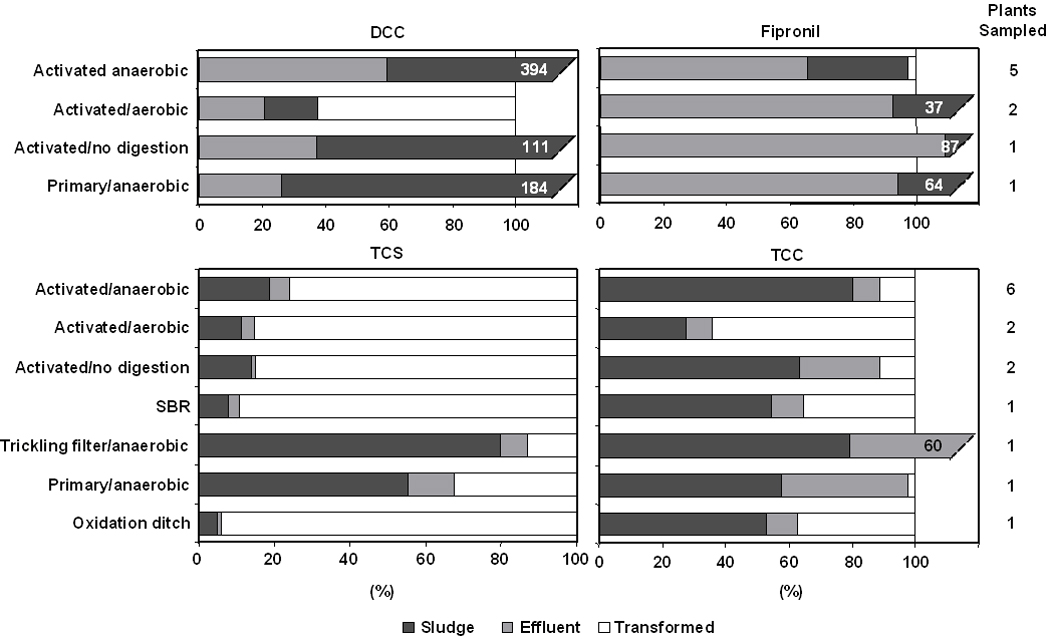
Fate of 4,4’-dichlorocarbanilide (DCC), fipronil, triclosan (TCS) and triclocarban (TCC) in different treatment systems, including a sequencing batch reactor (SBR).
Per-capita release estimates
Per-capita release rates of the various analytes into wastewater were estimated by dividing the annual mass entering each plant by the size of the population served. Per-capita release rates for DCC, fipronil, TCS and TCC averaged 30 ± 20, 6 ± 1, 1100 ± 280 and 950 ± 250 mg yr−1, respectively (Table 3; ± 95% confidence interval).
Table 3.
Estimated per-capita release rates of organohalogens to wastewater, and computed rates of annual chemical release to wastewater and soils nationwide.
| Compound | Per-capita Loading Mean ± 95%CI (mg/year) |
Nationwide Loading to Wastewater Rate ± 95%CI (kg/year) |
Nationwide Land Application Rate ± 95%CI (kg/year)a,b |
Nationwide Release with Treated Wastewater Rate ± 95%CI (kg/year)b |
|---|---|---|---|---|
| 4,4’-Dichloro- carbanilide |
30 ± 20 (n = 11) |
9,500 ± 6,500 (n = 11) |
16,700 ± 14.300 (n = 6) |
5,900 ± 3,600 (n = 10) |
| Dichlorophene | N/A | N/A | 850 ± 900 (n = 6) |
N/A |
| Fipronil | 6 ± 1 (n = 11) |
1,700 ± 400 (n = 11) |
440 ± 390 (n = 6) |
1,500 ± 400 (n = 10) |
| Hexachlorophene | N/A | N/A | 5,300 ± 4,200 (n = 6) |
N/A |
| 3,3’,4,4’- Tetrachlorocarbanilide |
N/A | N/A | 8,400 ± 2,800 (n = 6) |
N/A |
| Triclocarban | 950 ± 250 (n = 49) |
275,000 ± 66,000 (n = 49) |
132,000 ± 36,000 (n = 10) |
11,000 ± 4,000 (n = 13) |
| Triclosan | 1,100 ± 280 (n = 49) |
326,000 ± 81,000 (n = 49) |
64,000 ± 29,000 (n = 10) |
16,000 ± 14,000 (n = 13) |
Assuming 63% sludge recycling rate for application of biosolids on land (3).
Only activated sludge wastewater treatment plants using anaerobic digestion were included, as this represents the most prevalent treatment strategy in the U.S. based on sewage volume treated.
Nationwide loading of organohalogens to wastewater, surface water and agricultural land
The estimated nationwide loading rate of TCS to wastewater exceeded that of TCC (326,000 ± 81,000 versus 275,000 ± 66,000 kg yr−1; Table 3). Similar, the nationwide loading rate of TCS into surface water with treated wastewater was greater than that of TCC (16,000 ± 14,000 versus 11,000 ± 4,000 kg yr−1) In contrast, the estimated loading of TCS to agricultural soils from biosolids recycling was smaller than that of TCC (64,000 ± 29,000 versus 132,000 ± 36,000 kg yr−1); release estimates for the other analytes were markedly lower by comparison (Table 3). Among the analytes investigated, the organohalogen burden destined for land disposal as a result of biosolids recycling showed the following contributions: TCC (55.8%) > TCS (30.8%) > DCC (7.0%) >TetCC (3.7%) > HCP (2.1%) > DCP (0.4%) > fipronil (0.2%). The total mass (± 95% CI) of the here examined organohalogens disposed of nationwide on land and into surface waters was estimated to equal 258,000 ± 110,000 kg per year, which is equivalent to 569,000 ± 298,000 pounds per year.
Discussion
This study documents the occurrence and fate of several organohalogen compounds during wastewater treatment and their transfer to agricultural soils resulting from beneficial reuse of biosolids. The work was motivated by the 2002 report of the National Research Council that called for a better chemical characterization of biosolids destined for application on land(3). By examining wastewater and biosolids from 25 treatment works in 18 states of the union, the study represents the geographically most comprehensive dataset available today for U.S biosolids. Although the number of analytes was small, the data obtained complement another survey of biosolids conducted recently by the United States Geologic Survey(5).
Before the results of the study are discussed, it is important to understand its various limitations. Treatment facilities represented in this survey were selected as randomly as technically feasible, based on the response of volunteers. However, the resultant sample may not necessarily be fully representative of the sum of all treatment facilities operated in the U.S. today. Furthermore, maximizing geographical coverage came at the expense of limiting sampling frequency. Accordingly, for most plants, only one or two composite samples of each matrix were analyzed, whereas the use of multiple samples and multiple sampling campaigns would have been preferable(33). Due to the lack of available stable isotope labeled standards, several analytes could be quantified only by using external calibration as opposed to the more reliable isotope dilution technique; data obtained by external quantitation (see Table S-1) generally are considered to be of lesser quality then those obtained by the isotope dilution technique, that better addresses ion suppression and other matrix effects(34, 35). Finally, background contamination in control samples hampered the determination of NCC, TetCC and DCP, and made impossible the computation of mass balances for these analytes. Measurement of environmental contaminants at the low parts-per-trillion level (ng L−1) has been recognized as a challenge and background contamination in this concentration range is a common phenomenon(36).
The present study generated important information on a number of emerging contaminants, most notably TCS, TCC and its various congeners. Although influent concentrations of TCS and TCC showed a considerable range (Figure 3A), their median concentrations were comparable to previously reported data(6, 37, 38). Both concentration distributions showed outliers toward higher concentrations. To investigate the outliers, measured concentrations were normalized to population and correlated to plant size, as a measure for urbanization, and to population characteristics such as median age and income. However, none of the parameters showed an association and therefore cannot serve to explain the observed outliers. Mean concentrations of TCS and TCC measured in effluent (Figure 3B) were similar to previously reported data(6, 38). Outliers found in the distributions of effluent concentrations for TCS and TCC could be partially explained through unique treatment trains in these plants. The outliers for TCS are from a plant that utilizes primary treatment only and another plant of the sequential batch reactor type. Similar to the situation with TCS, outliers for TCC resulted from the single primary-treatment-only plant, and from a trickling filter plant. Mean concentrations measured in digested sludge (Figure 3C) were within the same order of magnitude for TCS and TCC, when compared to data published in the literature(6, 37, 39).
Aside from explaining observed outliers, an examination of treatment type performance also provided insights into the susceptibility of TCS and TCC to biological destruction. The fate of TCS during sewage treatment is known to vary with plant type and the observations made here are no exception. As observed in previous studies of German(37) and U.S. treatment works(33), activated sludge processing in conjunction with anaerobic sludge digestion resulted in the accumulation and persistence of TCS in digested sludge (Figure 4). In contrast, two plants utilizing aerobic sludge digestion and another facility utilizing an oxidation ditch process performed more favorably; this may be explained by the fact that TCS is biotransformed more readily under aerobic conditions(40). The two plants with the lowest fraction degraded were a primary-treatment-only plant and a trickling filter plant. The reason for the poor degradation could be the lack of aerobic contact time. TCC showed a comparable behavior among all treatment types. As observed previously in a U.S. treatment facility(6), activated sludge processing in conjunction with anaerobic sludge digestion is fairly ineffective in destroying this wastewater constituent. In analogy to TCS, aerobic digestion was observed to hasten the loss of TCC.
Estimated nationwide per-capita release rates for TCS and TCC were similar to previously reported results(6, 32, 33). Correlation of per-capita release at each location with median age, median income and plant size (as a measure for urbanization) did not show any significant association (data not shown). This indicates that there is little variation in usage and disposal rates of these two biocides throughout the U.S., and within certain population subgroups. A per-capita contribution to residual mass in sludge was calculated in a similar fashion. A weak positive correlation with plant size was observed for TCS (R2 = 0.49) and TCC (R2 = 0.41), indicating that larger plants featuring more sophisticated treatment trains may be more efficient in sequestering these compounds into sludge (data not shown).
Additional noteworthy observations were made for several analytes that are rarely monitored. The lower chlorinated TCC analog, DCC, was detected for the first time in raw and treated wastewaters, and in digested sludge. However, the higher chlorinated analog, TetCC, was detected only in digested sludge. The concentration of HCP in digested sludge was comparable to historical published values(39) despite the over-the-counter ban of HCP products by the FDA in 1972. In contrast, the structurally related compound DCP was detected for the first time in digested sludge. Fipronil, an insecticide recently introduced for pest control in household settings, also was detected for the first time in raw and treated wastewaters and in digested sludge.
Conclusions
Based on the results of this study that examined 25 wastewater facilities in 18 U.S. states, it is concluded that the occurrence of organohalogen compounds in wastewater and their sequestration, accumulation and persistence in digested sludge during municipal sewage treatment is a nationwide phenomenon. This information is important for risk assessments of mass produced, persistent chemicals and their potential impacts on aquatic and terrestrial environments(41). Of particular concern would be the repeated application of organohalogen-containing municipal biosolids on land, a practice that, while restricted in parts of Europe, is common in the United States and other countries. Regulating biosolids application rates simply on nutrient loading may not be sufficient. If the time period between biosolids applications is shorter than the chemical residence time of persistent organohalogens contained in biosolids and applied on land, these substances over time may accumulate to unacceptable levels in sludge-amended soils.
Supplementary Material
Acknowledgments
This research was made possible in part by the Johns Hopkins University NIEHS Center in Urban Environmental Health (P30ES03819) and NIEHS grant 1R01ES015445. Additional support was provided by an Excellence in Environmental Public Health Tracking Fellowship for J. Heidler, and a pilot project grant from the JHU Center for a Livable Future.
References
- 1.GAO-05-458. 2005. United States Government Accountability Office Chemical Regulation: Options exist to improve EPA's ability to assess health risks and manage its chemical review program. [Google Scholar]
- 2.Kolpin DW, Furlong ET, Meyer MT, Thurman EM, Zaugg SD, Barber LB, Buxton HT. Environ. Sci. Technol. 2002;36:1202–1211. doi: 10.1021/es011055j. [DOI] [PubMed] [Google Scholar]
- 3.Washington,D.C.: The National Academies Press; Committee on Toxicants and Pathogens in Biosolids Applied to Land, Board on Environmental Studies and Toxicology, Division on Earth and Life Studies, National Research Council Of The National Academies. 2002
- 4.Guzman C, Jofre J, Montemayor M, Lucena F. J. Appl. Microbiol. 2007;103:2420–2429. doi: 10.1111/j.1365-2672.2007.03487.x. [DOI] [PubMed] [Google Scholar]
- 5.Kinney CA, Furlong ET, Zaugg SD, Burkhardt MR, Werner SL, Cahill JD, Jorgensen GR. Environ. Sci. Technol. 2006;40:7207–7215. doi: 10.1021/es0603406. [DOI] [PubMed] [Google Scholar]
- 6.Heidler J, Sapkota A, Halden RU. Environ. Sci. Technol. 2006;40:3634–3639. doi: 10.1021/es052245n. [DOI] [PMC free article] [PubMed] [Google Scholar]
- 7.Chu S, Metcalfe CD. J. Chromatogr. A. 2007;1164:212–218. doi: 10.1016/j.chroma.2007.07.024. [DOI] [PubMed] [Google Scholar]
- 8.Ying G-G, Kookana RS. Environ. Int. 2007;33:199–205. doi: 10.1016/j.envint.2006.09.008. [DOI] [PubMed] [Google Scholar]
- 9.Aiello A, Larson E, Levy S. Clin. Infect. Dis. 2007;45:S137–S147. doi: 10.1086/519255. [DOI] [PubMed] [Google Scholar]
- 10.Jacobs MN, Nolan GT, Hood SR. Toxicol. Appl. Pharmacol. 2005;209:123–133. doi: 10.1016/j.taap.2005.03.015. [DOI] [PubMed] [Google Scholar]
- 11.Veldhoen N, Skirrow RC, Osachoff H, Wigmore H, Clapson DJ, Gunderson MP, Van Aggelen G, Helbing CC. Aquat. Toxicol. 2006;80:217–227. doi: 10.1016/j.aquatox.2006.08.010. [DOI] [PubMed] [Google Scholar]
- 12.Zorrilla LM, Gibson EK, Jeffay SC, Crofton KM, Setzer WR, Cooper RL, Stoker TE. Toxicol. Sci. 2009;107:56–64. doi: 10.1093/toxsci/kfn225. [DOI] [PubMed] [Google Scholar]
- 13.Braoudaki M, Hilton AC. J. Clin. Microbiol. 2004;42:73–78. doi: 10.1128/JCM.42.1.73-78.2004. [DOI] [PMC free article] [PubMed] [Google Scholar]
- 14.TCC Consortium, High Production Volume (HPV) Chemical Challenge Program Data Availability and Screening Level Assessment for Triclocarban. 2002 [Google Scholar]
- 15.Boehncke A, Kielhorn J, Koennecker G, Pohlenz-Michel C, Mangelsdorf I. International Programme on Chemical Safety (IPCS): Geneva. 2003;Document 48:1–68. [Google Scholar]
- 16.Sapkota A, Heidler J, Halden RU. Environ. Res. 2007;103:21–29. doi: 10.1016/j.envres.2006.03.006. [DOI] [PubMed] [Google Scholar]
- 17.Miller TR, Heidler J, Chillrud SN, DeLaquil A, Ritchie JC, Mihalic JN, Bopp R, Halden RU. Environ. Sci. Technol. 2008;42:4570–4576. doi: 10.1021/es702882g. [DOI] [PMC free article] [PubMed] [Google Scholar]
- 18.Cha J, Cupples AM. Water Res. 2009;43:2522–2530. doi: 10.1016/j.watres.2009.03.004. [DOI] [PubMed] [Google Scholar]
- 19.Chen J, Ahn KC, Gee NA, Mohamed MI, Duleba AJ, Zhao L, Gee SJ, Hammock BD, Lasley BL. Endocrinology. 2007 en.2007-1057. [Google Scholar]
- 20.Barber LB, Keefe SH, Antweiler RC, Taylor HE, Wass RD. Environ. Sci. Technol. 2006;40:603–611. doi: 10.1021/es0514287. [DOI] [PubMed] [Google Scholar]
- 21.Turner KJ, McIntyre BS, Phillips SL, Barlow NJ, Bowman CJ, Foster PMD. Toxicol. Sci. 2003;74:114–128. doi: 10.1093/toxsci/kfg096. [DOI] [PubMed] [Google Scholar]
- 22.Li YT, George JE, McCarty CL, Wendelken SC. J. Chromatogr. A. 2006;1134:170–176. doi: 10.1016/j.chroma.2006.08.081. [DOI] [PubMed] [Google Scholar]
- 23.Lemaire G, Mnif W, Pascussi J-M, Pillon A, Rabenoelina F, Fenet H, Gomez E, Casellas C, Nicolas J-C, Cavailles V, Duchesne M-J, Balaguer P. Toxicol. Sci. 2006;91:501–509. doi: 10.1093/toxsci/kfj173. [DOI] [PubMed] [Google Scholar]
- 24.Sapone A, Pozzetti L, Canistro D, Broccoli M, Bronzetti G, Potenza G, Affatato A, Biagi GL, Cantelli-Forti G, Paolini M. Food Chem. Toxicol. 2005;43:173–183. doi: 10.1016/j.fct.2004.09.007. [DOI] [PubMed] [Google Scholar]
- 25.Tyrala EE, Hillman LS, Hillman RE, Dodson WE. J. Pediatr. 1977;91:481–486. doi: 10.1016/s0022-3476(77)81330-9. [DOI] [PubMed] [Google Scholar]
- 26.Buhler DR, Rasmusso M, Nakaue HS. Environ. Sci. Technol. 1973;7:929–934. [Google Scholar]
- 27.Mahler BJ, Van Metre PC, Wilson JT, Musgrove M, Zaugg SD, Burkhardt MR. Environ. Sci. Technol. 2009 doi: 10.1021/es901292a. [DOI] [PubMed] [Google Scholar]
- 28.Wirth EF, Pennington PL, Lawton JC, DeLorenzo ME, Bearden D, Shaddrix B, Sivertsen S, Fulton MH. Environ. Pollut. 2004;131:365–371. doi: 10.1016/j.envpol.2004.03.012. [DOI] [PubMed] [Google Scholar]
- 29.Cary TL, Chandler GT, Volz DC, Walse SS, Ferry JL. Environ. Sci. Technol. 2004;38:522–528. doi: 10.1021/es034494m. [DOI] [PubMed] [Google Scholar]
- 30.Ribeiro CAO, Vollaire Y, Sanchez-Chardi A, Roche H. Aquat. Toxicol. 2005;74:53–69. doi: 10.1016/j.aquatox.2005.04.008. [DOI] [PubMed] [Google Scholar]
- 31.Halden RU, Paull DH. Environ. Sci. Technol. 2004;38:4849–4855. doi: 10.1021/es049524f. [DOI] [PubMed] [Google Scholar]
- 32.Halden RU, Paull DH. Environ. Sci. Technol. 2005;39:1420–1426. doi: 10.1021/es049071e. [DOI] [PubMed] [Google Scholar]
- 33.Heidler J, Halden RU. Chemosphere. 2007;66:362–369. doi: 10.1016/j.chemosphere.2006.04.066. [DOI] [PubMed] [Google Scholar]
- 34.Heidler J, Halden RU. Environ. Sci. Technol. 2008;42:6324–6332. doi: 10.1021/es703008y. [DOI] [PMC free article] [PubMed] [Google Scholar]
- 35.Matuszewski BK, Constanzer ML, Chavez-Eng CM. Anal. Chem. 2003;75:3019–3030. doi: 10.1021/ac020361s. [DOI] [PubMed] [Google Scholar]
- 36.Stackelberg PE, Gibs J, Furlong ET, Meyer MT, Zaugg SD, Lippincott RL. Sci. Total Environ. 2007;377:255–272. doi: 10.1016/j.scitotenv.2007.01.095. [DOI] [PubMed] [Google Scholar]
- 37.Bester K. Water Res. 2003;37:3891–3896. doi: 10.1016/S0043-1354(03)00335-X. [DOI] [PubMed] [Google Scholar]
- 38.Thomas PM, Foster GD. Environ. Toxicol. Chem. 2005;24:25–30. doi: 10.1897/04-144r.1. [DOI] [PubMed] [Google Scholar]
- 39.Lee HB, Peart TE. Water Qual. Res. J. Can. 2002;37:681–696. [Google Scholar]
- 40.Ying GG, Yu XY, Kookana RS. Environ. Pollut. 2007;150:300–305. doi: 10.1016/j.envpol.2007.02.013. [DOI] [PubMed] [Google Scholar]
- 41.Chalew TEA, Halden RU. J. Am. Water Res. Assoc. 2009;45(1):3–13. doi: 10.1111/j.1752-1688.2008.00284.x. [DOI] [PMC free article] [PubMed] [Google Scholar]
Associated Data
This section collects any data citations, data availability statements, or supplementary materials included in this article.