Abstract
The aim of this study was to compare the intraocular pressure (IOP) profile during the modified diurnal tension curve (mDTC) using Goldman applanation tonometry (GAT) and dynamic contour tonometry (DCT) in treated glaucomatous eyes. Eligible subjects were submitted to the mDTC using GAT and DCT in this sequence. IOP measurements were performed at 8 a.m., 10 a.m., 2 p.m., and 4 p.m.. Central corneal thickness was measured using ultrasound pachymetry in the morning. Statistical analysis was performed using paired Student’s t test and Bland–Altman plot. The mean difference between DCT and GAT measurements was 0.9 mmHg. The mean ± SD IOP measurements during the mDTC were 19.68 ± 4.68, 17.63 ± 4.44, 17.25 ± 5.41, and 17.32 ± 4.25 mmHg using GAT and 19.97 ± 4.75, 18.79 ± 4.61, 19.53 ± 5.30, and 19.43 ± 5.45 mmHg using DCT. IOP measurements were higher in the morning (8 a.m.) and decreased throughout the day using both tonometers. The difference between IOP measurements using GAT and DCT was smaller in the morning and increased throughout the day. The IOP variability using GAT was higher than using DCT. Corneal biomechanical properties might help explain our findings.
Keywords: Glaucoma, Corneal biomechanics, Intraocular pressure, Dynamic contour tonometry, Tension curves
Introduction
Intraocular pressure (IOP) is the main risk factor for glaucoma development and progression [1–5]. However, accurate evaluation of IOP measurements and profile are subject to different confounding variables, such as daytime fluctuation [6–8] and corneal biomechanical properties [9–12].
The role of IOP fluctuation in glaucoma progression has been extensively discussed in the literature [7, 13–15], with great emphasis on the importance of serial IOP measurements during the day in order to detect peaks that otherwise would not be detected during single office hour measurements [7, 8]. Nevertheless, 24-h IOP monitoring may be unfeasible and time-consuming for both patients and physicians, which turns it into a restricted tool in clinical practice. Alternatively, modified diurnal tension curve (mDTC) gives summarized information of the 24-h DTC. It involves four to five IOP measurements every 2 h during office hours and gives the clinician more information in a feasible and practical way.
Goldman applanation tonometry (GAT) has been widely used for the past 50 years as the gold standard of IOP measurement [16]. Yet, its accuracy has been questioned due to the influence of corneal biomechanical properties, which may result in overestimation or underestimation of the IOP [9, 17, 18]. The dynamic contour tonometer (DCT) is a novel digital non-applanation contact tonometer designed to be largely independent of the structural properties of the cornea, possibly providing IOP measurements closer to the real intraocular pressure [19]. It is a useful tool when the clinician suspects of inaccurate IOP measurements (such as statistically thicker or thinner corneas).
There is little information available in the literature about diurnal IOP variability using DCT. The aim of this paper was to compare the IOP profile during the mDTC using GAT and DCT in glaucomatous eyes under topical treatment.
Materials and methods
Patients from the University of Sao Paulo Glaucoma Center were recruited during the follow-up period of 2 months. Informed consent was obtained from all participants. The study was approved by the Institution’s Committee of Ethics and followed the tenets of the Declaration of Helsinki.
All patients were diagnosed with primary open angle glaucoma based on the presence glaucomatous optic neuropathy [20] and typical standard automated perimetry (Humphrey SAP 24-2 SITA, Carl Zeiss, Dublin, CA, USA) visual field (VF) defects [21] in at least two reliable consecutive examinations. All VFs had reliability indices of less or equal than 25% fixation losses, 33% false positive responses, and 33% false negative responses. This study was part of a major cohort that included patients on topical prostaglandin analogs, so all enrolled subjects were on topical treatment with this class of medication.
Eyes with severe VF damage (MD < −12 dB), submitted to previous intraocular surgery, with significant media opacities or choriorretinal diseases were excluded.
All eligible patients were submitted to the mDTC using GAT (Haag Streit, Koeniz, Switzerland) and DCT (SMT Swiss Microtechnology AG, Zurich, Switzerland), in this sequence, with a 5-min interval break. For each tonometer, the average of two IOP measurements was recorded at each time point. Tonometry was performed at 8 a.m., 10 a.m., 2 p.m., and 4 p.m. by two ophthalmologists (A.K.B and A.R). In order to avoid observer bias, one modality of tonometry was performed by each investigator in a masked fashion.
The DCT provides a score (Q) representing the quality of the IOP measure. The score ranges from 1 (optimum) to 5 (unacceptable). For the present study, only measurements with Q scores of 1 or 2 were considered for analysis. DCT provides an objective digital readout of the IOP on a liquid crystal display; prior knowledge of GAT measurements would not influence DCT measurements. Therefore, GAT measurements always were performed before DCT measurements.
Main outcome measures
Central corneal thickness (CCT) was measured in the morning in each eye using ultrasound pachymetry before the first IOP measurement. An average of five measurements was calculated for further analysis. IOP values using both tonometers at each time point of the mDTC, as well as the diurnal fluctuation (SD of each eye’s IOP measurements) were analyzed.
Agreement between IOP measurements using GAT and DCT was analyzed using Bland–Altman plot [22]. Comparison between means was performed using paired Student’s t test using MedCalc Statistics (MedCalc®, Inc., Belgium). Statistical significance was considered at p < 0.05.
Results
Twenty patients (40 eyes) were enrolled (75% were women and 60% Caucasians). Their average age was 54 years (range, 38–71).The mean CCT was 545.6 μm (range, 524–543).
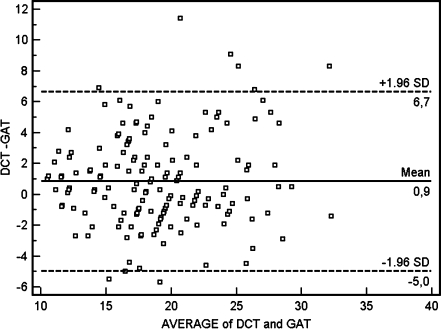
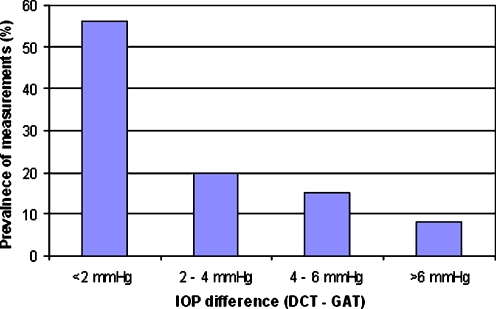
Figure 1 shows the agreement between IOP measurements using GAT and DCT. The mean difference (DCT − GAT) was 0.9 mmHg with a 95% confidence interval (95%CI) between −0.3 and 2.1 mmHg. Figure 2 shows the frequency distribution of differences between DCT and GAT during the day.
Fig. 1.
Agreement between intraocular pressure (IOP) values using Goldman applanation tonometry (GAT) and dynamic contour tonometry (DCT). The 95% confidence interval of the mean ranged between −0.3 and 2.1 mmHg
Fig. 2.
Frequency distribution of differences between dynamic contour tonometry (DCT) and Goldman applanation tonometry (GAT) during the day
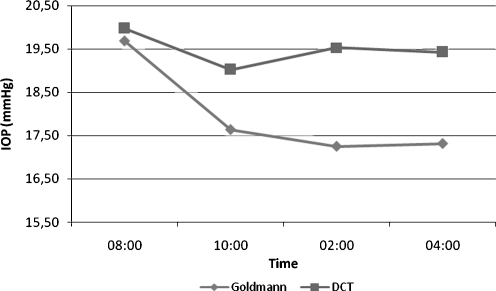
The mean IOP measurements during the mDTC were 19.68 ± 4.68, 17.63 ± 4.44, 17.25 ± 5.41, and 17.32 ± 4.25 mmHg using GAT and 19.97 ± 4.75, 18.79 ± 4.61, 19.53 ± 5.30, and 19.43 ± 5.45 mmHg using DCT. Paired Student’s t test showed significant difference between morning (8 a.m.) and afternoon (2 and 4 p.m.) IOP measurements using DCT or GAT (Fig. 3). No significant difference was observed between GAT and DCT measurements at 8 a.m. (mean difference = 0.3 ± 3.0 mmHg). After 10 a.m., the difference became significant and remained throughout the day. Short-term IOP variability (SD) was greater using GAT than DCT (2.20 ± 0.80 and 1.80 ± 1.28 mmHg, respectively, p = 0.035).
Fig. 3.
Mean intraocular pressure (IOP) profile during the modified diurnal tension curve (mDTC) using Goldman applanation tonometry (GAT) and dynamic contour tonometry (DCT). *Paired samples Student’s t test showed signifficant difference between morning (8 a.m.) and afternoon (2 and 4 p.m.) IOP measurements using GAT and DCT (p < 0.001). *Paired samples Student’s t test did not show significant differences between GAT and DCT IOP measurements at 8 a.m. (p = 0.54). At 10 a.m., the difference was significant (p < 0.001) and remained throughout the day
Discussion
Both DCT and GAT showed higher IOP measurements in the morning than during the day. GAT and DCT showed good agreement with a mean difference of approximately 1.0 mmHg, whereas their differences became more significant as the average IOP increased (graph 1).The mean DCT IOP was higher than GAT IOP at all times during the mDTC, which is consistent with previous reports [18, 23]. This difference was less significant in the morning and tended to increase during the day (Fig. 3).
Kida et al. [24] demonstrated a 24-h variability of CCT and IOP in normal individuals in a sleep laboratory. Their results showed a diurnal-to-nocturnal CCT difference of 14.3 μm associated with an IOP nocturnal elevation with no change in corneal hysteresis using the ocular response analyzer. They suggested that the increase in CCT could be a result of nighttime hydration of the corneal stroma as a response to hypoxic aggression, leading to an increase in CCT that lasted from 11:30 p.m. to 7:30 a.m. followed by an IOP increase. However, the authors observed that a small 24-h CCT fluctuation could not account for a 24-h IOP fluctuation, since other factors are involved in the IOP diurnal variation. Previous studies demonstrated that little edema caused by hypoxic stress in contact lens wearers results in an increase in corneal resistance factor and IOP [25, 26], leading to overestimation of IOP measurements using GAT [26]. In our study, such overestimation could help explain less significant differences between GAT and DCT measurements in the morning (Fig. 3).
The short-term IOP variability using GAT was higher than DCT and this may be explained at least in part by diurnal changes in corneal biomechanical properties. The role of IOP fluctuation using GAT in glaucoma progression has been extensively evaluated [7, 13–15]. However, the relevance of such parameter measured by DCT is still to be determined. As this study demonstrated, they are statistically different. Moreover, all patients in this study were on prostaglandin analogs, so our results cannot be extrapolated to untreated individuals or those on other classes of antiglaucoma medication, as there are some suggestions in the literature that topical medications may modulate the extracellular matrix and may alter corneal thickness in ocular hypertensives and glaucoma patients [27, 28]. Also, by using a simplified 24-h curve, we may have missed important information that could be obtained from nighttime measurements regarding the two modalities of tonometry.
In conclusion, intraocular pressure profile during the mDTC in glaucomatous eyes is different when assessed by GAT and DCT. Further studies are necessary to understand the role of CCT and corneal biomechanics in the assessment of the IOP profile using GAT and DCT.
Acknowledgments
Open Access
This article is distributed under the terms of the Creative Commons Attribution Noncommercial License which permits any noncommercial use, distribution, and reproduction in any medium, provided the original author(s) and source are credited.
Footnotes
Financial disclosure
The authors have no financial interest in this article.
References
- 1.Leske MC, Heijl A, Hussein M, Early Manifest GlaucomaTrial Group et al. Factors for glaucoma progression and the effect of treatment: the Early Manifest Glaucoma Trial. Arch Ophthalmol. 2003;121:48–56. doi: 10.1001/archopht.121.1.48. [DOI] [PubMed] [Google Scholar]
- 2.Kass MA, Heuer DK, Higginbotham EJ, Ocular Hypertension Treatment Study Group et al. The Ocular Hypertension Treatment Study: a randomized trial determines that topical ocular hypotensive medication delays or prevents the onset of primary open-angle glaucoma. Arch Ophthalmol. 2002;120:701–713. doi: 10.1001/archopht.120.6.701. [DOI] [PubMed] [Google Scholar]
- 3.Lichter PR, Musch DC, Gillespie BW, CIGTS Study Group et al. Interim clinical outcomes in the Collaborative Initial Glaucoma Treatment Study comparing initial treatment randomized to medications or surgery. Ophthalmology. 2001;108:1954–1965. doi: 10.1016/S0161-6420(01)00873-9. [DOI] [PubMed] [Google Scholar]
- 4.AGIS Investigators, The Advanced Glaucoma Intervention Study (AGIS): 7 The relationship between control of intraocular pressure and visual field deterioration. Am J Ophthalmol. 2000;130:429–440. doi: 10.1016/S0002-9394(00)00538-9. [DOI] [PubMed] [Google Scholar]
- 5.Collaborative Normal-Tension Glaucoma Study Group The effectiveness of intraocular pressure reduction in the treatment of normal-tension glaucoma. Am J Ophthalmol. 1998;126:498–505. doi: 10.1016/S0002-9394(98)00272-4. [DOI] [PubMed] [Google Scholar]
- 6.Liu JH. Diurnal measurement of intra-ocular pressure. J Glaucoma. 2001;10:39–41. doi: 10.1097/00061198-200110001-00015. [DOI] [PubMed] [Google Scholar]
- 7.Asrani S, Zeimer R, Wilensky J, et al. Large diurnal fluctuations in intraocular pressure are an independent risk factor in patients with glaucoma. J Glaucoma. 2000;9:134–142. doi: 10.1097/00061198-200004000-00002. [DOI] [PubMed] [Google Scholar]
- 8.Drance SM. Diurnal variation of intra-ocular pressure in treated glaucoma. Arch Ophthalmol. 1963;70:302–311. doi: 10.1001/archopht.1963.00960050304004. [DOI] [PubMed] [Google Scholar]
- 9.Doughty MJ, Zaman ML. Human corneal thickness and its impact on intraocular pressure measures: a review and meta-analysis approach. Surv Ophthalmol. 2000;44:367–408. doi: 10.1016/S0039-6257(00)00110-7. [DOI] [PubMed] [Google Scholar]
- 10.Shimmyo M, Ross AJ, Moy A, Mostafavi R. Intraocular pressure, Goldmann applanation tension, corneal thickness, and corneal curvature in Caucasians, Asians, Hispanics, and African Americans. Am J Ophthalmol. 2003;136:603–613. doi: 10.1016/S0002-9394(03)00424-0. [DOI] [PubMed] [Google Scholar]
- 11.Liu J, Roberts CJ. Influence of corneal biomechanical properties on intraocular pressure measurement: quantitative analysis. J Cataract Refract Surg. 2005;31:146–155. doi: 10.1016/j.jcrs.2004.09.031. [DOI] [PubMed] [Google Scholar]
- 12.Medeiros FA, Weinreb RN. Evaluation of the influence of corneal biomechanical properties on intraocular pressure measurements using the ocular response analyzer. J Glaucoma. 2006;15:364–370. doi: 10.1097/01.ijg.0000212268.42606.97. [DOI] [PubMed] [Google Scholar]
- 13.Nouri-Mahdavi K, Hoffman D, Coleman AL, et al. Predictive factors for glaucomatous visual field progression in the Advanced Glaucoma Intervention Study. Ophthalmology. 2004;111(9):1627–1635. doi: 10.1016/j.ophtha.2004.02.017. [DOI] [PubMed] [Google Scholar]
- 14.Bergea B, Bodin L, Svedbergh B. Impact of intraocular pressure regulation on visual fields in open-angle glaucoma. Ophthalmology. 1999;106:997–1004. doi: 10.1016/S0161-6420(99)00523-0. [DOI] [PubMed] [Google Scholar]
- 15.Bengtsson B, Leske MC, Hyman L, Early Manifest Glaucoma Trial Group et al. Fluctuation of intraocular pressure and glaucoma progression in the Early Manifest Glaucoma Trial. Ophthalmology. 2007;114:205–209. doi: 10.1016/j.ophtha.2006.07.060. [DOI] [PubMed] [Google Scholar]
- 16.Goldmann H, Schmidt T. Uber applanationstonometrie. Ophthalmologica. 1957;134:221–242. doi: 10.1159/000303213. [DOI] [PubMed] [Google Scholar]
- 17.Ehlers N, Bransen T, Sperling S. Applanation tonometry and central corneal thickness. Acta Ophthalmol. 1975;53:34–43. doi: 10.1111/j.1755-3768.1975.tb01135.x. [DOI] [PubMed] [Google Scholar]
- 18.Bhan A, Browning AC, Shah S, et al. Effect of corneal thickness on intraocular pressure measurements with the pneumotonometer, Goldmann applanation tonometer and Tono-pen. Invest Ophthalmol Vis Sci. 2002;43:1389–1392. [PubMed] [Google Scholar]
- 19.Kaufman C, Bachmann LM, Thiel MA. Intraocular pressure measurements using dynamic contour tonometry after laser in situ keratomileusis. Invest Ophthalmol Vis Sci. 2003;44:3790–3794. doi: 10.1167/iovs.02-0946. [DOI] [PubMed] [Google Scholar]
- 20.Jr Susanna R, Medeiros FA. The glaucomatous optic disc. In: Jr Susanna R, Medeiros FA, editors. The optic nerve in glaucoma. Rio de Janeiro: Cultura Medica; 2006. pp. 13–47. [Google Scholar]
- 21.Jr Susanna R, Medeiros FA. Defeitos de campo visual no glaucoma. In: Jr Susanna R, Medeiros FA, editors. Perimetria computadorizada: interpretacao e discussao de casos. 2. Rio de Janeiro: Cultura Medica; 2005. pp. 61–89. [Google Scholar]
- 22.Bland JM, Altman DG. Measuring agreement in method comparison studies. Stat Methods Med Res. 1999;8:135–160. doi: 10.1191/096228099673819272. [DOI] [PubMed] [Google Scholar]
- 23.Doyle A, Lachkar Y. Comparison of dynamic contour tonometry with Goldman applanation tonometry over a wide range of central corneal thickness. J Glaucoma. 2005;14:288–292. doi: 10.1097/01.ijg.0000169393.40298.05. [DOI] [PubMed] [Google Scholar]
- 24.Kida T, Liu JH, Weinreb RN. Effect of 24-hour corneal biomechanical changes on intraocular pressure measurement. Invest Ophthalmol Vis Sci. 2006;47:4422–4426. doi: 10.1167/iovs.06-0507. [DOI] [PubMed] [Google Scholar]
- 25.Lu F, Xu S, Qu J, et al. Central corneal thickness and corneal hysteresis during corneal swelling induced by contact lens wear with eye closure. Am J Ophthalmol. 2007;143:616–622. doi: 10.1016/j.ajo.2006.12.031. [DOI] [PubMed] [Google Scholar]
- 26.Hamilton KE, Pye DC, Hali A, et al. The effect of contact lens induced corneal edema on Goldmann applanation tonometry measurements. J Glaucoma. 2007;16:153–158. doi: 10.1097/01.ijg.0000212277.95971.be. [DOI] [PubMed] [Google Scholar]
- 27.Brandt JD, Gordon MO, Beiser JA, Ocular Hypertension Treatment Study Group et al. Changes in central corneal thickness over time: the ocular hypertension treatment study. Ophthalmology. 2008;115:1550–1556. doi: 10.1016/j.ophtha.2008.02.001. [DOI] [PubMed] [Google Scholar]
- 28.Sen E, Nalcacioglu P, Yazici A, et al. Comparison of the effects of latanoprost and bimatoprost on central corneal thickness. J Glaucoma. 2008;17:398–402. doi: 10.1097/IJG.0b013e31815d784c. [DOI] [PubMed] [Google Scholar]


