

Abstract
Recently, experiments have been performed to determine the micromechanical behavior of the cement-bone interface under tension-compression loading conditions. These experiments were simulated using finite element analysis (FEA) to test whether the micromechanical response of the cement-bone interface could be captured in micro-models. Cement-bone interface models were created of experimental specimens based upon micro-computed tomography data, including the complex interdigitated bone-cement morphology and simulated frictional contact at the interface. The models were subjected to a fully reversible tension-compression load, mimicking the experimental protocol. Similar to what was found experimentally, the simulated interface was stiffer in compression than in tension and the majority of displacement localized to the cement-bone interface. There was a weak correlation between the FEA predicted stiffness and the stiffness found experimentally, with average errors of 8.3 and 29.8% in tension and compression, respectively. The hysteresis behavior found experimentally was partially reproduced in the simulation by including friction at the cement-bone interface. Furthermore, stress analysis suggested that cement was more at risk of fatigue failure than bone, concurring with the experimental observation that more cracks were formed in the cement than in the bone. The current study provides information that may help to better understand the load transfer mechanisms taking place at the cement-bone interface.
Keywords: bone, bone cement, interface, finite element
INTRODUCTION
Finite element analysis (FEA) is a valuable tool for investigation of the mechanical behavior of total hip arthroplasty. One of its main advantages is the ability to isolate clinical variables and study their effect on the mechanical behavior of reconstructions in a highly controlled manner. In the past, FEA has been used to analyze various aspects of total hip arthroplasty, such as implant migration,1,2 the effect of implant design and material on long-term mechanical survival,3–5 debonding of the implant-cement interface6,7 and micro-motions at the implant-bone interface.8,9
The fidelity of FEA studies depends on the accuracy and completeness of the experimental and clinical data that is used as input for the models. Much data is already available on the mechanical properties and behavior of implants, bone cement,10,11 the implant-cement interface12,13 and bone.14–16 Research on the cement-bone interface, however, has mainly been focused on the strength of the interface at an apparent level,17–23 while relatively little is known about the multifaceted micromechanical behavior of the interface.
The cement-bone interface consists of complex structures of cement penetrating into the cortical bone structure and filling up inter-trabecular marrow spaces, thereby creating a highly variable interlock between bulk cement and bone. The cement-bone interface provides the fixation of the cement mantle in the femur. Hence, the stability of the cement mantle and the implant is directly dependent on the mechanical behavior of the cement-bone interface.
Recently, experiments have been performed to determine the micromechanical behavior of the cement-bone interface.24 Small laboratory cement-bone specimens containing that interdigitated cement-bone interface were loaded in fully reversible tension-compression, while monitoring the local micromotion of the cement, bone and the cement-bone interface. The results showed that the majority of the displacement response localized at the cement-bone interface region. The cement-bone interface had a relatively low stiffness compared to that of the adjacent bone and cement, and the interface was more compliant in tension than in compression. Substantial hysteresis occurred during one tension-compression cycle. Upon failure loading, more cracks were found in the cement than in the bone, indicating that the cement is the weaker material at the cement-bone interface.
The goal of the present study was to assess whether realistic FEA simulations of cement-bone interface experiments could be performed in an effort to understand the micromechanics of this interface more thoroughly. For this purpose, FEA models were created based on micro computed tomography (μCT) data of the actual experimental specimens. These models included the complex interdigitated bone-cement morphology, with simulated frictional contact at the interface. We investigated the following hypotheses using μFEA models of the cement-bone structures containing the interdigitated cement-bone interface: (1) μFEA models can produce a cement-bone interface stiffness that is similar to experimental observations in both tension and compression loading; (2) Deformations of μFEA models will localize to the cement-bone interface while the cement and bone will have a limited contribution to global deformation; (3) Including friction at the cement-bone interface will result in a hysteresis behavior similar to the experimental findings; (4) The quantity of cement at risk of fatigue failure is greater than that of bone.
METHODS
Experimental Methods
The experimental protocol will be briefly reviewed since it served as a basis for the FEA simulations performed here. Ten cement-bone interface specimens were prepared from in vitro cemented total hip arthroplasties in fresh-frozen proximal femurs (six femurs, mean age 74, 4 male).24 The reconstructions were prepared using third generation cementing techniques. Following cement cure, specimens containing the cement-bone interface were sectioned from the reconstructions (10x10x5 mm) and were scanned at an isotropic resolution of 12 µm (Scanco μCT 40, Scanco Medical AG, Basserdorf, Switzerland). The specimens were cut from various parts of the reconstruction (2 medial, 2 lateral, 3 anterior, 3 posterior), at different levels of the reconstruction (ranging from 40 to 110 mm below resection level).
The specimens were loaded for 10 cycles of fully reversible tension and compression, with a displacement amplitude of 10 µm based on grip-to-grip displacement. The applied stress and local deformations were measured during the tenth cycle. The local deformations were measured using digital image correlation (DIC) techniques.24 For each specimen twelve sampling points were taken: three columns of four sampling points located in the bone (two points) and the cement (two points) (Figure 1a). The experimental sampling points were chosen immediately adjacent to the interface and in the bulk of the cement and bone. Due to the large intra- and inter-sample variability, it was not possible to use equidistant sampling points, particularly in case of the contact interface. By tracking the displacements of these points, the deformation of the bone, cement and the cement-bone interface could be calculated separately. The results of the three columns were averaged to establish the 'global' deformations of the bone, cement and interface.
Figure 1.
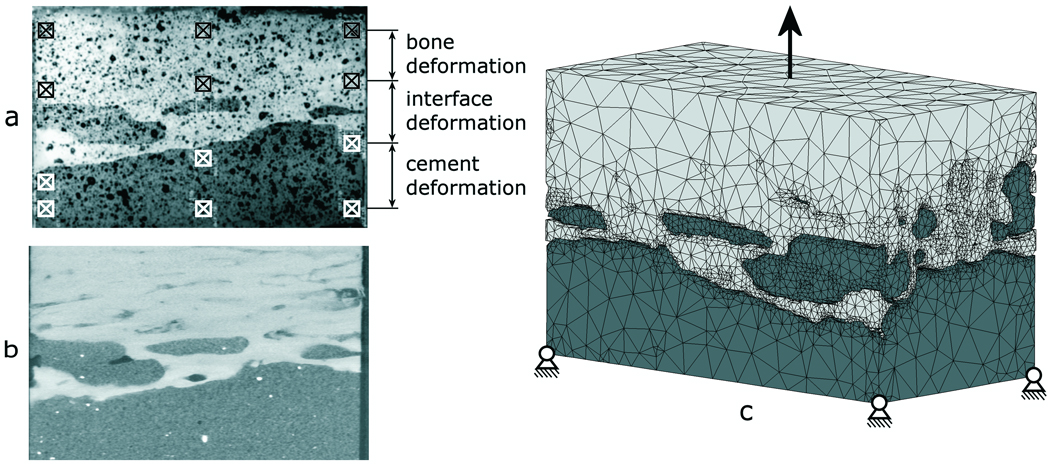
a) Image of an experimental specimen in which 12 DIC sampling points are indicated b) μCT slice and c) an FEA model of the cement-bone interface specimen. The boundary conditions as indicated are simplified with respect to the actual applied conditions.
Stress-displacement curves were generated from which the stiffness of the cement, bone and cement-bone interface in tension and compression were calculated, as well as the relative motion of the bone, cement and cement-bone interface. Finally, the hysteresis during one tension-compression cycle was determined, expressed as the horizontal span of the stress-displacement curve as it crossed the x-axis.
Finite Element Model
FEA models of the cement and bone were created based upon μCT data of the ten experimental specimens (Figure 1b) using image processing and solid modeling software (Mimics 11.1, Materialise, Leuven, Belgium). Segmentation of the μCT data was performed based on the local grayscale, which ranged from −1,000 to 3,071 (cement −100 to 999, bone 1,000 to 3,071). Gaps in the segmented data (due to high grayscale BaSO4 in the cement or cavities in the bone) were filled manually. Region growing operations were performed on the cement and bone to exclude small particles that were not connected to the bulk cement or bone. After a Boolean subtraction operation between cement and bone to prevent initial mesh penetration, a one-voxel (12 µm) erosion operation was performed on the cement to prevent mesh penetration during the subsequent remeshing procedure. Triangular surface meshes were created for the bone and cement objects using a 6×6×6 voxel interpolation (based on the original μCT data set) to limit the number of elements to a reasonable level for analysis. This entailed that the triangular surfaces were based on outer contours that were interpolated over six voxels in the transversal and longitudinal direction. During surface meshing, one iteration of smoothing was applied with a smooth factor of 0.5. The surface meshes were further remeshed to adjust elements with poor aspect ratios and further reduce the number of triangular elements (split-based remeshing, 2 iterations, min. edge length 7.5 µm, max. edge length 1.0 mm, max. geometrical error 15 µm). The meshes were then exported to an FEA pre-processor for solid modeling (Patran 2005r2, MSC Software Corporation, Santa Ana, CA, USA). The resulting models (cement + bone) consisted on average of approximately 300,000 tetrahedral elements and 71,000 nodal points (Figure 1c). All models were aligned with the experimental orientation based on digital images that were taken for the DIC-measurements during the experiments.
The bone and cement were considered to be linear elastic materials. The bone material properties were assigned based upon the μCT grayscale values. The elements were mapped back to the original μCT-data set, after which the weighted average of the grayscale was calculated for each element (Mimics11.1, Materialise, Leuven, Belgium). The element grayscale values were converted to equivalent HA-densities by means of a calibration phantom. Subsequently, a linear relationship between the HA-density and the Young's modulus was assumed,25 resulting in bone stiffness values ranging from 0.1 to 20,000 MPa (ν=0.3). The cement was assumed to have constant material properties (E=3,000 MPa; ν=0.3).
Contact between the cement and bone was modeled using a double-sided node-to-surface contact algorithm (MSC.Marc2007, MSC Software Corporation, Santa Ana, CA, USA). Contact between the cement and bone was assumed to be debonded from the start of the simulation, meaning that tensile loads could only be transferred over the interface by means of an interlock of the cement and bone, rather than by a gluing capacity of the cement. Friction at the interface was modeled using a bilinear Coulomb friction model, assuming a friction coefficient of 0.3.
Quantifying the Interface Gap and Assessment of Mesh Accuracy
The gap at the interface between the cement and bone was quantified for the original segmented μCT data and the tetrahedral FEA models. A stereology approach was used in which the gap between the cement and bone was measured at 32 equidistant (1.0 mm spacing) locations over the surface of the interface for each specimen. The gap was measured using image processing software (Mimics 11.1, Materialise, Leuven, Belgium) with a resolution of 10 microns. A scatter plot was created for the μCT and FEA data to allow comparison between the nature of the gap distributions measured and simulated at the interface. The difference between the μCT and FEA gap measurements on a point-by-point basis was used to determine the error in the mesh generation procedure.
Model Loading
The models were loaded for a cycle of fully reversible tension and compression, mimicking the experimental protocol. During the simulation, the distal end of the cement was fixed in all directions, while the proximal end of the bone was displaced in the longitudinal direction (Figure 1c). The displacements were applied to a node rigidly linked to all nodes of the proximal bone surface. This restricted tilting of the bone, while allowing for displacement in the transversal directions. The experimental results indicated that during tension-compression loading of the specimens slip had occurred at the grips. We therefore decided to load the specimens based on the applied apparent stress levels, rather than to apply a displacement amplitude of 10 µm. Thus, the proximal end of the bone was displaced with incremental steps of 1.0 µm until the maximal levels of tension and compression measured during the experiment were reached.
Stress-displacement curves were calculated by mimicking the experimental DIC-measurements. The twelve sampling points (Figure 1a) were reproduced in the FEA models to calculate the deformations of the bone, cement and the cement-bone interface. To allow for settling of the contact algorithm, the first part of the loading curve (from zero to full tension) was ignored. The subsequent full tension-compression cycle was used for analysis of the results.
From the calculated stress-displacement curves, the stiffness of the cement-bone interface in tension and compression were calculated, as well as the relative motion of the bone, cement and cement-bone interface and the horizontal span of the curve. We furthermore investigated whether there was a correlation between the contact area and the stiffness in tension and compression. The contact area was calculated previously from μCT data of the specimens.24 The stress distributions in the bone and cement were calculated at maximum tension and compression loading state. The stress distributions were normalized and expressed in terms of the applied apparent stress level. Additionally, the volumes of bone and cement at risk for fatigue failure were calculated. As a fatigue limit for bone and cement, the stress level was taken at which failure would occur after 1.0 million loading cycles (10 and 60 MPa for cement and bone, respectively).11,26
RESULTS
The correlation plot showed a similar pattern for the μCT and FEA mesh stereology measurements of gap distribution at the cement-bone interface (Figure 2). The FEA mesh tended to underestimate the amount of the interface in direct contact (0 micron gap) when compared to the μCT (7.1% vs. 27.8% of all measurements). However, both had similar distributions (33.7% FEA mesh vs. 36.8% μCT) with gaps less than or equal to the scanner resolution (12 microns). The difference between the FEA and μCT interfacial gap was not normally distributed (Kolmogorov-Smirnov normality test). Results are therefore presented by the median and first and third quartile values. The median error was zero microns with first and third quartile errors of −10 microns and 20 microns, respectively. The range of errors was from −60 to 110 microns, but these were outliers in the data. In point-by-point comparison, 61% of all measurements differed by less than 10 microns for the μCT when compared to the FEA mesh.
Figure 2.
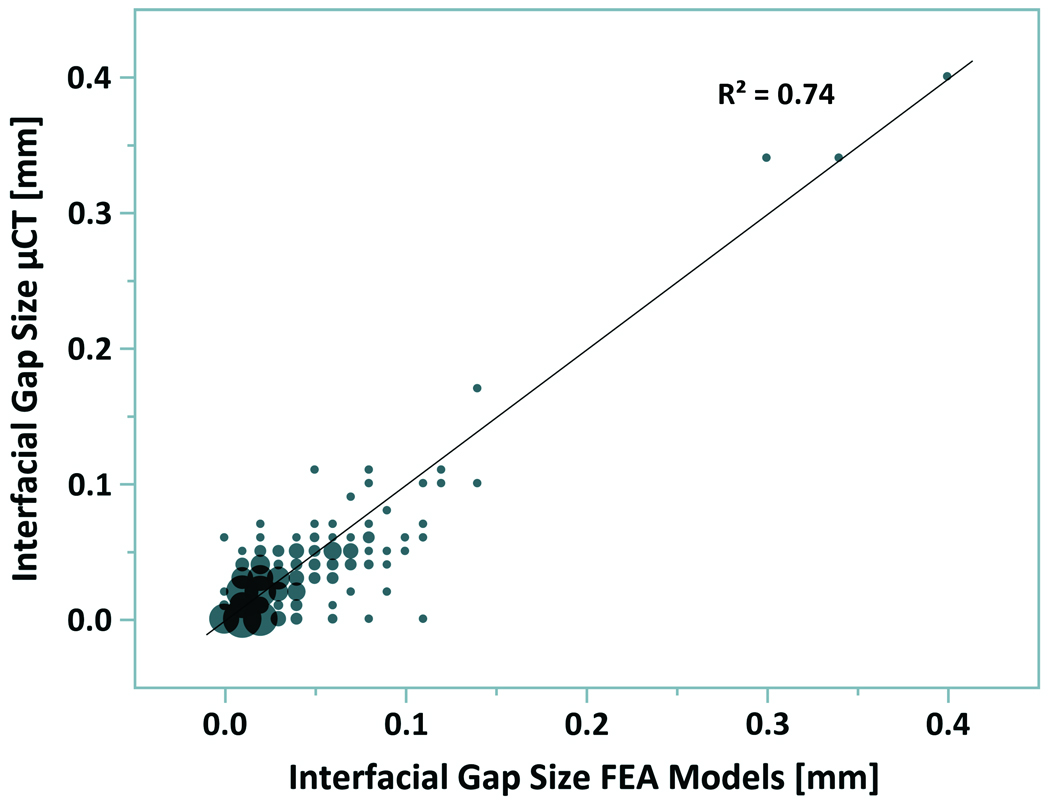
Bubble plot for measurement of gaps at the cement-bone interface from μCT scan data and FEA mesh. Bubble size is proportional to the number of measurements. Data are based on 32 sampling points per specimen using a stereology approach.
The stress-displacement curves predicted by the FEA simulations were similar to those found experimentally (Figure 3). In most cases there was a horizontal shift of the experimental and computational curves with respect to the zero point, caused by settling of the contact algorithm in the FEA models and by running-in phenomena during the first nine cycles of the experimental specimens.
Figure 3.
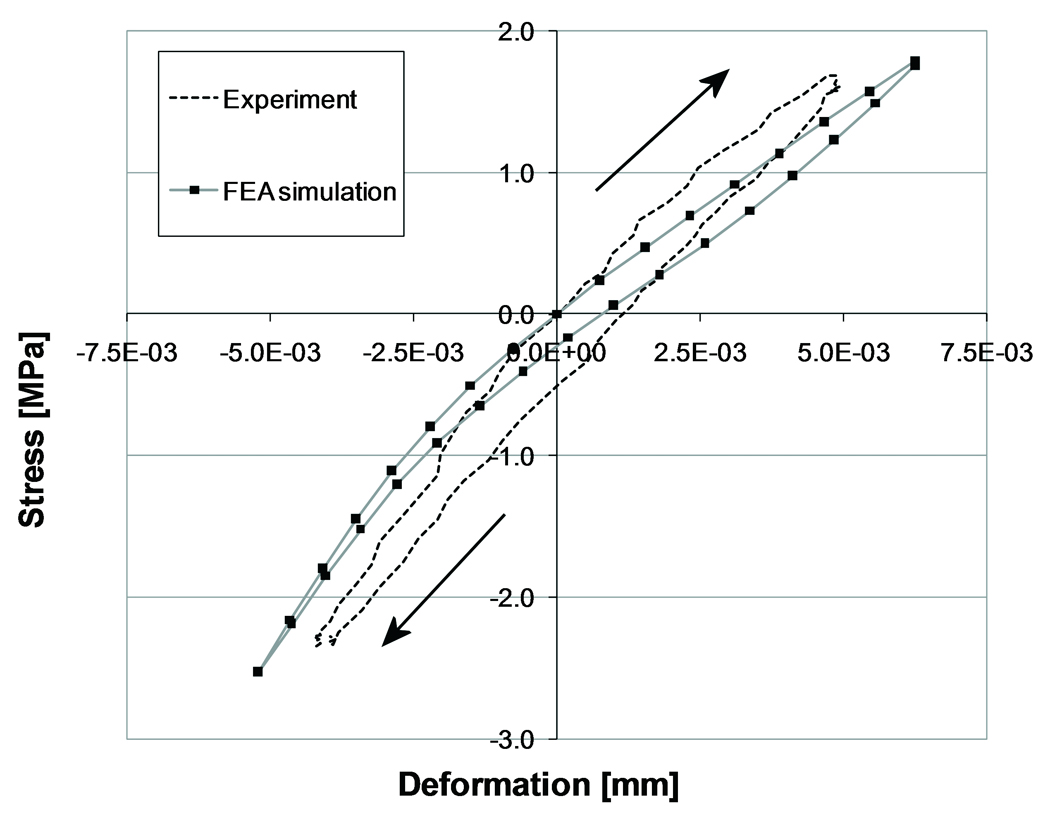
Experimental and computational force-displacement at the contact interface of a single specimen. The arrows indicate the loading direction. For illustrative purposes, the experimental and computational curves have been shifted to make them pass the point of zero stress and displacement.
Consistent with the experimental findings, the predicted FEA stiffness of the interface was higher in compression than in tension, although the FEA tension/compression ratio was somewhat higher than found experimentally (Table 1). There was a weak positive correlation between the stiffness in tension and compression predicted by the FEA simulations and the experimental stiffness (r2 = 0.37, Table 2). The average error between the computational and experimental stiffness was 8.3% and 29.8% in tension and compression, respectively. FEA models in which the stiffness in compression did not correlate well with the experimental stiffness did not automatically also have a weak correlation in tension, and vice versa. There was a weak correlation between the FEA predicted stiffness in tension and compression and the contact area of the specimens (r2 = 0.29 and r2 = 0.16, respectively; Table 2), which was similar to the experimental findings (r2 = 0.21 and r2 = 0.21 for experimentally measured tension and compression, respectively).
Table 1.
Comparison of experimental and computational (FEA) compression/tension stiffness ratio, stress-displacement span, and relative deformation of cement-bone contact as percentage of the total deformation. Mean and standard deviation values are shown for the 10 specimens.
| Test Parameter | Experiments | FEA |
|---|---|---|
| Compression/tension stiffness ratio [−] (S.D.) | 1.35 (0.12) | 1.66 (0.39) |
| Span [µm] (S.D.) | 2.52 (1.36) | 1.66 (1.44) |
| Relative deformation in Tension [% of total] (S.D.) | 88.8 (8.7) | 88.2 (12.2) |
| Relative deformation in Compression [% of total] (S.D.) | 87.3 (10.3) | 81.9 (14.9) |
Table 2.
Stiffness of the cement-bone interface in tension and compression, as measured experimentally and predicted by the FEA simulations. The contact area is given as a measure for the level of cement-bone interdigitation.
| Tensile stiffness [MPa/mm] | Compressive stiffness [MPa/mm] | Contact area [mm2] |
|||
|---|---|---|---|---|---|
| Experimental | FEA | Experimental | FEA | ||
| 1 | 60 | 81 | 86 | 97 | 103 |
| 2 | 113 | 133 | 165 | 171 | 68 |
| 3 | 127 | 45 | 170 | 112 | 35 |
| 4 | 136 | 191 | 195 | 390 | 43 |
| 5 | 213 | 323 | 249 | 585 | 94 |
| 6 | 214 | 319 | 316 | 467 | 91 |
| 7 | 217 | 267 | 208 | 496 | 68 |
| 8 | 270 | 296 | 314 | 408 | 100 |
| 9 | 283 | 110 | 354 | 165 | 37 |
| 10 | 346 | 282 | 458 | 438 | 169 |
The experimental results showed that both in tension and compression the majority of the deformation (more than 80%) took place at the cement-bone interface (Table 2). Similar interface deformations were predicted by the FEA simulations (Table 2). In the experiments the bone deformed more than the cement, both in compression and tension, while in the FEA models the cement deformed more than the bone (Figure 4).
Figure 4.
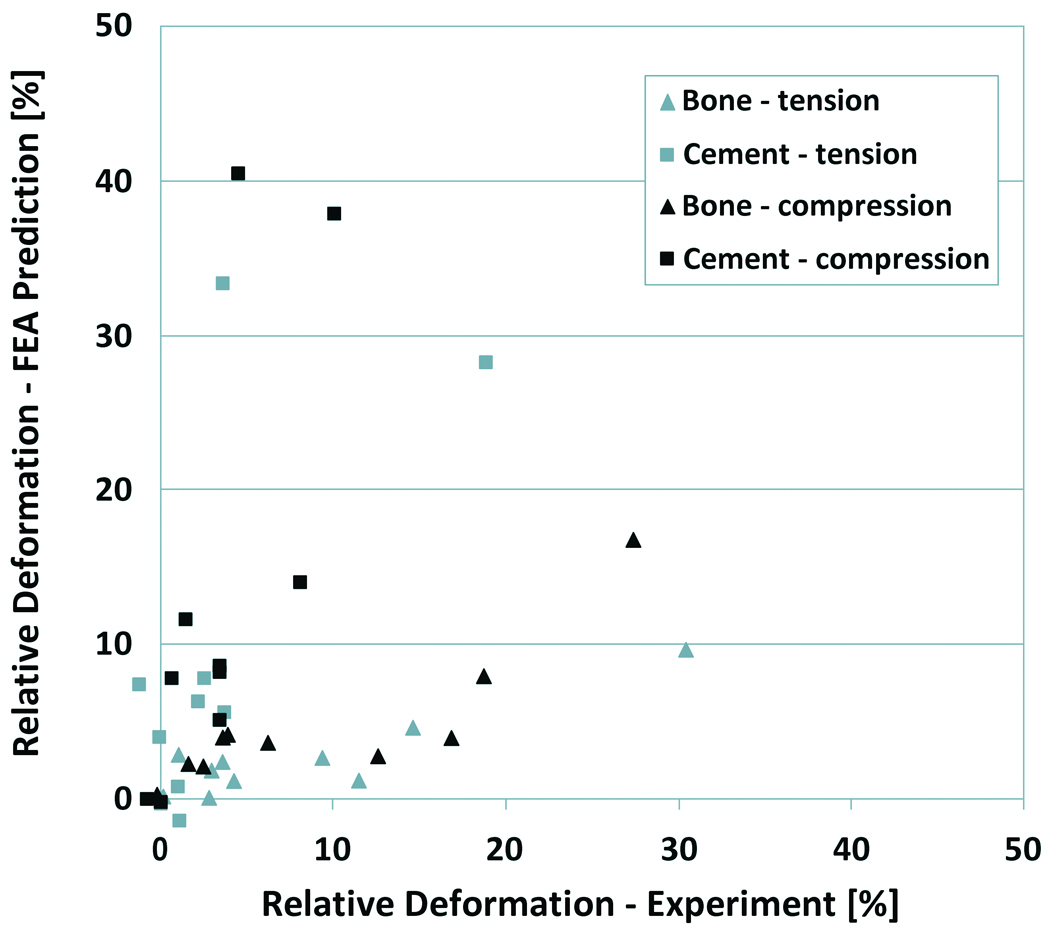
Experimental versus FEA predicted deformation of the bulk cement and bone. The deformations are expressed relative to the total deformation of the cement-bone interface specimens.
Similar to the experiment, the FEA models predicted a horizontal span in the stress-displacement curve (Figure 3). The frictional phenomena simulated at the cement-bone interface of the FEA models tended, however, to underestimate the horizontal span that was found experimentally (Table 1).
Highly stressed areas of the cement and bone indicated regions at the interface where loads were transferred between the cement and bone (Figure 5). At the maximum tension loading state, the maximum principal stress was higher than the applied stress level in 70% of the bone volume and in 63% of the cement volume (Figure 6). At maximum compression state, the minimal principal stress was greater than the applied stress level in 71% of the bone and in 66% of the cement. On average, only 0.01% of the total bone was at risk of fatigue failure, against 0.85% of the cement. Some parts of the models were loaded up to more than 10 times the apparent stress level.
Figure 5.
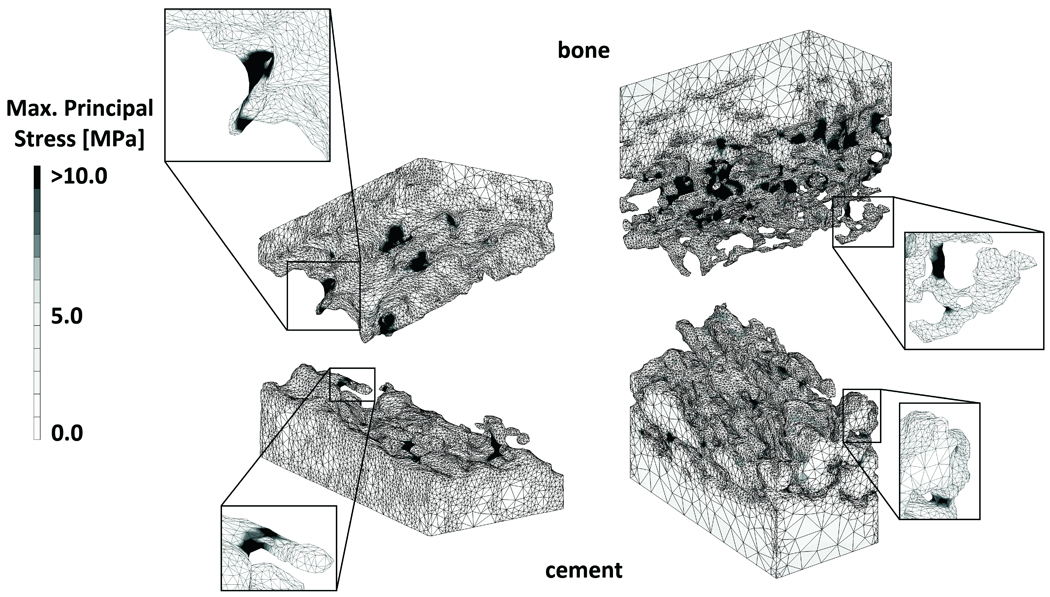
Maximal principal stress distribution in an FEA model with little (left) and a lot of interdigitation (right), under maximal tension load. The enlargements show bone and cement structures that experienced high stress levels, indicating that these structures contributed to load transfer over the cement-bone interface.
Figure 6.
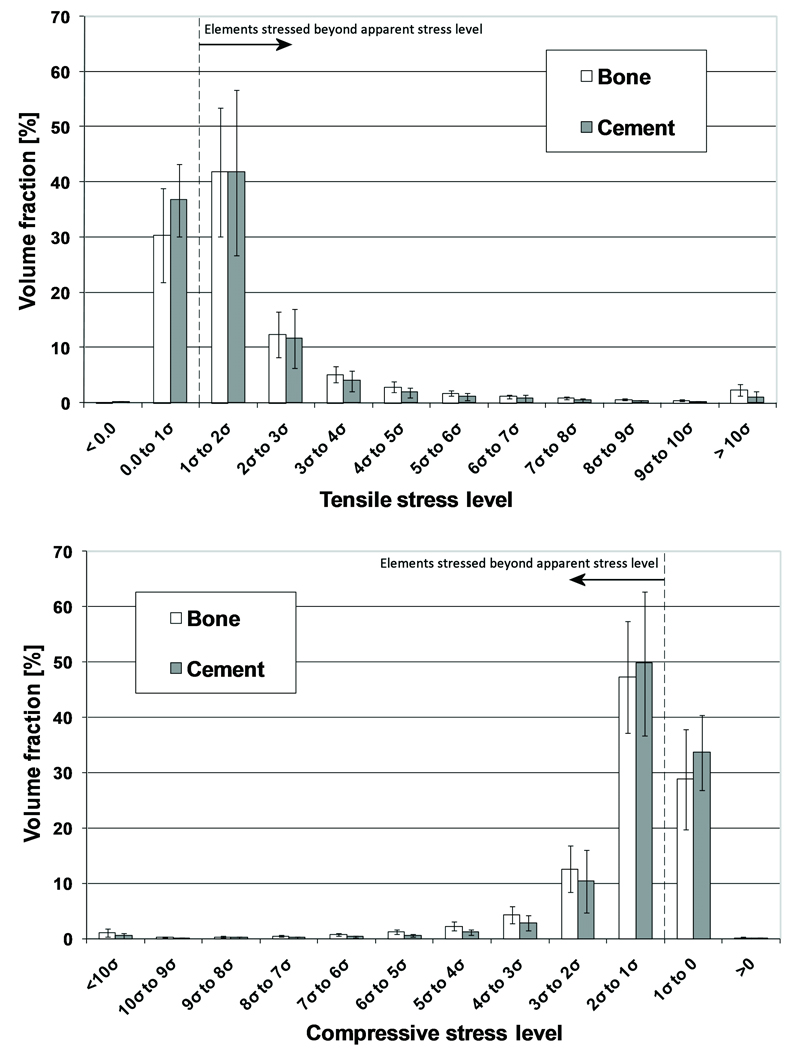
Stress distribution in the bone and cement during maximum tension (top) and compression (bottom). The error bars indicate the standard deviation of the data for each stress level.
DISCUSSION
FEA models of the cement-bone interface using μCT-based morphology with a frictional interface cement and bone led to a structural response that was similar to those found experimentally. Consistent with the experimental findings, the simulated interface stiffness was higher in compression than in tension. There remains, however, room for improvement relative to the correlation between the simulated and experimental stiffness values.
Since we assumed in our models that the cement-bone interface was unbonded, one could argue that the weak correlation between the computational and experimental stiffness values is caused by the fact that cement-bone adhesion was not included in the simulations. Results of a preliminary study with multiple bone-cement interface models showed, however, that when glued contact was assumed at the interface, the stiffness both in tension and compression are overestimated by more than a factor of two.27 Furthermore, other authors previously reported that PMMA has limited adhesive properties to bone.28,29 Considering the presence of fluids in the bone (blood, fat, marrow) at the time of cement insertion, the assumption that cement does not adhere to the bone is very plausible.
Friction at the interface was modeled with a coefficient of 0.3. In a separate parametric study we varied the friction coefficient and investigated its effect on the stiffness and span predicted by the models.27 The results of that study indicated that a lower coefficient led to a stiffness reduction and an increased span. Increasing the friction coefficient had the opposite effect. The friction coefficient chosen for the current study matched the experimental values the closest.
The results of the FEA simulations showed that the majority (more than 80%) of the deformation took place at the interface between the cement and bone, both in tension and compression, which was similar to the experimental findings. This implies that current macroscopic FEA models of cemented total hip reconstructions with a fully bonded cement-bone interface may substantially underestimate the actual local deformations and, subsequently, the stability of the reconstruction. This could be corrected for by interpositioning relatively flexible elements (more flexible in tension than under compression) at the cement-bone interface.
In the current study we focused on the micromechanical behavior of the cement-bone interface under tension-compression loads. The actual in vivo loading conditions are generally more complicated than those studied here, consisting of combinations of tension/compression and shear loads. Currently, experiments are being performed in which the shear behavior of the interface is investigated, as well as the fatigue behavior of the interface. Data from such experiments provide information that can be used to further develop micromechanical FEA models such as presented in the current study.
The simulations predicted more deformation of the cement than bone, while opposite results were found in the experiments. However, the experimental deformations of the cement and bone were relatively small (majority smaller than 1.0 µm), compared to the accuracy of the DIC system used for the measurements (0.395 µm).24 In addition, the cement was assumed to be homogeneous in the FEA models, while in the experiments local artifacts such as the presence of high-stiffness barium sulfate particles may have affected the DIC surface measurements.
The μFEA models underestimated the hysteresis that was noticed in the experimental tension-compression curves. Besides frictional phenomena at the sliding cement-bone interface, other phenomena such as viscoelastic behavior or fluid flow at the interface may have been responsible for this behavior in the experiments. Since in the current study linear elastic isotropic material properties were assigned to the cement and bone, the FEA models were unable to capture viscoelastic material behavior that may have occurred in the experiments, which may explain the underestimation of the hysteresis in the current models.
The additional value of FEA with respect to experimental testing is the ability to evaluate internal stresses in the bone and cement. The current results showed that the stress levels in the majority of the bone and cement adjacent to the interface were higher than the applied stress level, both in tension and compression. This difference between the apparent and local stress levels has previously been demonstrated in microstructural FEA models of trabecular bone.30,31 Our results furthermore showed that more cement than bone was at risk of fatigue failure. This is consistent with the experiments, in which after destructive testing of the interface specimens more cracks were found in the cement than in the bone.24 This can be explained by the fact that the differences between the bone and cement stresses was relatively small, while bone has a higher fatigue strength and ultimate tensile and compressive strength than bone cement.10,11,25,26
The FEA models were relatively successful in recreating the geometry of the interface between cement and bone, but were ultimately limited by the resolution of the CT scanner and geometrical errors generated by the remeshing process. The geometrical errors were generally within one voxel error between the FEA meshes and the segmented μCT data. To assess the relative contributions of interface contact, interlock morphology, and gap width at the cement-bone interface to interface stiffness, a regression model of the original set of experimental data24 was performed. Both contact fraction (p<0.0001) and interlock morphology (p=0.0003) contributed to prediction of the interface tensile stiffness (r2=0.67, p=0.0003). The width of the cement-bone gap did not contribute to the regression model (p=0.60). Also in our FEA models the interfacial gaps correlated poorly with the calculated span (r2=0.0018, p=0.0010) and tensile stiffness (r2=0.022, p=0.0008). This suggests that the magnitude of the gaps has a negligible effect on the actual mechanical behavior of the interface. Thus, it appears the interface micromechanics are dominated by the local morphology such as the interface contact and interlock morphology. This is reasonable because the micromechanical behavior may be more dependent on locations where no gaps (or only small gaps) are present, since at these points load transfer occurs earlier in the loading history than at points that have yet to come in contact.
In the current study we used a linear relationship between the bone density and the Young's modulus.25 Other authors previously used power laws relating the bone density to a certain Young's modulus in case of CT-data,32–34 or a constant tissue modulus in case of μCT data,35,36 based upon the assumption that the μCT resolution is high enough to capture the trabecular structures that would otherwise appear as lower grayscale on normal CT scans. We performed initial analyses with models in which we varied the way of assigning bone material properties, applying a constant bone modulus and various linear and power laws. The results of that study showed that the applied material law had only a minor effect on the current outcome measures, most likely due to the relatively high resolution of our CT-data and due to the relatively large effect of the contact interface mechanics.
Previous FEA models of interfaces in total hip arthroplasty have been focused on debonding processes of the stem-cement interface6,7 and their effects on implant micromotions and cement failure.37,38 Furthermore, research has been conducted on the micromotions and osseointegration of the implant-bone interface in case of uncemented implants.9,39,40 The current study provides information that may help to better understand the load transfer mechanisms taking place at the cement-bone interface.
In summary, the general micromechanical response of the cement-bone interface was reproduced, using only a frictional contact at the interface. This suggests that the cement-bone interface should be regarded as mechanically unbonded. It therefore seems that the initial, post-surgery bond between cement and bone, is purely generated by the interlock rather than by a gluing capacity of bone cement to bone. This emphasizes the importance of obtaining a good mechanical cement-bone interlock during total joint surgery, for instance by using pulse lavage of the intramedullary canal prior to implantation, pressurization of the cement after stem insertion, and possibly adding anchoring holes.
Returning to our original hypotheses, it was determined that (1) μFEA models of the cement-bone interface were able to reproduce stiffness values similar to experimental observations, although there is room for improvement, (2) the majority of the deformation took place at the cement-bone interface while the cement and bone had a limited contribution to the global deformation; (3) by including friction at the cement-bone interface, hysteresis behavior as seen experimentally could partly be simulated; (4) more cement than bone was at risk of fatigue failure.
Acknowledgements
This work was funded by NIH-NIAMS AR42017.
References
- 1.Huiskes R, Verdonschot N, Nivbrant B. Migration, stem shape, and surface finish in cemented total hip arthroplasty. Clin Orthop Relat Res. 1998:103–112. doi: 10.1097/00003086-199810000-00011. [DOI] [PubMed] [Google Scholar]
- 2.Taylor M, Tanner KE, Freeman MA, Yettram AL. Cancellous bone stresses surrounding the femoral component of a hip prosthesis: an elastic-plastic finite element analysis. Med Eng Phys. 1995;17:544–550. doi: 10.1016/1350-4533(95)00018-i. [DOI] [PubMed] [Google Scholar]
- 3.Stolk J, Janssen D, Huiskes R, Verdonschot N. Finite element-based preclinical testing of cemented total hip implants. Clin Orthop Relat Res. 2007;456:138–147. doi: 10.1097/BLO.0b013e31802ba491. [DOI] [PubMed] [Google Scholar]
- 4.Janssen D, Aquarius R, Stolk J, Verdonschot N. Finite-element analysis of failure of the Capital Hip designs. J Bone Joint Surg Br. 2005;87:1561–1567. doi: 10.1302/0301-620X.87B11.16358. [DOI] [PubMed] [Google Scholar]
- 5.Lennon AB, Britton JR, MacNiocaill RF, Byrne DP, Kenny PJ, Prendergast PJ. Predicting revision risk for aseptic loosening of femoral components in total hip arthroplasty in individual patients--a finite element study. J Orthop Res. 2007;25:779–788. doi: 10.1002/jor.20346. [DOI] [PubMed] [Google Scholar]
- 6.Verdonschot N, Huiskes R. Cement debonding process of total hip arthroplasty stems. Clin Orthop Relat Res. 1997:297–307. doi: 10.1097/00003086-199703000-00038. [DOI] [PubMed] [Google Scholar]
- 7.Pérez MA, García-Aznar JM, Doblaré M, Seral B, Seral F. A comparative FEA of the debonding process in different concepts of cemented hip implants. Med Eng Phys. 2006;28:525–533. doi: 10.1016/j.medengphy.2005.09.007. [DOI] [PubMed] [Google Scholar]
- 8.Reggiani B, Cristofolini L, Varini E, Viceconti M. Predicting the subject-specific primary stability of cementless implants during pre-operative planning: preliminary validation of subject-specific finite-element models. J Biomech. 2007;40:2552–2558. doi: 10.1016/j.jbiomech.2006.10.042. [DOI] [PubMed] [Google Scholar]
- 9.Spears IR, Pfleiderer M, Schneider E, Hille E, Morlock MM. The effect of interfacial parameters on cup-bone relative micromotions. A finite element investigation. J Biomech. 2001;34:113–120. doi: 10.1016/s0021-9290(00)00112-3. [DOI] [PubMed] [Google Scholar]
- 10.Lewis G. Properties of acrylic bone cement: state of the art review. J Biomed Mater Res. 1997;38:155–182. doi: 10.1002/(sici)1097-4636(199722)38:2<155::aid-jbm10>3.0.co;2-c. [DOI] [PubMed] [Google Scholar]
- 11.Murphy BP, Prendergast PJ. The relationship between stress, porosity, and nonlinear damage accumulation in acrylic bone cement. J Biomed Mater Res. 2002;59:646–654. doi: 10.1002/jbm.10028. [DOI] [PubMed] [Google Scholar]
- 12.Davies JP, Harris WH. Strength of cement-metal interfaces in fatigue: comparison of smooth, porous and precoated specimens. Clin Mater. 1993;12:121–126. doi: 10.1016/0267-6605(93)90061-b. [DOI] [PubMed] [Google Scholar]
- 13.Mann KA, Bartel DL, Wright TM, Ingraffea AR. Mechanical characteristics of the stem-cement interface. J Orthop Res. 1991;9:798–808. doi: 10.1002/jor.1100090605. [DOI] [PubMed] [Google Scholar]
- 14.Kaneko TS, Pejcic MR, Tehranzadeh J, Keyak JH. Relationships between material properties and CT scan data of cortical bone with and without metastatic lesions. Med Eng Phys. 2003;25:445–454. doi: 10.1016/s1350-4533(03)00030-4. [DOI] [PubMed] [Google Scholar]
- 15.Kaneko TS, Bell JS, Pejcic MR, Tehranzadeh J, Keyak JH. Mechanical properties, density and quantitative CT scan data of trabecular bone with and without metastases. J Biomech. 2004;37:523–530. doi: 10.1016/j.jbiomech.2003.08.010. [DOI] [PubMed] [Google Scholar]
- 16.Taddei F, Pancanti A, Viceconti M. An improved method for the automatic mapping of computed tomography numbers onto finite element models. Med Eng Phys. 2004;26:61–69. doi: 10.1016/s1350-4533(03)00138-3. [DOI] [PubMed] [Google Scholar]
- 17.Arola D, Stoffel KA, Yang DT. Fatigue of the cement/bone interface: the surface texture of bone and loosening. J Biomed Mater Res B Appl Biomater. 2006;76:287–297. doi: 10.1002/jbm.b.30364. [DOI] [PubMed] [Google Scholar]
- 18.Bean DJ, Convery FR, Woo SL, Lieber RL. Regional variation in shear strength of the bone-polymethylmethacrylate interface. J Arthroplasty. 1987;2:293–298. doi: 10.1016/s0883-5403(87)80062-1. [DOI] [PubMed] [Google Scholar]
- 19.Dohmae Y, Bechtold JE, Sherman RE, Puno RM, Gustilo RB. Reduction in cement-bone interface shear strength between primary and revision arthroplasty. Clin Orthop Relat Res. 1988:214–220. [PubMed] [Google Scholar]
- 20.Funk MJ, Litsky AS. Effect of cement modulus on the shear properties of the bone-cement interface. Biomaterials. 1998;19:1561–1567. doi: 10.1016/s0142-9612(97)00116-6. [DOI] [PubMed] [Google Scholar]
- 21.Kim DG, Miller MA, Mann KA. Creep dominates tensile fatigue damage of the cement-bone interface. J Orthop Res. 2004;22:633–640. doi: 10.1016/j.orthres.2003.09.007. [DOI] [PubMed] [Google Scholar]
- 22.Krause WR, Krug W, Miller J. Strength of the cement-bone interface. Clin Orthop Relat Res. 1982:290–299. [PubMed] [Google Scholar]
- 23.Mann KA, Ayers DC, Werner FW, Nicoletta RJ, Fortino MD. Tensile strength of the cement-bone interface depends on the amount of bone interdigitated with PMMA cement. J Biomech. 1997;30:339–346. doi: 10.1016/s0021-9290(96)00164-9. [DOI] [PubMed] [Google Scholar]
- 24.Mann KA, Miller MA, Cleary RJ, Janssen D, Verdonschot N. Experimental micromechanics of the cement-bone interface. J Orthop Res. 2008;26:872–879. doi: 10.1002/jor.20575. [DOI] [PMC free article] [PubMed] [Google Scholar]
- 25.Lotz JC, Gerhart TN, Hayes WC. Mechanical properties of metaphyseal bone in the proximal femur. J Biomech. 1991;24:317–329. doi: 10.1016/0021-9290(91)90350-v. [DOI] [PubMed] [Google Scholar]
- 26.Carter DR, Hayes WC. Fatigue life of compact bone--I. Effects of stress amplitude, temperature and density. J Biomech. 1976;9:27–34. doi: 10.1016/0021-9290(76)90136-6. [DOI] [PubMed] [Google Scholar]
- 27.Janssen D, Mann KA, Verdonschot N. Micro-mechanical modeling of the cement-bone interface: The effect of friction, morphology and material properties on the micromechanical response. J Biomech. 2008;41:3158–3163. doi: 10.1016/j.jbiomech.2008.08.020. [DOI] [PMC free article] [PubMed] [Google Scholar]
- 28.Lucksanasombool P, Higgs WA, Ignat M, Higgs RJ, Swain MV. Comparison of failure characteristics of a range of cancellous bone-bone cement composites. J Biomed Mater Res A. 2003;64:93–104. doi: 10.1002/jbm.a.10361. [DOI] [PubMed] [Google Scholar]
- 29.Skripitz R, Aspenberg P. Attachment of PMMA cement to bone: force measurements in rats. Biomaterials. 1999;20:351–356. doi: 10.1016/s0142-9612(98)00175-6. [DOI] [PubMed] [Google Scholar]
- 30.Nagaraja S, Couse TL, Guldberg RE. Trabecular bone microdamage and microstructural stresses under uniaxial compression. J Biomech. 2005;38:707–716. doi: 10.1016/j.jbiomech.2004.05.013. [DOI] [PubMed] [Google Scholar]
- 31.Yeni YN, Zelman EA, Divine GW, Kim DG, Fyhrie DP. Trabecular shear stress amplification and variability in human vertebral cancellous bone: relationship with age, gender, spine level and trabecular architecture. Bone. 2008;42:591–596. doi: 10.1016/j.bone.2007.11.011. [DOI] [PMC free article] [PubMed] [Google Scholar]
- 32.Carter DR, Hayes WC. The compressive behavior of bone as a two-phase porous structure. J Bone Joint Surg Am. 1977;59:954–962. [PubMed] [Google Scholar]
- 33.Keller TS. Predicting the compressive mechanical behavior of bone. J Biomech. 1994;27:1159–1168. doi: 10.1016/0021-9290(94)90056-6. [DOI] [PubMed] [Google Scholar]
- 34.Wirtz DC, Schiffers N, Pandorf T, Radermacher K, Weichert D, Forst R. Critical evaluation of known bone material properties to realize anisotropic FE-simulation of the proximal femur. J Biomech. 2000;33:1325–1330. doi: 10.1016/s0021-9290(00)00069-5. [DOI] [PubMed] [Google Scholar]
- 35.Hou FJ, Lang SM, Hoshaw SJ, Reimann DA, Fyhrie DP. Human vertebral body apparent and hard tissue stiffness. J Biomech. 1998;31:1009–1015. doi: 10.1016/s0021-9290(98)00110-9. [DOI] [PubMed] [Google Scholar]
- 36.Van Rietbergen B, Weinans H, Huiskes R, Odgaard A. A new method to determine trabecular bone elastic properties and loading using micromechanical finite-element models. J Biomech. 1995;28:69–81. doi: 10.1016/0021-9290(95)80008-5. [DOI] [PubMed] [Google Scholar]
- 37.Pérez MA, Grasa J, García-Aznar JM, Bea JA, Doblaré M. Probabilistic analysis of the influence of the bonding degree of the stem-cement interface in the performance of cemented hip prostheses. J Biomech. 2006;39:1859–1872. doi: 10.1016/j.jbiomech.2005.05.025. [DOI] [PubMed] [Google Scholar]
- 38.Verdonschot N, Huiskes R. The effects of cement-stem debonding in THA on the long-term failure probability of cement. J Biomech. 1997;30:795–802. doi: 10.1016/s0021-9290(97)00038-9. [DOI] [PubMed] [Google Scholar]
- 39.Moreo P, Pérez MA, García-Aznar JM, Doblaré M. Modelling the mechanical behaviour of living bony interfaces. Comp Methods Appl Mech Engrg. 2007;196:3300–3314. [Google Scholar]
- 40.Rubin PJ, Rakotomanana RL, Leyvraz PF, Zysset PK, Curnier A, Heegaard JH. Frictional interface micromotions and anisotropic stress distribution in a femoral total hip component. J Biomech. 1993;26:725–739. doi: 10.1016/0021-9290(93)90035-d. [DOI] [PubMed] [Google Scholar]