

Abstract
Systemic lupus erythematosus (SLE) is a systemic autoimmune disease associated with aberrant activation of T and B lymphocytes for the production of inflammatory cytokines and autoreactive antibodies. Animal studies of SLE have indicated that Toll-like receptors (TLR) are important in the pathogenesis of murine lupus. In the present clinical study, differential protein expressions of TLR-1–9 of monocytes and different lymphocyte subsets from patients with SLE and normal control subjects were determined by flow cytometry. Results showed that the expression of intracellular TLRs (TLR-3, -8, -9) and extracellular TLRs (TLR-1, -2, -4, -5, -6) were elevated in monocytes, CD4+ T lymphocytes, CD8+ T lymphocytes and B lymphocytes of SLE patients compared to control subjects (all P < 0·001). Moreover, cell surface expression of TLR-4 on CD4+ T lymphocytes and CD8+ T lymphocytes, and TLR-6 on B lymphocytes, were correlated positively with SLE disease activity index (SLEDAI) (TLR-4 on CD4+ T lymphocytes and CD8+ T lymphocytes: r = 0·536, P = 0·04; r = 0·713, P = 0·003; TLR-6 in B lymphocytes: r = 0·572, P = 0·026). In concordance with the above results, there is an observable increased relative induction (%) of inflammatory cytokine interleukin (IL)-1β, IL-6, IL-10 and IL-12, chemokines CCL2, CXCL8, CCL5 and CXCL10 from peripheral blood mononuclear cells (PBMC) upon differential stimulation by PolyIC (TLR-3 ligand), lipopolysaccharide (TLR-4 ligand), peptidoglycan (TLR-2 ligand), flagellin (TLR-5 ligand), R837 (TLR-7 ligand) and CpG DNA (TLR-9 ligand) in SLE patients compared to controls. These results suggest that the innate immune response for extracellular pathogens and self-originated DNA plays immunopathological roles via TLR activation in SLE.
Keywords: cytokines, systematic lupus erythematosus, Toll-like receptors
Introduction
Toll-like receptors (TLRs) are pattern recognition receptors which play essential roles in innate immunity. TLRs recognize structurally conserved pathogen-associated molecular patterns (PAMPs) for triggering nuclear factor-κB, p38 mitogen-activated protein kinases, c-Jun N-terminal kinases and the interferon (IFN) pathway, which results in the translocation of transcription factors, cytokine modulation and IFN-stimulated gene regulation leading to inflammatory responses [1]. A number of adaptor molecules are involved in the TLR signalling pathway, including myeloid differentiation primary response gene 88 (MyD88), TIR domain-containing adaptor protein, TIR domain-containing adapter inducing IFN-β (TRIF) and TRIF-related adaptor molecule. Total 11 human TLRs have been found and the functions of human TLR-1–9 have been characterized [2,3]. Cell surface TLRs (TLR-1, -2, -4, -5 and -6) are designed for the engagement of extracellular pathogens, whereas the intracellular TLRs (TLR-3, -7, -8 and -9) are against intracellular pathogen-derived products [4]. In addition to their roles in innate immunity, TLRs also participate in the development of adaptive immune response. For example, TLR-9 is involved in class-switching to pathogenic autoantibody production in systemic lupus erythematosus (SLE) [5]. Moreover, TLRs can participate in B cell differentiation and immunoglobulin production in a T cell-independent manner [6,7]. TLR-4 and -9 have been suggested to instigate T helper type 1 (Th1) responses, while TLR-2 and -5 are related to Th2-related immunity [8–10].
The stimulation of TLR by PAMPs is an important prerequisite for the induction of various autoimmune diseases [2]. Using a murine model of lupus, both MyD88-dependent and -independent innate signals were found to play a crucial role in the development of autoimmune nephritis [11]. In addition, treatment of lupus-prone mice with a dual inhibitor of TLR-7 and TLR-9 leads to the reduction of autoantibody production and amelioration of disease symptoms [12]. These data suggest that aberrant activation of a number of TLR pathways may lead to the initiation and/or perpetuation of SLE. Christensen et al. has demonstrated opposite roles of TLR-7 and TLR-9 in SLE in a murine model [13]. Lupus-prone mice deficient in TLR-7 failed to generate antibodies against RNA-containing antigens such as Smith, which decreased lymphocyte activation and serum immunoglobulin (Ig)G [13]. Conversely, the absence of TLR-9 can exacerbate the disease activity by the activation of lymphocytes and plasmacytoid dendritic cells (pDCs), inducing the subsequent increase of serum IgG and interferon (IFN)-α[13]. In fact, patients with active SLE have increased expression of TLR-9 in peripheral blood memory and plasma B lymphocytes, suggesting that endogenous nucleic acids released during apoptosis may stimulate B lymphocytes via TLR-9 and contribute to SLE pathogenesis [14]. Up-regulated expression of TLR-7 and TLR-9 mRNA, together with IFN-α mRNA in peripheral blood mononuclear cells (PBMC), may also contribute to the pathogenesis of human lupus [15].
In order to study further the involvement of TLRs in SLE pathogenesis, we have investigated the differential expression profile of TLR-1 to TLR-9 of monocytes and various lymphocyte subsets such as CD4+ T lymphocytes, CD8+ T lymphocytes and CD19+ B lymphocytes. Furthermore, we have studied the correlation between TLR expression and SLE disease activity index (SLEDAI), and induction of cytokines and chemokines from PBMC upon activation by various TLR ligands. Investigation of the expression profiles of TLRs in SLE patients may provide a useful platform for evaluating the role of TLR in the manifestation of autoimmune disease, and also facilitate the development of therapeutic drug against SLE.
Materials and methods
SLE patients, control subjects and blood samples
Sixteen female Chinese SLE patients were recruited at the Rheumatology Out-Patient Clinic of the Prince of Wales Hospital, Hong Kong. Diagnosis of SLE was established according to the 1982 revised American Rheumatism Association criteria (ARA) [16], and disease activity was evaluated by the SLEDAI score [17]. Fourteen age-matched healthy female Chinese volunteers were recruited as controls (NC group). Twelve ml of ethylenediamine tetraacetic acid (EDTA) venous peripheral blood were collected from each patient and control subject. For those patients who took prednisolone, blood samples were taken more than 24 h after the last intake of steroids to eliminate the effect of prednisolone. The above protocol was approved by the Clinical Research Ethics Committee of The Chinese University of Hong Kong–New Territories East Cluster Hospitals, and informed consent was obtained from all participants according to the Declaration of Helsinki.
Protein expression of TLRs on CD4+ T, CD8+ T, CD19+ B lymphocytes and monocytes by flow cytometry
A previous method was adopted for the determination of protein expression of TLRs using flow cytometry [18]. PBMC from SLE patients and control subjects were purified by FicollPaque Plus gradient centrifugation (GE Healthcare Corp., Piscataway, NJ, USA). R-phycoerythrin (PE)-conjugated CD4, peridinin chlorophyll protein (PerCP)-conjugated CD8 and allophycocyanin (APC)-conjugated CD19 antibodies were purchased from Becton Dickinson (BD) (Pharmingen Corp., San Diego, CA, USA) for identification of the CD4+ T, CD8+ T and CD19+ B lymphocyte populations. The monocyte population was identified using the forward- and side-scatter plot. PBMC isolated from whole blood were incubated with anti-TLR antibodies as described below. Antibodies for flow analysis of human TLR 1–9 were purchased from Imgenex Corp. (San Diego, CA, USA). TLR-2, -3, -4, -5, -6, -8 and -9-specific monoclonal antibodies were fluorescein isothiocyanate (FITC)-conjugated while human TLR-1 and -7-specific antibodies were unconjugated. FITC-conjugated secondary antibodies purchased from Zymed Laboratories, Inc., San Francisco, CA, USA, was used for the detection of TLR-1 and -7. The corresponding isotypic controls of these antibodies, FITC-conjugated and purified IgG were purchased from BD Pharmingen.
For TLR-1, -2, -4, -5 and -6, the flow cytometric cell surface staining method was used. PBMC obtained were washed once with phosphate-buffered saline (PBS; Gibco Laboratories, NY, USA), stained with anti-CD marker antibody and the non-specific epitopes were blocked by 2% human serum. For TLR-3, -7, -8 and -9, the intracellular staining method was used. Briefly, PBMC were first stained with anti-CD marker antibody, fixed in 4% formaldehyde for 15 min and then permeabilized with 0·1% saponin for 30 min on ice. For both protocols, the cells were then incubated with corresponding TLR antibodies or corresponding isotypic control antibodies and, if necessary, secondary antibodies. The cells were finally washed with phosphate-buffered saline (PBS) and fixed with 1% paraformaldehyde.
A total of 5000 viable lymphocytes were collected and analysed by flow cytometry (FACSCalibur, BD Biosciences Corp, San Jose, CA, USA), with results expressed as the percentage difference compared with isotypic control (IC) using the formula [mean fluorescence intensity (MFI) of TLR – MFI of IC]/MFI of IC × 100%.
Ex vivo induction of cytokines by TLR ligands
PBMC obtained after centrifugation of blood using a density gradient were washed with PBS. Aliquots of 1 × 10⁵ cells resuspended in culture medium RPMI-1640 (Gibco Laboratories) were dispensed in each well of a 96-well plate (Nalge Nunc International, Naperville, IL, USA). The culture medium used was free of detectable endotoxin (< 0·1 EU/ml) and all other solutions were prepared using pyrogen-free water and sterile polypropylene plastic ware. The cells were then incubated with or without TLR ligand peptidoglycan (PGN, TLR-2 ligand; Fluka Chemie GmbH, Buchs, Switzerland), ultra-purified lipopolysaccharide (LPS, TLR-4 ligand; Invivogen Corp, San Diego, CA, USA), polyinosinic–polycytidylic acid (poly IC) (TLR-3 ligand; Sigma-Aldrich Co., St Louis, MO, USA), flagellin (TLR-5 ligand; Calbiochem Corp., San Diego, CA, USA), R837/Imiquimod (TLR-7 ligand) and cytosine–phosphate–guanine (CpG) DNA (TLR-9 ligand; Invivogen) at 1 µg/ml each and single-stranded RNA (ssRNA, TLR-8 ligand; Invivogen) at 0·5 µg/ml for 24 h at 37°C in a 5% CO2 atmosphere. TLR-1 and TLR-6, which form a heterodimer with TLR-2, also bind with PGN. The cell-free supernatant was harvested and stored at −70°C for subsequent assays of cytokines and chemokines.
Inflammatory cytokines including interleukin (IL)-1β, tumour necrosis factor (TNF)-α, IL-12p70, IL-6 and IL-10 and chemokines including CXCL8, CCL5, CCL2 and CXCL10 were measured simultaneously with the human inflammation cytometric bead array (CBA) kit and the human chemokine CBA kit I, respectively (BD Pharmingen) using flow cytometry (FACSCalibur, BD Biosciences). Supernatant samples were analysed on a multi-fluorescence BD FACSCalibur™ flow cytometer using BD CellQuest™ software and BD™ CBA software. The relative percentage induction of cytokines and chemokines compared with medium control was calculated based on the percentage difference of induction in medium and after TLR ligand stimulation. Relative induction of cytokines/chemokines (%) = (induction of cytokine/chemokine with TLR ligand activation – induction of cytokine of medium control)/induction of cytokine of medium control × 100%.
Statistical analysis
Numerical data were expressed as median (interquartile range, IQR) if not in Gaussian distribution. The expression of TLR-1 to TLR-9 and the induction of cytokines and chemokines upon TLR ligand activation among SLE patients and control subjects were compared with the Mann–Whitney rank sum test. Spearman's rank correlation test was used to assess the correlation between TLR expression and SLE disease activity. Statistical analysis was performed using SPSS statistical software for Windows, version 16·0 (SPSS Inc., Chicago, IL, USA). Probability values (P) < 0·05 were considered as significant.
Results
Characteristics of SLE patients and control subjects
Sixteen female Chinese SLE patients were recruited at the Rheumatology Out-Patient Clinic of the Prince of Wales Hospital, Hong Kong. Fourteen healthy female Chinese volunteers were recruited as controls. Twelve ml of EDTA venous peripheral blood were collected from each patient and control subject. The characteristics of SLE patients and control subjects were listed in Table 1.
Table 1.
Characteristics of systemic lupus erythematosus (SLE) patients and control subjects.
| SLE | Control | |
|---|---|---|
| Number | 16 | 14 |
| Sex (female/male) | 16/0 | 14/0 |
| Age, year, mean ± s.d. (range) | 37 ± 8 (21–51) | 46 ± 12 (23–58) |
| Duration of diagnosis, year, mean ± s.d. (range) | 10·9 ± 8·80 (1–30) | n.a. |
| SLEDAI score mean ± s.d. (range) | 3·13 ± 2·99 (0–9) | n.a. |
| Anti-dsDNA titre mean ± s.d. (range) | 373·5 ± 319·3 (50–956) | n.a. |
| Patients with nephritis (%) | 0 | n.a. |
| Treatment with prednisolone | ||
| Patients, no. (%) | 15 (93·8) | |
| Daily dose, mg | 44·1 ± 126 | |
| Mean ± s.d. (range) | (5–500) | n.a. |
| Treatment with hydroxychloroquine | ||
| Patients, no. (%) | 5 (31·3) | |
| Daily dose, mg | 200 ± 0 | |
| Mean ± s.d. (range) | (200–200) | n.a. |
| Treatment with azathioprine | ||
| Patients, no. (%) | 5 (31·3) | |
| Daily dose, mg | 60·0 ± 37·9 | |
| Mean ± s.d. (range) | (25–100) | n.a. |
Values are in mean ± standard deviation (s.d.) (range); n.a., not applicable.
Expression of TLR-1 to TLR-9 in PBMC
The representative histograms in Fig. 1 show that the expressions of TLR-1, -2, -3, -4, -5, -6, -8 and -9 of CD4+ T lymphocytes are higher in SLE patients than in control subjects. As shown in Fig. 2, the expression of TLR-2, -3, -4, -5, -6, -8 and -9 was significantly higher in monocytes, CD4+ T lymphocytes, CD8+ T lymphocytes and CD19+ B lymphocytes of SLE patients than in control subjects (all P < 0·05). TLR-1 was found to be significantly higher on CD4+ and CD8+ T cells in SLE patients (both P < 0·001). TLR-7 expressions in different immune cell subsets were not significantly different between SLE patients and control subjects (all P > 0·05). The percentages of cells expressing these TLRs have the same differences with MFI between patients and healthy controls.
Fig. 1.
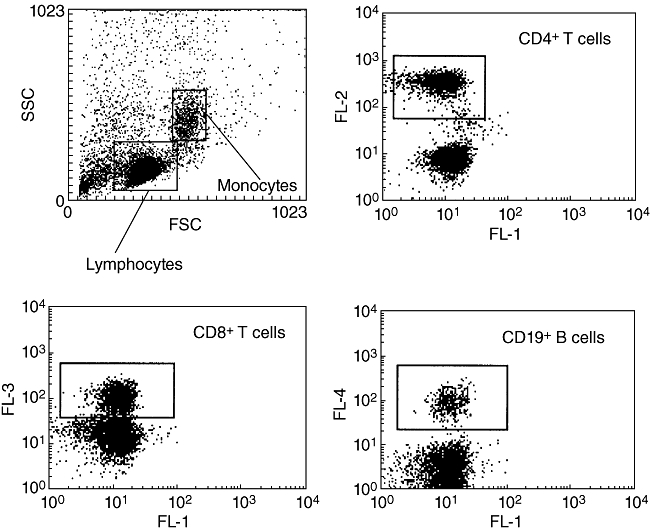
Representative do plot analysis of flow cytometry showing the respective gating for monocytes and lymphocytes, CD4+ T lymphocytes [FL2: phycoerythin (PE)-CD4], CD8+ T lymphocytes [FL3: peridinin chlorophyll protein (PerCp)-CD8] and CD19+ B lymphocytes (FL4: allophycocyanin (APC)-CD19].
Fig. 2.

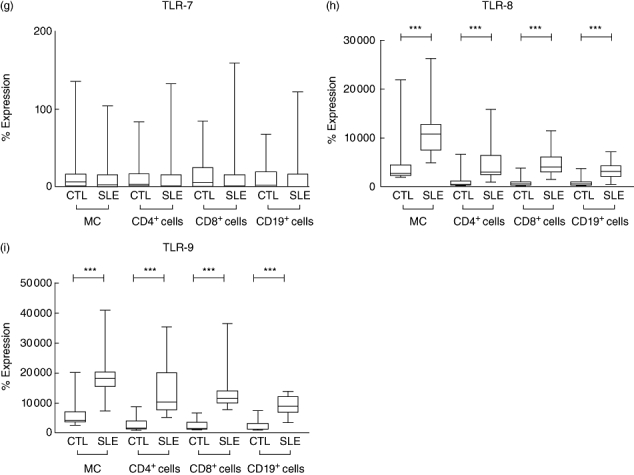
The differential expression of Toll-like receptor (TLR)-1 to TLR-9 in monocytes (MC), CD4+ T lymphocytes, CD8+ T lymphocytes and CD19+ B lymphocytes were analysed by flow cytometry. Results expressed as the percentage difference comparing with isotypic control (IC) as described in Materials and methods. Results are presented with box-and-whisker plots. Mann–Whitney rank sum test was used to assess the differences of expression among systemic lupus erythematosus patients and control subjects (CTL). *P < 0·05, **P < 0·01 and ***P < 0·001.
Spearman's rank correlation test was performed to calculate the correlation between TLR expressions with disease activity. As shown in Table 2, TLR-4 expression was correlated significantly with SLEDAI score in CD4+ T lymphocytes and CD8+ T lymphocytes (both P < 0·05). The TLR-6 expression in CD19+ B lymphocytes was also correlated significantly with disease activity (P < 0·05, Table 2). However, there was no significant correlation between all TLR expression with the serum anti-dsDNA titre in SLE patients (all P > 0·05). This might be due to the relatively inactive disease activity [SLEDAI mean ± standard deviation (s.d.): 3·13 ± 2·99] of the SLE patient cohort.
Table 2.
Correlation between Toll-like receptor (TLR) expression and SLE disease activity index (SLEDAI) score.
| TLR-1 | TLR-2 | TLR-3 | |
|---|---|---|---|
| Monocytes | r = 0·321, P = 0·244 | r = 0·266, P = 0·338 | r = 0·063, P = 0·823 |
| CD4+ T cells | r = 0·139, P = 0·620 | r = 0·472, P = 0·075 | r = −0·226, P = 0·417 |
| CD8+ T cells | r = 0·056, P = 0·843 | r = 0·076, P = 0·788 | r = −0·136, P = 0·63 |
| CD19+ B cells | r = 0·139, P = 0·621 | r = 0·205, P = 0·465 | r = −0·25, P = 0·388 |
| TLR-4 | TLR-5 | TLR-6 | |
| Monocytes | r = 0·375, P = 0·169 | r = 0·091, P = 0·748 | r = 0·469, P = 0·078 |
| CD4+ T cells | r = 0·536, P = 0·04* | r = 0·311, P = 0·259 | r = 0·375, P = 0·169 |
| CD8+ T cells | r = 0·713, P = 0·003** | r = 0·022, P = 0·939 | r = 0·436, P = 0·104 |
| CD19+ B cells | r = 0·478, P = 0·072 | r = 0·201, P = 0·473 | r = 0·572, P = 0·026* |
| TLR-7 | TLR-8 | TLR-9 | |
| Monocytes | r = −0·368, P = 0·177 | r = 0·404, P = 0·136 | r = 0·163, P = 0·562 |
| CD4+ T cells | r = −0·437, P = 0·103 | r = −0·337, P = 0·22 | r = 0·058, P = 0·838 |
| CD8+ T cells | r = −0·394, P = 0·147 | r = −0·205, P = 0·465 | r = −0·06, P = 0·833 |
| CD19+ B cells | r = −0·501, P = 0·057 | r = −0·42, P = 0·119 | r = −0·089, P = 0·753 |
Spearman's rank correlation test was used to assess the correlation between TLR expression and SLEDAI score. r = Spearman's correlation coefficient;
P < 0·05;
P < 0·01.
Cytokine and chemokine induction upon TLR ligand activation
The induction (pg/ml) and relative induction (%) compared with medium control of cytokines and chemokines, including IL-12, TNF-α, IL-10, IL-1β, IL-6, CCL2, CCL5, CXCL8 and CXCL10, are presented in Tables 3–6 and Fig. 3. TLR ligand PGN, LPS, flagellin, R837 and CpG DNA could induce the production of TNF-α, IL-10, IL-1β and IL-6 from PBMC of both SLE patients and control subjects (Tables 3 and 4). In Tables 5 and 6, PGN, LPS, poly IC, ssRNA, flagellin, R837 and CpG DNA could induce the production of CCL2, CXCL8 and CXCL10, while only PGN, LPS, flagellin and R837 could induce the production of CCL5 from PBMC (Table 5). However, there was no significant difference for the induction (pg/ml) and relative induction (%) of all measured cytokines and chemokines between SLE patients and control subjects (all P > 0·05, Tables 3–6). There is an observable enhanced relative induction (%) of inflammatory cytokine IL-1β and IL-6 upon LPS (TLR-4 ligand) stimulation and chemokine CCL2 and CCL5 upon PGN (TLR-2 ligand) stimulation from peripheral blood mononuclear cells in SLE patients compared with controls (Tables 4 and 5, Fig. 3). Moreover, CCL2 in response to TLR-5 and TLR-7 ligands, CXCL10 in response to TLR-7 ligand, CXCL8 in response to TLR-5 ligand, CCL5 in response to TLR-7 and TLR-9 ligands and IL-12, IL-10, IL-1β and IL-6 in response to TLR-3 ligand also showed elevated relative induction (%) in SLE patients compared to that of controls (Tables 3–6, Fig. 3).
Table 3.
Induction of interleukin (IL)-12, tumour necrosis factor (TNF)-α and IL-10 upon Toll-like receptor (TLR) ligand activation.
| CTL | SLE | CTL | SLE | |
|---|---|---|---|---|
| Induction of IL-12 (pg/ml) | Relative induction of IL-12 (%) | |||
| Medium | 1·00 (0·95–1·25) | 1·20 (0·95–1·60) | 0 | 0 |
| PGN | 1·00 (0·85–1·20) | 1·15 (0·90–1·45) | 18·1 (−20·6 to 60·0) | 16·7 (−22·2 to 35·5) |
| LPS | 1·45 (1·35–1·55) | 1·20 (0·90–1·65) | −9·50 (−36·3 to 28·0) | 40·2 (−0·350 to 88·9) |
| Poly IC | 1·10 (0·85–1·40) | 1·25 (0·90–1·50) | 2·40 (−6·10 to 55·2) | 17·6 (−10·0 to 60·6) |
| ssRNA | 1·25 (0·95–1·80) | 1·35 (1·05–1·55) | 36·3 (7·35 to 66·2) | 7·10 (−11·2 to 52·2) |
| Flagellin | 1·55 (1·05–1·80) | 1·10 (0·95–1·30) | −0·450 (−7·35 to 48·2) | 4·15 (−21·9 to 36·4) |
| R837 | 1·15 (0·90–1·45) | 1·20 (0·90–1·75) | −5·40 (−28·7 to 11·7) | 57·2 (−0·250 to 82·3) |
| CpG | 0·95 (0·90–1·30) | 0·90 (0·90–1·20) | −13·4 (−29·9 to 13·8) | −9·25 (−29·5 to 78·5) |
| Induction of TNF-α (pg/ml) | Relative induction of TNF-α (%) | |||
| Medium | 15·7 (2·70–32·7) | 11·4 (2·40–21·0) | 0 | 0 |
| PGN | 89·6 (55·7–162) | 43·3 (29·4–126) | 1020 (169 to 3260) | 836 (188 to 2220) |
| LPS | 232 (178–290) | 276 (161–360) | 1080 (762 to 10 000) | 314 (1240 to 10 100) |
| Poly IC | 7·05 (1·95–28·7) | 6·55 (2·00–24·2) | −9·95 (−63·9 to 52·6) | −15·7 (−44·1 to 62·3) |
| ssRNA | 11·4 (2·70–22·4) | 6·25 (2·85–25·9) | 6·40 (−54·3 to 76·5) | 5·05 (−68·2 to 76·0) |
| Flagellin | 160 (72·3–196) | 84·5 (60·5–137) | 838 (300 to 3760) | 886 (333 to 3540) |
| R837 | 26·4 (5·75–57·9) | 14·5 (3·75–39·2) | 66·8 (−22·4 to 421) | 86·1 (−25·1 to 175) |
| CpG | 41·9 (3·20–80·5) | 15·2 (2·95–24·1) | 38·0 (−30·0 to 728) | 22·6 (−40·8 to 216) |
| Induction of IL-10 (pg/ml) | Relative induction of IL-10 (%) | |||
| Medium | 5·25 (3·20–64·8) | 5·8 (2·85–133) | 0 | 0 |
| PGN | 64·6 (42·5–108) | 79·7 (43·2–133) | 2060 (470 to 3620) | 1220 (455 to 4840) |
| LPS | 188 (108–292) | 251 (194–617) | 3590 (1860 to 5750) | 5430 (3200 to 9490) |
| Poly IC | 6·00 (1·60–20·4) | 6·20 (3·30–20·5) | −3·70 (−11·2 to 62·3) | 43·9 (−5·40 to 73·5) |
| ssRNA | 5·85 (3·65–20·7) | 5·30 (2·80–21·6) | −9·30 (−22·6 to 160) | 10·9 (−6·00 to 137) |
| Flagellin | 77·2 (52·3–216) | 129 (102–195) | 1110 (893 to 3 260) | 2690 (1620 to 3960) |
| R837 | 19·5 (4·40–98·5) | 8·35 (4·40–73·0) | 254 (64·6 to 1 930) | 174 (42·1 to 657) |
| CpG | 22·6 (4·25–55·3) | 5·75 (2·75–38·6) | 47·8 (−6·25 to 1 190) | 28·5 (13·7 to 97·2) |
Culture supernatant was obtained from peripheral blood mononuclear cells (PBMC) cultured with medium or TLR ligands for 24 h. The induction (pg/ml) and relative induction (%) of IL-12, TNF-α and IL-10 by PBMC was analysed by flow cytometry. Numerical data are expressed as median (IQR). Mann–Whitney rank sum test was used to assess the differences of induction of cytokines between systemic lupus erythematosus (SLE) patients (n = 7) and control subjects (CTL, n = 8). All P > 0·05 comparing between controls and SLE patients. CpG, cytosine–phosphate–guanine; LPS, lipopolysaccharide; PGN, peptidoglycan; poly IC, polyinosinic–polycytidylic acid.
Table 6.
Induction of CXCL8 and CXCL10 upon Toll-like receptor (TLR) ligand activation.
| CTL | SLE | CTL | SLE | |
|---|---|---|---|---|
| Induction of CXCL8 (pg/ml) | Relative induction of CXCL8 (%) | |||
| Medium | 9 760 (1500–18 900) | 7 175 (999–20 500) | 0 | 0 |
| PGN | 19 700 (18 800–23 400) | 20 170 (18 900–22 300) | 543 (51·6 to 1670) | 627 (57·3 to 2250) |
| LPS | 19 600 (19 200–23 200) | 20 540 (19 100–22 700) | 426 (51·3 to 1690) | 633 (59·7 to 2310) |
| Poly IC | 6 480 (959–15 400) | 6 606 (1110–16 400) | 19·1 (−0·550 to 116) | 20·2 (−10·5 to 86·3) |
| ssRNA | 9 520 (2360–16 000) | 6 347 (1210–17 300) | 29·8 (2·45 to 396) | 32·7 (−23·4 to 175) |
| Flagellin | 1 990 (19 300–22 900) | 20 170 (19 300–23 000) | 535 (46·0 to 1650) | 653 (55·8 to 2360) |
| R837 | 699 (2810–1770) | 8 386 (2680–17 900) | 49·9 (−15·8 to 457) | 69·4 (16·2 to 736) |
| CpG | 13 700 (3610–18 700) | 7 721 (2380–17 900) | 33·2 (9·30 to 477) | 53·2 (4·80 to 668) |
| Induction of CXCL10 (pg/ml) | Relative induction of CXCL10 (%) | |||
| Medium | 10·9 (9·72–48·8) | 11·7 (10·6–28·8) | 0 | 0 |
| PGN | 10·7 (10·4–39·3) | 11·4 (10·7–798) | 6·00 (−3·20 to 13·0) | 6·30 (3·45 to 1010) |
| LPS | 12·3 (10·9–58·1) | 11·7 (11·1–129) | 17·5 (3·65 to 28·6) | 6·50 (0·900 to 129) |
| Poly IC | 11·7 (10·2–43·2) | 12·6 (11·6–50·5) | 4·60 (−0·20 to 8·70) | 6·60 (−4·25 to 28·0) |
| ssRNA | 11·3 (10·4–37·2) | 12·3 (11·3–28·1) | 2·30 (−7·10 to 9·15) | 6·05 (−21·6 to 14·2) |
| Flagellin | 12·0 (11·0–44·7) | 12·3 (11·1–529) | 7·00 (3·90 to 19·2) | 10·8 (4·60 to 851) |
| R837 | 35·1 (11·6–109) | 75·5 (12·5–294) | 41·1 (16·7 to 638) | 562 (219 to 974) |
| CpG | 11·7 (10·8–51·8) | 11·7 (11·1–39·7) | 7·50 (−0·400 to 17·6) | 7·00 (−4·80 to 14·5) |
Culture supernatant was obtained from peripheral blood mononuclear cells (PBMC) cultured with medium or TLR ligands for 24 h. The induction (pg/ml) and relative induction (%) of CXCL8 and CXCL10 by PBMC was analysed by flow cytometry. Numerical data are expressed as median (IQR). Mann–Whitney rank sum test was used to assess the differences of induction of chemokines between systemic lupus erythematosus (SLE) patients (n = 7) and control subjects (CTL, n = 8). All P > 0·05 comparing between controls and SLE patients. CpG, cytosine–phosphate–guanine; LPS, lipopolysaccharide; PGN, peptidoglycan; poly IC, polyinosinic–polycytidylic acid.
Fig. 3.
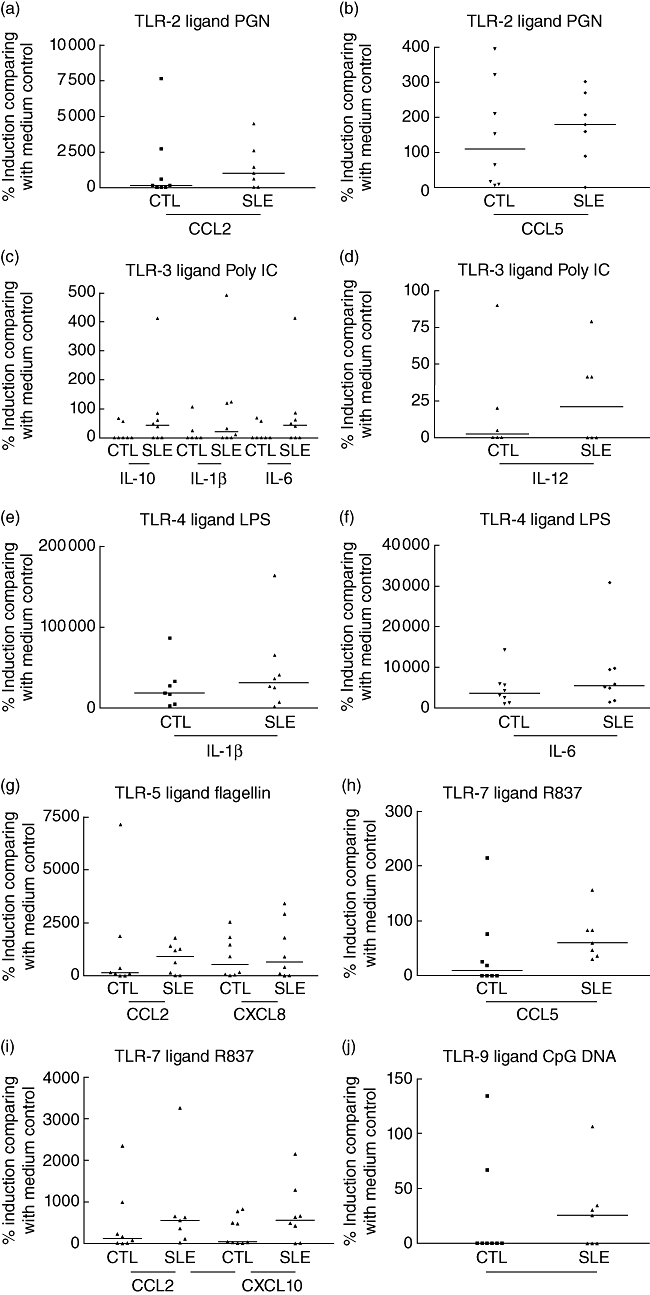
Relative induction (%) of interleukin (IL)-1β, IL-6, IL-10, IL-12, CCL2, CCL5, CXCL8 and CXCL10 from peripheral blood mononuclear cells (PBMC) upon differential stimulation by (a, b) peptidoglycan (PGN) [Toll-like receptor (TLR)-2 ligand], (c, d) polyinosinic–polycytidylic acid (poly IC) (TLR-3 ligand), (e, f) lipopolysaccharide (LPS) (TLR-4 ligand), (g) flagellin (TLR-5 ligand), (h, i) R837 (TLR-7 ligand) and (j) cytosine–phosphate–guanine (CpG) DNA (TLR-9 ligand) in systemic lupus erythematosus patients (n = 8) compared to controls (n = 7). Culture supernatant was obtained from PBMC cultured with medium or TLR ligands for 24 h. The relative induction (%) of cytokines and chemokines by PBMC was analysed by flow cytometry. Results are expressed with scatter plots with horizontal line denoting median.
Table 4.
Induction of interleukin (IL)-1β and IL-6 upon Toll-like receptor (TLR) ligand activation.
| CTL | SLE | CTL | SLE | |
|---|---|---|---|---|
| Induction of IL-1β (pg/ml) | Relative induction of IL-1β (%) | |||
| Medium | 15·0 (5·95–313) | 8·65 (3·45–341) | 0 | 0 |
| PGN | 91·9 (64·0–387) | 84·8 (39·2–248) | 2540 (847 to 4790) | 1160 (560 to 3110) |
| LPS | 1500 (1270–2960) | 1870 (1170–2450) | 18 200 (10 600 to 59 400) | 30 600 (15 500 to 52 200) |
| Poly IC | 11·4 (1·60–36·6) | 8·55 (3·55–14·9) | 0·50 (−28·1 to 1430) | 20·8 (−27·1 to 121) |
| ssRNA | 22·8 (8·15–38·8) | 8·20 (2·30–44·3) | −12·6 (−21·1 to 1510) | 39·0 (−11·4 to 432) |
| Flagellin | 687 (449–1140) | 305 (198–573) | 3850 (2630 to 43 800) | 7910 (2380 to 10 720) |
| R837 | 30·5 (17·1–199) | 24·8 (10·3–64·0) | 73·1 (60·8 to 8 260) | 302 (185 to 629) |
| CpG | 81·5 (10·1–209) | 10·3 (4·95–32·4) | 27·3 (4·85 to 10 500) | 59·4 (29·1 to 334) |
| Induction of IL-6 (pg/ml) | Relative induction of IL-6 (%) | |||
| Medium | 106 (10·9–1054) | 34·9 (9·30–986) | 0 | 0 |
| PGN | 3780 (2300–631) | 3660 (2828–5367) | 2060 (470 to 3620) | 1220 (455 to 4840) |
| LPS | 6700 (5517–9590) | 8010 (6924–9523) | 3590 (1860 to 5750) | 5430 (3200 to 9490) |
| Poly IC | 266 (7·85–1186) | 180 (11·0–1329) | −3·70 (−11·2 to 62·3) | 43·9 (−5·40 to 73·5) |
| ssRNA | 370 (35·6–1468) | 132 (9·10–1469) | −9·30 (−22·6 to 160) | 10·9 (−6·00 to 137) |
| Flagellin | 6200 (4998–8217) | 6340 (5719–7759) | 1110 (893 to 3260) | 2690 (1620 to 3960) |
| R837 | 672 (169–3719) | 328 (121–2887) | 254 (64·6 to 1930) | 174 (42·1 to 657) |
| CpG | 1410 (37·7–4046) | 124 (22·6–3057) | 47·8 (−6·25 to 1190) | 28·5 (13·7 to 97·2) |
Culture supernatant was obtained from peripheral blood mononuclear cells (PBMC) cultured with medium or TLR ligands for 24 h. The induction (pg/ml) and relative induction (%) of IL-1β and IL-6 by PBMC was analyzed by flow cytometry. Numerical data are expressed as median (IQR). Mann–Whitney rank sum test was used to assess the differences of induction of cytokines between systemic lupus erythematosus (SLE) patients (n = 7) and control subjects (CTL, n = 8). All P > 0·05 comparing between controls and SLE patients. CpG, cytosine–phosphate–guanine; LPS, lipopolysaccharide; PGN, peptidoglycan; poly IC, polyinosinic–polycytidylic acid.
Table 5.
Induction of CCL2 and CCL5 upon Toll-like receptor (TLR) ligand activation.
| CTL | SLE | CTL | SLE | |
|---|---|---|---|---|
| Induction of CCL2 (pg/ml) | Relative induction of CCL2 (%) | |||
| Medium | 1481 (666–4250) | 939 (364–4960) | 0 | 0 |
| PGN | 3609 (2530–11 900) | 8812 (3830–11 600) | 132 (−4·05 to 1670) | 1010 (318 to 3550) |
| LPS | 1519 (490–4060) | 2320 (962–3170) | −51·1 (−66·1 to 301) | 90·5 (−15·1 to 285) |
| Poly IC | 2716 (809–3810) | 1859 (1140–9280) | 50·6 (−4·05 to 172) | 43·9 (−5·15 to 306) |
| ssRNA | 1979 (1320–4120) | 3310 (357–7880) | 52·7 (−0·850 to 187) | 43·0 (−31·8 to 573) |
| Flagellin | 3665 (2550–11 200) | 6074 (910–8470) | 133 (42·6 to 1110) | 912 (68·0 to 1340) |
| R837 | 3863 (2870–4990) | 4330 (2 270–7410) | 120 (12·2 to 610) | 557 (235 to 1960) |
| CpG | 2588 (1990–3220) | 3290 (864–8750) | 47·5 (7·25 to 127) | 41·6 (9·10 to 392) |
| Induction of CCL5 (pg/ml) | Relative induction of CCL5 (%) | |||
| Medium | 455 (85·5–1430) | 379 (44·1–506) | 0 | 0 |
| PGN | 867 (160–2120) | 916 (99·5–1 200) | 109 (12·5 to 267) | 180 (125 to 287) |
| LPS | 1030 (213–2890) | 810 (167–1 890) | 145 (57·3 to 495) | 145 (125 to 391) |
| Poly IC | 775 (71·3–1160) | 390 (38·1–1 340) | −0·90 (−22·3 to 85·9) | −6·10 (−12·9 to 89·5) |
| ssRNA | 439 (72·2–2320) | 597 (33·6–2 340) | 20·9 (−12·9 to 78·5) | 25·3 (6·30 to 366) |
| Flagellin | 862 (318–2280) | 685 (124–1 500) | 135 (20·0 to 311) | 176 (48·5 to 266) |
| R837 | 446 (111–2260) | 558 (51·2–881) | 7·45 (−10·3 to 51·1) | 60·4 (42·4 to 120) |
| CpG | 333 (70·7–1 560) | 470 (33·9–1 110) | −20·8 (−36·0 to 29·8) | 25·6 (−10·2 to 70·9) |
Culture supernatant was obtained from peripheral blood mononuclear cells (PBMC) cultured with medium or TLR ligands for 24 h. The induction (pg/ml) and relative induction (%) of CCL2 and CCL5 by PBMC was analysed by flow cytometry. Numerical data were expressed as median (interquartile range). Mann–Whitney rank sum test was used to assess the differences of induction of chemokines between systemic lupus erythematosus (SLE) patients (n = 7) and control subjects (CTL, n = 8). All P > 0·05 comparing between controls and SLE patients. CpG, cytosine–phosphate–guanine; LPS, lipopolysaccharide; PGN, peptidoglycan; poly IC, polyinosinic–polycytidylic acid.
Discussion
Hyperactivity in monocytes, B and T lymphocytes can enhance antigen presentation, production of autoantibodies and inflammatory cytokines and chemokines, resulting in amplification of the autoimmune response and exacerbation of SLE [19,20]. Emerging evidence has reported that TLRs, which have been recognized as essential components in innate immunity, also participate in autoimmune responses [2]. Our findings revealed that cell surface TLRs (TLR-2, -3, -4 and -5) were increased significantly in monocytes, CD4+ T lymphocytes, CD8+ T lymphocytes and CD19+ B lymphocytes in SLE patients (Fig. 2). TLR-1 and -6, which form a heterodimer with TLR-2, also increased significantly in T cells in SLE patients (Fig. 2), and the expression was correlated significantly with TLR-2 (data not shown). Previous study has also indicated the elevated mRNA expression of TLR-2 and TLR-9 in PBMC in SLE patients [15]. The expression of different measured TLRs in SLE patients did not show any correlation with the dosages of prednisolone, hydroxychloroquine and azathioprine (all P > 0·05, data not shown). Our results, showing no significant difference of intracellular TLR-7 protein expression between controls and SLE patients in various immune cells that are different from the result of TLR-7 mRNA expression in a previous study [15], might be due to the different methods of analysis of TLRs, or relatively inactive disease activity of our SLE patient cohort (SLEDAI mean ± s.d.: 3·13 ± 2·99).
Among the TLR being investigated, TLR-4 expression was related positively with SLEDAI score in CD4+ T lymphocytes and CD8+ T lymphocytes, and TLR-6 expression in CD19+ B lymphocytes was also correlated with SLEDAI (Table 2). Aberrant TLR-4 expression has been reported to affect the balance of Th1 and Th2 lymphocytes in a mouse model of arthritis [21]. This previous study confirmed that TLR-4-deficient mice had markedly reduced numbers of Th17 lymphocytes and lowered capacity to produce IL-17, which can subsequently protect against the inflammatory process of rheumatoid arthritis (RA) [21]. In fact, inhibition of TLR-4 can suppress the severity of experimental arthritis and reduce IL-1β expression in arthritic joints [22]. To confirm further the induced TLR protein expression profile observed in our results, we have also investigated the cytokine induction profile of PBMC upon stimulation by different TLR ligands. There is an observable increase in the relative induction (%) of IL-1β and IL-6, and CCL2 and CCL5 from PBMC upon TLR-4 ligand LPS and TLR-2 ligand PGN stimulation, respectively, in SLE patients compared with control subjects (Tables 4 and 5). However, the change was not statistically significant (P > 0·05). This might be due to the relatively inactive disease activity of the SLE patients. Because LPS-induced IL-1β and IL-6 are crucial for the differentiation of human Th17 lymphocytes, whether the enhanced TLR-4 relate to the increased Th17 lymphocytes and exacerbation of the inflammatory process in SLE required further investigation [23,24]. TLR-2 ligand PGN-induced CCL2 and CCL5, chemokines for the chemoattraction of monocytes and lymphocytes into inflammatory sites, have also been shown to mediate the activation and recruitment of monocytes and Th2 lymphocytes in SLE [19]. Inflammatory chemokines, especially CCL2 and CCL5, are detectable in kidney tissues before other signs of inflammation [25–28]. The present result is in accord with our previous findings that plasma CCL2 and CCL5 concentrations in SLE patients were significantly higher than in normal controls, and correlated significantly with SLEDAI score [29]. As TLR-6 usually forms a complex with TLR-2, it is reasonable that both TLR-2 and TLR-6 expressions were both elevated in SLE patients (Fig. 2). However, the mechanisms and clinical significances for the correlation of TLR-6 expression on B cells with SLEDAI needs further investigation.
Association of TLR-5 and TLR-9 single nucleotide polymorphisms has been indicated in Caucasian American SLE subjects [30]. TLR-5 ligand flagellin has been shown to drive the MyD88-dependent Th2-type immunity in the mouse model, as exemplified by the elevated secretion of Th2 cytokine IL-4 and IL-13, as well as IgG1 responses, but not Th1 cytokine IL-12p70 [10]. We also found elevated induction of inflammatory chemokines CCL2 and CXCL8 for the chemoattraction of monocytes and neutrophils in response to the TLR-5 ligand flagellin (Tables 5 and 6).
The generation of anti-DNA autoantibodies is the major characteristic for human SLE and animal models of lupus, and intracellular TLRs (TLR-3, -7, -8 and -9) are responsible for recognizing dsRNA, ssRNA and unmethylated CpG DNA [2]. TLR-9, the receptor for ummethylated CpG DNA, is required for the spontaneous generation of autoantibodies in the murine model of lupus [13]. Using an animal model, the role of TLR-9 has been indicated in autoimmunity in the chronic graft-versus-host model of SLE and the onset of lupus nephritis [31,32]. TLR-9 is overexpressed in peripheral blood B lymphocytes from patients with active SLE [33,34]. In addition, the production of anti-dsDNA antibody and IL-10 was up-regulated upon stimulation with TLR-9 ligand CpG-DNA [34]. Other studies also revealed that TLR-9 expression in memory B lymphocytes and antigen-presenting cells were increased in patients with active SLE, and the increased percentages of TLR-9 expressing B lymphocytes were correlated with the concentration of anti-dsDNA antibodies [14,35]. Our present results indicated that TLR-9 expression was elevated significantly in monocytes, CD4+ T lymphocytes, CD8+ T lymphocytes and CD19+ B lymphocytes of SLE patients, which was therefore concurrent with the previous results [14,34].
In the present study, TLR-8, the receptor for ssRNA in human, was elevated significantly in SLE patients in comparison to control subjects. TLR-8 can mediate the reversal of the suppressive function of regulatory T lymphocytes (Treg) and the depletion of natural Treg cell subpopulations during the exacerbation of SLE [36,37]. Nevertheless, whether overexpression of TLR-8 on T cells can suppress the function of Treg lymphocytes, leading to the exacerbation of SLE pathogenesis, requires further investigation. Another study has demonstrated that a prototype autoantigen, the small nuclear ribonucleoprotein particles, can directly stimulate innate immunity mediated by TLR-7, -8 activation [38]. Therefore, the increase of TLR-8 may play role of the autoimmunity in SLE pathogenesis.
Apart from TLR-8 and -9, the expression of TLR-3 was also elevated in different lymphocyte subsets of SLE patients. Viral dsRNA could stimulate TLR-3 on glomerular mesangial cells and antigen-presenting cells to release IL-6, IL-12 and IFN-α, which aggravated autoimmune tissue injury [39]. Viral dsRNA-mediated TLR-3 activation can trigger disease activity of lupus nephritis by mechanisms that are different from those of bacterial DNA by activating intrinsic renal cells, but not B cells [39]. Therefore, we suggest that the elevated TLR-3 in our present study may play a role in SLE pathogenesis by aggravating both antigen-presenting cells.
Regarding the TLR-mediated release of cytokines and chemokines, CCL2 in response to TLR-5 and TLR-7 ligands, CXCL10 in response to TLR-7 ligand, CXCL8 in response to TLR-5 ligand, CCL5 in response to TLR-7 and TLR-9 ligands and IL-12, IL-10, IL-1β and IL-6 in response to TLR-3 ligand have shown elevated relative induction (%) in SLE patients compared to that of controls (Tables 3–6, Fig. 3). The above inflammatory chemokines and cytokines are related to the chemoattraction of activated Th1 cells (CXCL10), neutrophils (CXCL8), monocytes (CCL2 and CCL5) and activation of Th1 cells (IL-12) in the autoinflammatory processes of SLE, as exemplified by their positive correlation with disease activity [29]. These results therefore provide further evidence that aberrant activation and expression of different TLRs play crucial pathological roles in SLE pathogenesis. Although there was no difference in TLR-7 expression, the enhanced production of chemokines CCL2, CCL5 and CXCL10 in PBMCs from SLE patients treated with TLR-7 ligand R837 than control subjects might be due to the different TLR-7-mediated intracellular signalling mechanisms between SLE and controls that requires further investigation. TLR expression and functions are affected by cytokines such as IFN-α and TNF-α[2,4]; however, we found that there was no significant difference in plasma concentrations of IFN-α and TNF-α between SLE patients and controls (all P > 0·05). Nevertheless, 12·5% and 6·25% of SLE patients exhibited higher plasma concentrations of IFN-α and TNF-α, respectively, than the highest concentration of corresponding IFN-α and TNF-α of controls. The non-significant differences of IFN-α and TNF-α might due to the relatively inactive disease activity of recruited SLE patients in this study cohort.
In conclusion, our findings revealed that cell surface TLRs (TLR-1, -2, -4, -5 and -6), as well as intracellular TLRs (TLR-3, -8 and -9), were increased significantly in the monocytes, CD4+ T lymphocytes, CD8+ T lymphocytes and CD19+ B lymphocytes in SLE patients compared to control subjects. Overexpression of TLRs may therefore result in aberrant activation of monocytes, T and B lymphocytes for the production of cytokines and chemokines, implicating the innate immune response for extracellular pathogens and self-originated DNA in immunopathological mechanisms in SLE. The results may also provide a biochemical basis for the development of TLR targeting therapy in autoimmune disorders [40,41].
Acknowledgments
This study is supported by research grant from The Chinese University of Hong Kong.
Disclosure
No conflict of interest has been declared by the authors.
References
- 1.Yamamoto M, Sato S, Hemmi H, et al. Role of adapter TRIF in the myd88-independent Toll-like receptor signaling pathway. Science. 2003;301:640–3. doi: 10.1126/science.1087262. [DOI] [PubMed] [Google Scholar]
- 2.Fischer M, Ehlers M. Toll-like receptors in autoimmunity. Ann NY Acad Sci. 2008;1143:21–34. doi: 10.1196/annals.1443.012. [DOI] [PubMed] [Google Scholar]
- 3.O'Neill LA. The interleukin-1 receptor/Toll-like receptor superfamily: 10 years of progress. Immunol Rev. 2008;226:10–18. doi: 10.1111/j.1600-065X.2008.00701.x. [DOI] [PubMed] [Google Scholar]
- 4.Takeda K, Kaisho T, Akira S. Toll-like receptors. Annu Rev Immunol. 2003;21:335–76. doi: 10.1146/annurev.immunol.21.120601.141126. [DOI] [PubMed] [Google Scholar]
- 5.Ehlers M, Fukuyama H, McGaha TL, Aderem A, Ravetch JV. TLR9/MyD88 signaling is required for class switching to pathogenic IgG2a and 2b autoantibodies in SLE. J Exp Med. 2006;203:553–61. doi: 10.1084/jem.20052438. [DOI] [PMC free article] [PubMed] [Google Scholar]
- 6.Poeck H, Wagner M, Battiany J, et al. Plasmacytoid dendritic cells, antigen, and CpG-C license human B cells for plasma cell differentiation and immunoglobulin production in the absence of T-cell help. Blood. 2004;103:3058–64. doi: 10.1182/blood-2003-08-2972. [DOI] [PubMed] [Google Scholar]
- 7.Heit A, Huster KM, Schmitz F, Schiemann M, Busch DH, Wagner H. CpG-DNA aided cross-priming by cross-presenting B cells. J Immunol. 2004;172:1501–7. doi: 10.4049/jimmunol.172.3.1501. [DOI] [PubMed] [Google Scholar]
- 8.Schnare M, Barton GM, Holt AC, Takeda K, Akira S, Medzhitov R. Toll-like receptors control activation of adaptive immune responses. Nat Immunol. 2001;2:947–50. doi: 10.1038/ni712. [DOI] [PubMed] [Google Scholar]
- 9.Redecke V, Hacker H, Datta SK, et al. Cutting edge: activation of Toll-like receptor 2 induces a Th2 immune response and promotes experimental asthma. J Immunol. 2004;172:2739–43. doi: 10.4049/jimmunol.172.5.2739. [DOI] [PubMed] [Google Scholar]
- 10.Didierlaurent A, Ferrero I, Otten LA, et al. Flagellin promotes myeloid differentiation factor 88-dependent development of Th2-type response. J Immunol. 2004;172:6922–30. doi: 10.4049/jimmunol.172.11.6922. [DOI] [PubMed] [Google Scholar]
- 11.Sadanaga A, Nakashima H, Akahoshi M, et al. Protection against autoimmune nephritis in MyD88-deficient MRL/lpr mice. Arthritis Rheum. 2007;56:1618–28. doi: 10.1002/art.22571. [DOI] [PubMed] [Google Scholar]
- 12.Pawar RD, Ramanjaneyulu A, Kulkarni OP, Lech M, Segerer S, Anders HJ. Inhibition of Toll-like receptor-7 (TLR-7) or TLR-7 plus TLR-9 attenuates glomerulonephritis and lung injury in experimental lupus. J Am Soc Nephrol. 2007;18:1721–31. doi: 10.1681/ASN.2006101162. [DOI] [PubMed] [Google Scholar]
- 13.Christensen SR, Shupe J, Nickerson K, Kashgarian M, Flavell RA, Shlomchik MJ. Toll-like receptor 7 and TLR9 dictate autoantibody specificity and have opposing inflammatory and regulatory roles in a murine model of lupus. Immunity. 2006;25:417–28. doi: 10.1016/j.immuni.2006.07.013. [DOI] [PubMed] [Google Scholar]
- 14.Papadimitraki ED, Choulaki C, Koutala E, et al. Expansion of Toll-like receptor 9-expressing B cells in active systemic lupus erythematosus: implications for the induction and maintenance of the autoimmune process. Arthritis Rheum. 2006;54:3601–11. doi: 10.1002/art.22197. [DOI] [PubMed] [Google Scholar]
- 15.Komatsuda A, Wakui H, Iwamoto K, et al. Up-regulated expression of Toll-like receptors mRNAs in peripheral blood mononuclear cells from patients with systemic lupus erythematosus. Clin Exp Immunol. 2008;152:482–7. doi: 10.1111/j.1365-2249.2008.03646.x. [DOI] [PMC free article] [PubMed] [Google Scholar]
- 16.Tan EM, Cohen AS, Fries JF, et al. The 1982 revised criteria for the classification of systemic lupus erythematosus. Arthritis Rheum. 1982;25:1271–7. doi: 10.1002/art.1780251101. [DOI] [PubMed] [Google Scholar]
- 17.Bombardier C, Gladman DD, Urowitz MB, Caron D, Chang CH, the Committee on Prognosis studies in SLE Derivation of the SLEDAI: a disease activity index for lupus patients. Arthritis Rheum. 1992;35:630–40. doi: 10.1002/art.1780350606. [DOI] [PubMed] [Google Scholar]
- 18.Lun SW, Wong CK, Ko FW, Hui DS, Lam CW. Expression and functional analysis of Toll-like receptors of peripheral blood cells in asthmatic patients: implication for immunopathological mechanism in asthma. J Clin Immunol. 2009;29:330–42. doi: 10.1007/s10875-008-9269-1. [DOI] [PubMed] [Google Scholar]
- 19.Kulkarni O, Anders HJ. Chemokines in lupus nephritis. Front Biosci. 2008;13:3312–20. doi: 10.2741/2927. [DOI] [PubMed] [Google Scholar]
- 20.Lourenço EV, La Cava A. Cytokines in systemic lupus erythematosus. Curr Mol Med. 2009;9:242–54. doi: 10.2174/156652409787847263. [DOI] [PMC free article] [PubMed] [Google Scholar]
- 21.Abdollahi-Roodsaz S, Joosten LA, Koenders MI, et al. Stimulation of TLR2 and TLR4 differentially skews the balance of T cells in a mouse model of arthritis. J Clin Invest. 2008;118:205–16. doi: 10.1172/JCI32639. [DOI] [PMC free article] [PubMed] [Google Scholar]
- 22.Abdollahi-Roodsaz S, Joosten LA, Roelofs MF, et al. Inhibition of Toll-like receptor 4 breaks the inflammatory loop in autoimmune destructive arthritis. Arthritis Rheum. 2007;56:2957–67. doi: 10.1002/art.22848. [DOI] [PubMed] [Google Scholar]
- 23.Kattah MG, Wong MT, Yocum MD, Utz PJ. Cytokines secreted in response to Toll-like receptor ligand stimulation modulate differentiation of human Th17 cells. Arthritis Rheum. 2008;58:1619–29. doi: 10.1002/art.23497. [DOI] [PMC free article] [PubMed] [Google Scholar]
- 24.Wong CK, Lit LC, Tam LS, Li EK, Wong PT, Lam CW. Hyperproduction of IL-23 and IL-17 in patients with systemic lupus erythematosus: implications for Th17-mediated inflammation in auto-immunity. Clin Immunol. 2008;127:385–93. doi: 10.1016/j.clim.2008.01.019. [DOI] [PubMed] [Google Scholar]
- 25.Eis V, Luckow B, Vielhauer V, et al. Chemokine receptor CCR1 but not CCR5 mediates leukocyte recruitment and subsequent renal fibrosis after unilateral ureteral obstruction. J Am Soc Nephrol. 2004;15:337–47. doi: 10.1097/01.asn.0000111246.87175.32. [DOI] [PubMed] [Google Scholar]
- 26.Moore KJ, Wada T, Barbee SD, Kelley VR. Gene transfer of RANTES elicits autoimmune renal injury in MRL-Fas(1pr) mice. Kidney Int. 1998;53:1631–41. doi: 10.1046/j.1523-1755.1998.00911.x. [DOI] [PubMed] [Google Scholar]
- 27.Stahl RA, Thaiss F, Disser M, Helmchen U, Hora K, Schlöndorff D. Increased expression of monocyte chemoattractant protein-1 in anti-thymocyte antibody-induced glomerulonephritis. Kidney Int. 1993;44:1036–47. doi: 10.1038/ki.1993.346. [DOI] [PubMed] [Google Scholar]
- 28.Chan RW, Tam LS, Li EK, et al. Inflammatory cytokine gene expression in the urinary sediment of patients with lupus nephritis. Arthritis Rheum. 2003;48:1326–31. doi: 10.1002/art.11062. [DOI] [PubMed] [Google Scholar]
- 29.Lit LC, Wong CK, Tam LS, Li EK, Lam CW. Raised plasma concentration and ex vivo production of inflammatory chemokines in patients with systemic lupus erythematosus. Ann Rheum Dis. 2006;65:209–15. doi: 10.1136/ard.2005.038315. [DOI] [PMC free article] [PubMed] [Google Scholar]
- 30.Demirci FY, Manzi S, Ramsey-Goldman R, et al. Association study of Toll-like receptor 5 (TLR5) and Toll-like receptor 9 (TLR9) polymorphisms in systemic lupus erythematosus. J Rheumatol. 2007;34:1708–11. [PubMed] [Google Scholar]
- 31.Ma Z, Chen F, Madaio MP, Cohen PL, Eisenberg RA. Modulation ofautoimmunity by TLR9 in the chronic graft-vs-host model of systemic lupus erythematosus. J Immunol. 2006;177:7444–50. doi: 10.4049/jimmunol.177.10.7444. [DOI] [PubMed] [Google Scholar]
- 32.Pawar RD, Patole PS, Ellwart A, et al. Ligands to nucleic acid-specific Toll-like receptors and the onset of lupus nephritis. J Am Soc Nephrol. 2006;17:3365–73. doi: 10.1681/ASN.2006030263. [DOI] [PubMed] [Google Scholar]
- 33.Migita K, Miyashita T, Maeda Y, et al. Toll-like receptor expression in lupus peripheral blood mononuclear cells. J Rheumatol. 2007;34:493–500. [PubMed] [Google Scholar]
- 34.Nakano S, Morimoto S, Suzuki J, et al. Role of pathogenic auto-antibody production by Toll-like receptor 9 of B cells in active systemic lupus erythematosus. Rheumatology. 2008;47:145–9. doi: 10.1093/rheumatology/kem327. [DOI] [PubMed] [Google Scholar]
- 35.Zorro S, Arias M, Riaño F, et al. Response to ODN-CpG by B Cells from patients with systemic lupus erythematosus correlates with disease activity. Lupus. 2009;18:718–26. doi: 10.1177/0961203309103098. [DOI] [PubMed] [Google Scholar]
- 36.Peng G, Guo Z, Kiniwa Y, et al. Toll-like receptor 8-mediated reversal of CD4+ regulatory T cell function. Science. 2005;309:1380–4. doi: 10.1126/science.1113401. [DOI] [PubMed] [Google Scholar]
- 37.Yang J, Chu Y, Yang X, et al. Th17 and natural Treg cell population dynamics in systemic lupus erythematosus. Arthritis Rheum. 2009;60:1472–83. doi: 10.1002/art.24499. [DOI] [PubMed] [Google Scholar]
- 38.Vollmer J, Tluk S, Schmitz C, et al. Immune stimulation mediated by autoantigen binding sites within small nuclear RNAs involves Toll-like receptors 7 and 8. J Exp Med. 2005;202:1575–85. doi: 10.1084/jem.20051696. [DOI] [PMC free article] [PubMed] [Google Scholar]
- 39.Patole PS, Grone HJ, Segerer S, et al. Viral doublestranded RNA aggravates lupus nephritis through Toll-like receptor 3 on glomerular mesangial cells and antigen-presenting cells. J Am Soc Nephrol. 2005;16:1326–38. doi: 10.1681/ASN.2004100820. [DOI] [PubMed] [Google Scholar]
- 40.Kim WU, Sreih A, Bucala R. Toll-like receptors in systemic lupus erythematosus; prospects for therapeutic intervention. Autoimmun Rev. 2009;8:204–8. doi: 10.1016/j.autrev.2008.07.046. [DOI] [PMC free article] [PubMed] [Google Scholar]
- 41.Barrat FJ, Coffman RL. Development of TLR inhibitors for the treatment of autoimmune diseases. Immunol Rev. 2008;223:271–83. doi: 10.1111/j.1600-065X.2008.00630.x. [DOI] [PubMed] [Google Scholar]