

Summary
Objectives
To report the career destinations, views and future plans of a cohort of senior doctors who qualified in the 1980s.
Methods
Postal questionnaire survey of all doctors who qualified from all UK medical schools in 1988.
Results
The response rate was 69%. We estimated that 81% of the total cohort was working in the NHS, 16 years after qualification; and that at least 94% of graduates who, when students, were from UK homes, were working in medicine. Of NHS doctors, 30% worked part-time. NHS doctors rated their job satisfaction highly (median score 19.9, scale 5–25) but were less satisfied with the amount of leisure time available to them (median score 5.4, scale 1–10). NHS doctors were very positive about their careers, but were less positive about working hours and some other aspects of the NHS. Women were more positive than men about working conditions; general practitioners were more positive than hospital doctors. Twenty-five percent reported unmet needs for further training or career-related advice, particularly about career development. Twenty-nine percent intended to reduce their hours in future, while 6%, mainly part-time women, planned to increase their hours. Overall, 10% of NHS doctors planned to do more service work in future and 24% planned to do less; among part-time women, 18% planned to do more and only 14% less.
Conclusions
These NHS doctors, now in their 40s, had a high level of satisfaction with their jobs and their careers but were less satisfied with some other aspects of their working environment. A substantial percentage had expectations about future career development and change.
Introduction
Information about doctors' career pathways and destinations, their views about their jobs and future career intentions is important for workforce planning, especially in the context of concerns about the retention of senior doctors.1 However, in the UK, knowledge of the careers, views and future plans of senior doctors is scarce. As part of a broader programme of work on doctors' careers, we surveyed the doctors who qualified from UK medical schools in 1988, as an example of senior doctors who qualified in the 1980s. In this paper, we present information based on our most recent survey in 2004. This augments our previous research on the qualifiers of 1977.2,3
We report the career destinations of home-based and overseas-based UK graduates (defined by place of family home immediately prior to entering medical school), and of men and women. For those in the NHS, we summarize their working patterns.
We also report respondents' satisfaction with their job, with the time that their job leaves them for leisure, and their views about key aspects of their jobs and careers. We outline unmet career needs of respondents and their future career plans. Our null hypotheses were that there would not be differences between men and women, between hospital doctors and general practitioners, and between part-timers and full-timers in these respects.
Methods
Procedure and population
Our methods are described elsewhere.4 We sent postal questionnaires to all doctors who graduated in 1988 from all UK medical schools. The ‘nominal roll’ of all who originally graduated was provided by the General Medical Council (GMC) for a first survey of the cohort in 1995.5 Contact information has been updated since then using information from both the GMC and the doctors' own replies to successive surveys. We report on career destinations of the whole cohort and on the views and plans of respondents working in the NHS, considering both those working on substantive NHS contracts and academics with honorary NHS contracts.
The survey instrument and analysis
The questionnaire comprised structured, ‘closed’ questions and statements, and some ‘open’ questions asking the doctors to provide ‘free text’ comments. Topics covered included their employment, satisfaction with their job and with the amount of time outside work, views about their jobs and their career plans.
To assess doctors' views on job satisfaction, working conditions, support available and career opportunities, we invited them to respond to various statements by scoring their views on a 5-point scale from strongly agree to strongly disagree. For ease of presentation we only show the data on agreement, with responses ‘strongly agree’ and ‘agree’ combined. The job satisfaction score was a composite of five statements, each on a five-point scale, with a total score out of 25. Satisfaction with time available for non-work activities was scored on a 10-point scale. In reporting on career destinations, we aggregated specialties into broad groups (based on those initially defined in the Todd Report6).
Quantitative methods of analysis used were descriptive statistics, χ2 tests, Mann-Whitney U tests, binary logistic regression and capture-recapture analysis.7–9 In making multiple similar comparisons, we regarded the attainment of a significance threshold of p ≤ 0.01 as evidence of significant difference. Observed differences in leisure satisfaction scores were analysed using binary logistic regression, the binary dependent variable being derived by grouping the leisure scores into two groups: doctors who scored above average levels of satisfaction (over 5) and those scoring at or below average (5 or under). Logistic regression models with combinations of three binary predictors were examined: sex, work pattern (full-time/part-time) and specialty (grouped as general practice/hospital practice).
We refer to previously published capture–recapture analysis10 to augment our destination data from respondents, which draws on information from the Department of Health about qualifiers from 1988 known to be working in the NHS. Department of Health data did not include employment in Northern Ireland and, accordingly, our capture-recapture calculations only refer to doctors who qualified in Great Britain (GB) and who worked in the GB NHS. The deceased and non-participants are excluded from the capture-recapture analysis. We refer to those whose homes were in UK when they entered medical school and those whose homes were outside UK as ‘home-based’ graduates and ‘overseas-based’ graduates, respectively.
In reporting the percentages of NHS doctors planning career changes, we use the total NHS responder population as the denominator.
Results
A total of 3739 doctors qualified from UK medical schools in 1988. The response rate, excluding 24 who had died and 40 who declined to participate, was 69% (2521/3675). The median age of the responders was 40 years at the time of the latest survey.
Career destinations: respondents
Of the respondents, 97.6% (99.2% of men, 95.8% of women) were working in medicine and 84.5% (84.1% of men, 84.9% of women) were working in the NHS at the time of their response ( Table 1). Among respondents whose family home locations were known, 97.6% (2195/2249) of home-based graduates were working in medicine and 85.1% (1914/2249) in the NHS; among respondents who were overseas-based graduates, the corresponding percentages were 100% (44/44) and 59.1% (26/44).
Table 1.
Career destinations of the respondents of the cohort of UK qualifiers of 1988: percentages of all respondents (and numbers)
| Men (%) | Women (%) | Total (%) | Men (n) | Women (n) | Total (n) | |
|---|---|---|---|---|---|---|
| Responders in medical employment | ||||||
| UK NHS : | ||||||
| General practicea | 32.1 | 41.4 | 36.6 | 418 | 498 | 916 |
| Hospital medical specialties | 11.8 | 9.6 | 10.7 | 154 | 115 | 269 |
| Surgical specialtiesa | 13.2 | 2.6 | 8.1 | 172 | 31 | 203 |
| Paediatrics | 2.8 | 4.0 | 3.4 | 36 | 48 | 84 |
| Accident and emergency | 1.5 | 1.7 | 1.6 | 19 | 21 | 40 |
| Obstetrics and gynaecology | 2.0 | 2.2 | 2.1 | 26 | 27 | 53 |
| Anaestheticsa | 8.4 | 5.2 | 6.8 | 109 | 62 | 171 |
| Radiology | 2.7 | 2.0 | 2.4 | 35 | 24 | 59 |
| Clinical oncologya | 0.6 | 1.7 | 1.2 | 8 | 21 | 29 |
| Pathology | 2.2 | 1.6 | 1.9 | 28 | 19 | 47 |
| Psychiatrya | 5.1 | 8.7 | 6.9 | 67 | 105 | 172 |
| Community healtha | 0.2 | 2.0 | 1.1 | 3 | 24 | 27 |
| Public health medicine | 0.7 | 1.3 | 1.0 | 9 | 16 | 25 |
| Other clinical specialties* | 0.8 | 1.6 | 0.8 | 11 | 19 | 20 |
| Total in the NHS | 84.1 | 84.9 | 84.5 | 1095 | 1020 | 2115 |
| UK medicine outside the NHS | 7.8 | 5.9 | 6.9 | 102 | 71 | 173 |
| Medicine abroad | 7.3 | 5.1 | 6.2 | 95 | 61 | 156 |
| Hospital practice† | 4.8 | 2.7 | 3.8 | 62 | 33 | 95 |
| General practice† | 2.3 | 2.2 | 2.2 | 30 | 26 | 56 |
| Total in medical employment | 99.2 | 95.8 | 97.6 | 1292 | 1152 | 2444 |
| Responders not in medical employment | ||||||
| Non-medical employment | 0.5 | 0.5 | 0.5 | 6 | 6 | 12 |
| Not in paid employment | 0.3 | 3.7 | 1.9 | 4 | 44 | 48 |
| All respondents‡ | 100.0 | 100.0 | 100.0 | 1302 | 1202 | 2504 |
Percentages may not add up exactly owing to rounding
Includes doctors known to be working in medicine but who did not state their specialty
Percentages do not add up to percentages for all those in medicine abroad because percentages for community medicine and public health medicine are excluded
Seventeen respondents did not provide details of their employment and have been omitted from the table
Male–female differences in the specialty groups: For the 14 NHS specialty groups overall (χ212=159.4, p<0.001), a denotes the individual specialties that show significant male–female differences
Of the 2115 doctors in the NHS, 54% (1147) were in hospital practice, 43% (916) in general practice, 1% (27) in community health and 1% (25) in public health. Sixty-one percent of the men and 47% of the women were in hospital practice; 38% of the men and 49% of the women were in general practice; and 1% of the men and 3% of the women were in community or public health. Comparing the NHS doctors in these three broad career destinations, the differences between men and women were significant (χ22=48.7, p<0.001). Fifteen percent of male respondents and 11% of female respondents worked in medicine outside the NHS (difference between men and women, χ21=9.1, p=0.003).
Career destinations: whole cohort
Respondent data alone may overestimate the percentage in the NHS and in medicine, because non-respondents may be less likely than respondents to be practising, and, if practising, to be in the NHS. This may be either because those not in the NHS are more difficult to locate, or may feel the survey does not apply to them. We therefore sought to extend our estimates of participation to cover the whole cohort. We used data about respondents in combination with DH employment data, and capture-recapture analysis as reported elsewhere,8 to produce a more accurate estimate of the number in the cohort practising in the NHS in GB. Hence we obtained improved estimates of the percentage of the whole cohort in medicine in GB and worldwide.
Our capture-recapture estimate is that 80.6% (95% CI: 80.1%–81.2%) of the whole cohort of GB graduates from 1988 were working in the NHS in GB 16 years after graduation (men 81.0%, 80.2%–81.7%; women 79.9%, 79.1%–80.8%). For home-based GB graduates in the NHS the estimate was 86.8%, compared with 61.7% for overseas-based graduates.
We then calculated the minimum number known to be in medicine, by adding to this capture–recapture estimate the number of respondents known to be in medicine outside the GB NHS. We concluded that at least 87.3% of the cohort (88.2% of men, 85.8% of women) was practising medicine. For home-based GB graduates the estimate was 94.1% (94.8% of men, 93.2% of women), compared with 87.9% for overseas-based graduates (89.2% of men, 86.0% of women).
Career destinations: working pattern and other posts
Thirty percent (625/2078) of NHS respondents who told us about their working pattern were working part-time. As expected, part-time working was much more common for women than for men (57% and 5%, respectively, p<0.001), and much more common in general practice than hospital practice (41% and 20%, respectively, p<0.001). A total of 87% (999/1147) of hospital doctors were consultants (95% of men and 76% of women) and 93% (851/916) of general practitioners were GP principals (97% of men and 89% of women).
A number of doctors in the NHS held other posts in addition to their main clinical specialty. Forty-two respondents were also medical directors/clinical directors in NHS Trusts, clinical directorates or other NHS organizations. Eight were PEC members or PEC chairs (PECs are Professional Executive Committees in Primary Care Trusts in the UK). Eighteen also held other substantive roles in Primary Care Trusts and 50 also held posts in the private sector.
Satisfaction with job and leisure time
NHS doctors rated their job satisfaction highly: they had an overall median score of 19.9 on a scale from 5 (very low satisfaction) to 25 (very high satisfaction). The job satisfaction scores of men and women working in the NHS were very similar (median scores 19.8 and 19.9, respectively), and most of the differences between specialties were small ( Figure 1). An exception was the difference between hospital doctors and general practitioners (median scores 20.1 and 19.6, respectively, p<0.001). The least satisfied group, though marginally so, was the group of part-time men (19.1).
Figure 1.
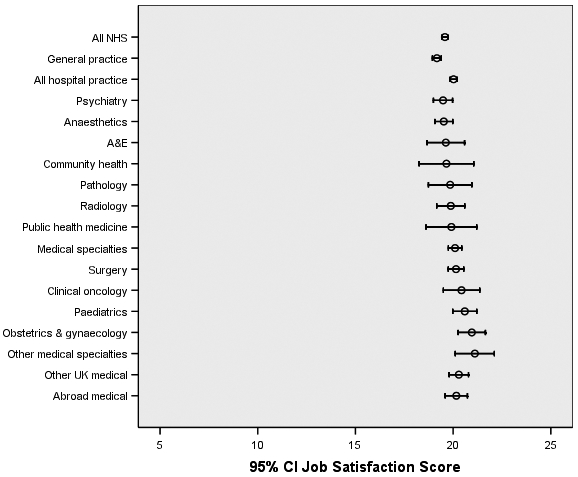
Job satisfaction scores, with 95% confidence intervals, for occupational groups and NHS specialties
The respondents were much less positive about the time that their job left them for activities outside work ( Table 2): the overall score was 5.4, on a scale of 1 (very low satisfaction) to 10 (very high). Women were more satisfied than men (median scores 6.2 and 4.7, respectively, p<0.001), general practitioners were more satisfied than hospital practitioners (6.0 and 4.9, respectively, p<0.001), and part-timers were more satisfied than full-timers (7.2 and 4.9, respectively).
Table 2.
Satisfaction with time available for leisure; median scores* from 1 (not at all satisfied) to 10 (extremely satisfied)
| Men | Women | Full-time men | Part-time men | Full-time women | Part-time women | Total | |
|---|---|---|---|---|---|---|---|
| All in the NHS | 4.7a | 6.2a | 4.5b | 7.4b | 4.7c | 7.2c | 5.4 |
| General practice | 5.3a | 6.4a | 5.0b | 7.4b | 4.8c | 7.1c | 6.0 |
| Hospital practice | 4.4a | 5.8a | 4.3 | 5.7 | 4.7c | 7.2c | 4.9 |
| Specialist practice: | |||||||
| Hospital medical specialties | 3.8a | 6.0a | 3.7 | 4.7 | 4.6c | 7.3c | 4.5 |
| Surgical specialties | 4.4 | 6.1 | 4.4 | 2.0 | 4.8 | 7.5 | 4.6 |
| Paediatrics | 4.6 | 4.6 | 4.6 | – | 3.8c | 6.5c | 4.6 |
| Accident and emergency | 5.5 | 5.8 | 5.3 | 8.0 | 5.0 | 6.0 | 5.6 |
| Obstetrics and gynaecology | 4.3 | 5.3 | 4.3 | – | 4.7c | 7.3c | 4.9 |
| Anaesthetics | 4.4 | 5.2 | 4.4 | 3.5 | 4.7 | 7.3 | 4.6 |
| Radiology | 4.3 | 6.4 | 4.3 | – | 4.6 | 6.9 | 4.8 |
| Clinical oncology | 3.5 | 5.7 | 3.5 | – | 5.7c | 7.5c | 5.3 |
| Pathology | 4.3 | 4.8 | 4.3 | – | 4.7 | 5.0 | 4.5 |
| Psychiatry | 6.3 | 6.6 | 5.9b | 9.0b | 5.4c | 7.2c | 6.4 |
| Community health | 2.3a | 7.6a | 2.3 | – | 5.0 | 8.0 | 7.1 |
| Public health medicine | 4.6 | 6.7 | 4.6 | – | 5.0 | 8.0 | 5.8 |
| UK, medical jobs, outside NHS | 5.5 | 5.3 | 5.4 | 7.7 | 5.1 | 6.5 | 5.4 |
| Medicine abroad | 6.6 | 6.8 | 6.5 | 8.0 | 3.9c | 7.6c | 6.7 |
| General practice | 5.0 | 6.6 | 5.0 | 5.0 | 3.0 | 7.1 | 5.9 |
| Hospital practice | 6.9 | 7.1 | 6.8 | 8.5 | 5.3c | 8.4c | 7.0 |
Statistically significant male–female difference at the 0.01 level
Statistically significant full-time male–part-time male difference
Statistically significant full-time female–part-time female difference
2428/2444 (99.3%) of respondents in medical employment gave valid replies
Grouped median scores, calculated using linear interpolation on the grouped whole-number scores, and quoted to one decimal place (although the original data values were whole numbers)
Logistic regression showed that, in the NHS, the male–female differences in satisfaction with leisure time were mainly attributable to part-time working by women and that the GP-hospital practice differences were mainly attributable to part-time working in general practice. For those working in the NHS, the unadjusted odds ratio for women relative to men having leisure satisfaction levels above 5 was 1.75 (95% CI 1.47, 2.08), and it became 0.95 (0.76, 1.18) after adjustment, when working pattern was added to the model. For those working in NHS hospital practice or NHS general practice, the unadjusted odds ratio for general practitioners relative to hospital doctors having leisure satisfaction levels above 5 was 1.49 (95% CI 1.25,1.77), and it became 1.21 (1.01,1.46) when working pattern was added to the model.
Views about their jobs and careers
Seventy-seven percent of NHS respondents agreed that they received good support from nursing staff, and 43% that they got good support from management (Table 3). Fifty-nine percent agreed that their working hours were excessive and 47% agreed that their working conditions were satisfactory. Women were more positive than men, and general practitioners were more positive than hospital doctors, about working hours and conditions. The differences were mainly attributable to part-time working by women in general practice. General practitioners were more positive about management support than hospital doctors (only 31% of hospital doctors agreed that support from management was good, compared with 59% of general practitioners). Only 37% of hospital doctors agreed that working conditions were satisfactory, compared with 60% of general practitioners.
Table 3.
Views of respondents about their jobs and careers opportunities for doctors working in the NHS. Values are percentages who definitely or probably agreed with each statement
| All (n=2115) | Men (n=1095) | Women (n=1020) | Hospital practice (n=1147) | General practice (n=916) | |
|---|---|---|---|---|---|
| Working conditions and support | |||||
| Good support from nursing staff | 76.6 | 72.7a | 80.8a | 72.7b | 81.7b |
| Good support from management | 43.0 | 40.6 | 45.7 | 30.8b | 59.2b |
| Hours are excessive | 58.6 | 64.9a | 51.8a | 61.9b | 55.0b |
| Working conditions are satisfactory | 47.2 | 43.3a | 51.4a | 36.6b | 60.1b |
| Career | |||||
| Good career opportunities to date | 77.5 | 79.0 | 76.0 | 81.4b | 73.0b |
| Good opportunities for continuing professional development | 67.1 | 67.8 | 66.4 | 68.5 | 65.0 |
| Prospects are good | 71.6 | 75.8a | 67.1a | 74.7b | 67.9b |
| The UK NHS | |||||
| Postgraduate training imposes excessive demands on hospital consultants | 59.4 | 60.9 | 57.6 | 69.2b | 40.2b |
| Reduction in junior doctors' hours has been counter to interests of NHS | 55.1 | 59.4a | 50.4a | 65.8b | 40.7b |
| NHS is a good equal opportunities employer in respect of ethnicity | 40.4 | 44.3a | 36.1a | 46.8b | 31.8b |
| NHS good is a equal opportunities employer in respect of women | 58.9 | 61.9a | 55.9a | 63.1b | 53.7b |
| NHS is a good equal opportunities employer in respect of disability | 16.2 | 20.4a | 11.5a | 19.2b | 12.3b |
| Good prospects for improvement of NHS in my specialty | 47.2 | 48.7 | 45.5 | 49.8b | 43.7b |
| Good opportunities for re-training in NHS | 18.2 | 14.8a | 21.8a | 16.0b | 20.6b |
Statistically significant male–female difference at the 0.01 level
Statistically significant hospital practice–general practice difference
The NHS respondents' views were generally positive about career opportunities. Seventy-seven percent specified that they had good opportunities to date, 67% that they had good opportunities for continuing professional development and 72% specified that their future career prospects were good. Men were more positive than women about their career prospects. Full-timers were generally more satisfied than part-timers. Hospital doctors were more positive than general practitioners.
Fifty-nine percent agreed that the need to provide postgraduate training imposed excessive demands on consultants and 55% agreed that the reduction in junior doctors' hours has been counter to the interests of the NHS. Fifty-nine percent agreed that the NHS was a good equal opportunities employer with respect to women, 23% neither agreed nor disagreed, and 18% disagreed. 40% agreed that the NHS was a good equal opportunities employer with respect to ethnicity, 34% neither agreed nor disagreed, and 26% disagreed. Only 18% agreed that there were good opportunities for re-training in the NHS (31% neither agreed nor disagreed, and 51% disagreed). Men were more negative than women, and hospital doctors were more negative than general practitioners, about the demands imposed by postgraduate training and about the consequences of reducing junior doctors' hours. Men were more positive than women, and hospital doctors were more positive than general practitioners, about the NHS being a good ‘equal opportunities’ employer and about prospects for improvement of the NHS in their specialty. Women were more positive than men, and general practitioners were more positive than hospital doctors, about opportunities for re-training in the NHS.
Unmet career needs
Twenty-five percent of the graduates of 1988 who were working as NHS doctors reported having unmet career needs. Those who stated that they had unmet needs were invited to comment: 419 comments were made. The majority (66%) commented on career development issues. A further 14% commented about counselling and mentoring issues.
Future career plans: intentions to continue practising medicine in the UK
Respondents were asked: ‘Do you intend to continue practising medicine in the UK for the foreseeable future?’ Of the NHS doctors, 66% (1377/2102) were definitely planning to continue, 27% (579) would probably do so, and 3% (53) probably or definitely would not. Considering the 93% who stated that they would definitely or probably continue practising medicine in the UK, there were no significant differences between men and women in their intentions to continue practising (92% and 94%, respectively, p=0.2), or between hospital doctors and general practitioners (93% and 94%, respectively, p=0.5).
Of the 725 doctors who told us that they were not definitely intending to continue practising medicine in the UK, 672 specified their plans. Using the total NHS responder population as the denominator, 16% (339) of all respondents indicated that they might practice abroad, 17% (354) indicated that they might leave medicine and stay in the UK, and 2% (50) specified that they might leave both medicine and the UK. A significantly higher percentage of men than of women were considered the possibility of practising abroad (21% and 11%, respectively, p<0.001), and a significantly higher percentage of women than men indicated that they might leave medicine and stay in the UK (21% and 13%, respectively, p<0.001). Significantly higher percentages of hospital doctors than of general practitioners were considering the possibility of practising abroad (19% and 13%, respectively, p=0.002). Of those who were considering one of the above three possibilities, the reason most commonly cited was disillusionment with their job.
Future career plans: intentions to continue with their current job
Respondents were asked: ‘Do you expect to continue with your current employment on the same basis for the foreseeable future?’ Of NHS respondents, 39% (819/2092) stated that they would definitely continue with their current employment and another 39% would probably continue. A higher percentage of men than women definitely planned to continue (43% and 35%, respectively, p<0.001). Similar percentages of general practitioners and hospital doctors definitely planned to continue (40% and 39%, respectively, p=1.0).
Planned changes to current job
Sixty-one percent (1273/2092) of NHS doctors were not planning definitely to continue with their current employment on the same basis and 1238 had made plans to change. Table 4 shows the percentage of doctors who would like to make changes, using the total NHS responder population as the denominator. The planned change most often cited – by 29% of all NHS respondents – was to reduce their hours. Six percent intended to increase their hours, with a significantly higher percentage of women than men planning to do so (12% and 2%, respectively), largely reflecting the wish of part-time women to increase their hours (2% of full-time women and 19% of part-time women intended to do so).
Table 4.
Percentages of NHS doctors who planned to change their current job
| All | Men | Women | Hospital practice | General practice | |
|---|---|---|---|---|---|
| No changes anticipated | 39.8 | 43.9 | 35.4 | 40.0 | 40.1 |
| Planned changes | |||||
| Reduce hours | 29.3 | 30.1 | 28.3 | 31.0 | 27.5 |
| Increase hours | 6.3 | 1.6a | 11.5a | 4.5b | 8.4b |
| Change work setting | 21.2 | 22.8 | 19.5 | 25.2b | 15.8b |
| Change of work content* | 11.1 | 13.3a | 8.6a | 9.5 | 12.9 |
| Other plan | 14.8 | 11.6a | 18.3a | 13.8 | 15.7 |
Medico-legal, writing, journalism were given as examples
Denominators: 2115 (all); 1095 (men); 1020 (women); 1147 (hospital practice); 916 (general practice)
Statistically significant male–female difference at the 0.01 level
Statistically significant hospital practice–general practice difference
A higher percentage of hospital doctors than general practitioners planned to change their work setting, for example, to move to another job (25% and 16%). Of those who wanted to change, the two motivations most commonly cited were to develop their professional interests and a desire for a change or new challenge.
Changes in time commitments
Table 5 shows the percentages of NHS respondents who planned to change their time commitments to various activities. Medical education was the aspect of work where the highest percentage (25%) planned to increase their time commitment and where the lowest percentage (6%) planned to do less. Service work/treating patients was the area where the lowest percentage planned to increase their time commitment (10%) and where the highest percentage (24%) wanted to reduce their activity. There were differences between full-time and part-time women: 9% of full-time women wanted to increase, and 30% wanted to decrease, their time on service work. Of part-time women, 18% wanted to increase, and 14% wanted to decrease, their time spent in service work.
Table 5.
Percentages of NHS doctors who planned to change their time commitments
| Percentage breakdown | ||||
|---|---|---|---|---|
| Change | Group | More | Less | About the same |
| Medical education/teaching | All | 25 | 6 | 69 |
| Men | 23 | 6 | 71 | |
| Women | 26 | 6 | 68 | |
| Hospital practice | 24 | 7 | 68 | |
| General practice | 25 | 5 | 71 | |
| Full-time men | 23 | 6 | 71 | |
| Part-time men | 25 | 6 | 70 | |
| Full-time womena | 25 | 9 | 67 | |
| Part-time womena | 27 | 4 | 69 | |
| Research work | All | 13 | 7 | 80 |
| Menb | 16 | 8 | 76 | |
| Womenb | 9 | 7 | 84 | |
| Hospital practicec | 19 | 8 | 73 | |
| General practicec | 4 | 7 | 89 | |
| Full-time men | 17 | 8 | 76 | |
| Part-time men | 13 | 9 | 77 | |
| Full-time women | 12 | 8 | 80 | |
| Part-time women | 7 | 6 | 87 | |
| Management/health policy work/administration | All | 14 | 17 | 69 |
| Men | 14 | 17 | 69 | |
| Women | 14 | 17 | 69 | |
| Hospital practice | 14 | 18 | 69 | |
| General practice | 14 | 16 | 70 | |
| Full-time men | 14 | 18 | 69 | |
| Part-time men | 25 | 15 | 60 | |
| Full-time womena | 13 | 22 | 65 | |
| Part-time womena | 14 | 13 | 73 | |
| Other professional activities | All | 14 | 8 | 79 |
| Men | 16 | 8 | 76 | |
| Women | 12 | 7 | 81 | |
| Hospital practice | 15 | 8 | 77 | |
| General practice | 12 | 7 | 82 | |
| Full-time men | 16 | 8 | 76 | |
| Part-time men | 19 | 8 | 74 | |
| Full-time women | 12 | 8 | 79 | |
| Part-time women | 12 | 6 | 83 | |
| Service work/treating patients | All | 10 | 24 | 67 |
| Menb | 5 | 26 | 68 | |
| Womenb | 14 | 21 | 65 | |
| Hospital practicec | 8 | 26 | 66 | |
| General practicec | 11 | 22 | 68 | |
| Full-time menb | 5 | 26 | 68 | |
| Part-time men | 9 | 25 | 66 | |
| Full-time womena,b | 9 | 30 | 61 | |
| Part-time womena | 18 | 14 | 68 | |
Statistically significant difference comparing doctors working full-time and those working part-time
Statistically significant male–female difference at the 0.01 level
Statistically significant hospital practice–general practice difference
Denominators: 2115 (all); 1095 (men); 1020 (women); 1147 (hospital practice); 916 (general practice); 1019 (full-time men); 53 (part-time men); 434 (full-time women); 572 (part-time women)
The intentions of men and women towards research differed (p<0.001) with higher percentages of men than women planning to do more (16% and 9%, respectively). Seven percent of part-time women and 12% of full-time women wanted to do more research.
Potential influence of job satisfaction on future intentions
NHS doctors who had high levels of job satisfaction (those in the highest quartile, with scores between 22 and 25) were more likely than those with medium levels (18 to 21, central two quartiles) or low levels (5 to 17, lowest quartile) to state a definite intention to continue practising in the UK for the foreseeable future (84% vs. 68% vs. 36%, respectively, χ22=264.3, p<0.001). NHS doctors who had high levels of job satisfaction were also more likely than those with medium levels or low levels to state a definite intention to continue with their current employment on the same basis for the foreseeable future (58% vs. 38% vs. 18%, respectively, χ22=172.0, p<0.001).
NHS doctors with above-average levels of satisfaction with leisure time (scores over 5) were more likely than those scoring 5 or below to state a definite intention to continue to practise in the UK for the foreseeable future (72% vs. 59%, χ21=34.4, p<0.001). The same applied for those who stated a definite intention to continue with their current employment on the same basis for the foreseeable future (46% scoring over 5 vs. 33% scoring 5 or less, χ21=39.0, p<0.001).
Discussion
Principal findings
Sixteen years after qualification, the great majority of doctors in this cohort were practising medicine, most of them in the NHS. There was a high level of job satisfaction and of satisfaction with their career opportunities so far, but they were less positive about some other aspects of their jobs. These included relatively low levels of satisfaction with the time that their work left them for leisure and family activities. Advice on career development was still needed by some, and a sizeable percentage planned to reduce their hours.
Strengths, weaknesses
We believe that ours is the most comprehensive career study undertaken of a cohort of UK doctors who qualified in the 1980s. Other aspects of the careers, career progression and views of doctors in this cohort have been published elsewhere.5,10–14 Although the response rate was high, we cannot discount the possibility of responder bias. Our results are consistent with those based on a similar survey by us of the qualifiers of 1977.2,3 Differences between the 1977s and 1988s can be explained by the longer working experience and older age of the former: for example the qualifiers of 1977 raised more issues about retirement and pension planning.3 Our results are also consistent with the recently published reports of the Royal College of Physicians15,16 in terms of the high proportion of women working part-time and the concentration of women who work in areas of medicine with relatively predictable working hours such as general practice, psychiatry and public health.
Policy implications
Of the 1988s, similar percentages of men and women practised medicine in the NHS, a finding we have reported for this and other cohorts of British qualifiers elsewhere.10 Concerns that more women than men give up medical practice are largely unfounded in this generation of doctors. However, a substantial percentage of women work part-time, which has implications for workforce planning. We found evidence that a sizeable percentage of doctors hope to reduce their working hours. If this were put into practice, it would have implications for service provision for patients and capacity for training junior doctors. These senior doctors' intentions to ‘downshift’ might also signal their intentions to defer their retirement which is consistent with the aims of Department of Health initiatives.17–19
Our findings also have implications for provision of career advice and development. This survey of the 1988s confirms our earlier findings3 and those of others1,20 that advice about career development is needed for experienced doctors as well as for those in their early years. One-quarter of the 1988s working in the NHS indicated that they had unmet needs for advice, especially about career development. These needs should be factored into the design of, and resources for, doctors' continuing professional development.
Unanswered questions and future research
As in our study of 1977 graduates,2,3 a higher percentage of women than men in hospital practice were not consultants. Further investigation could be undertaken, particularly of younger generations of doctors, to identify whether this is by choice, or whether some women feel disadvantaged or discriminated against. Further exploration of doctors' views about the NHS as a good equal opportunities employer is warranted. Further research could also provide insight into the specific challenges faced by senior doctors who wish to change their roles within medicine.
Footnotes
DECLARATIONS —
Competing interests None declared
Funding The UK Medical Careers Research Group is funded by the Policy Research Programme of the UK Department of Health. The views expressed in this paper are not necessarily those of the funding body
Ethical approval The Brighton and Mid Sussex Research Ethics Committee approved the UK Medical Careers Research Group's surveys and studies, in its role as a multicentre research ethics committee (REC 04/Q1907/48)
Guarantor KT
Contributorship All authors contributed equally
Acknowledgements
The authors are very grateful to each doctor who participated. They thank Janet Justice, Alison Stockford and Emma Ayres
References
- 1.Department of Health The NHS plan: proposal for a new approach to the consultant contract. London: Department of Health; 2001 [Google Scholar]
- 2.Taylor K, Lambert T, Goldacre M. Career destinations, job satisfaction and views of the UK medical qualifiers of 1977. J R Soc Med 2008:101:191–200 [DOI] [PMC free article] [PubMed] [Google Scholar]
- 3.Taylor K, Lambert T, Goldacre M. Future career plans of a cohort of senior doctors working in the National Health Service. J R Soc Med 2008;101:182–90 [DOI] [PMC free article] [PubMed] [Google Scholar]
- 4.Parkhouse J. Doctors' careers: aims and experiences of medical graduates. London: Routledge; 1991 [Google Scholar]
- 5.Lambert TW, Goldacre MJ. Career destinations seven years on among doctors who qualified in the United Kingdom in 1988: postal questionnaire survey. BMJ 1988; 317: 1429-31 [DOI] [PMC free article] [PubMed] [Google Scholar]
- 6.Royal Commission on Medical Education 1965–8 Report. London: HMSO; 1968 [Google Scholar]
- 7.Lambert T, Goldacre M, Davidson J. Loss of British-trained doctors from the medical workforce in Great Britain. Med Educ 2001;35:337–44 [DOI] [PubMed] [Google Scholar]
- 8.Hook EB, Regal RR. The value of capture-recapture methods even for apparent exhaustive surveys. Amer J Epid 1992;135:1060–7 [DOI] [PubMed] [Google Scholar]
- 9.Lambert T, Goldacre M, Davidson J, Parkhouse J. Estimation of numbers of British medical graduates working in the National Health Service: comparison of capture-recapture analysis and exhaustive tracing. J Health Serv Res Policy 2004;9:234–6 [DOI] [PubMed] [Google Scholar]
- 10.Goldacre MJ, Davidson JM, Lambert TW. Retention in the British National Health Service of medical graduates trained in Britain: cohort studies. BMJ 2009, doi:10.1136/bmj.b1977 [DOI] [PMC free article] [PubMed] [Google Scholar]
- 11.Goldacre M, Lambert TW, Parkhouse J. Views of doctors in the United Kingdom about their own professional position and the National Health Service reforms. J Public Health Med 1998;20:86–92 [DOI] [PubMed] [Google Scholar]
- 12.Lambert TW, Evans J, Goldacre MJ. Recruitment of UK-trained doctors into general practice: findings from national cohort studies. Brit J Gen Pract 2002;52:364–72 [PMC free article] [PubMed] [Google Scholar]
- 13.Lambert TW, Turner G, Fazel S, Goldacre MJ. Reasons why some UK medical graduates who initially choose psychiatry do not pursue it as a long-term career. Psychol Med 2006;36:679–84 [DOI] [PubMed] [Google Scholar]
- 14.Taylor KS, Lambert TW, Goldacre MJ. Career progression and destinations, comparing men and women in the NHS: postal questionnaire surveys. BMJ 2009, doi: 10.1136/bmj.b1735 [DOI] [PMC free article] [PubMed] [Google Scholar]
- 15.Women and Medicine: the future. Summary of findings from the Royal College of Physicians research. London: Royal College of Physicians; 2009 [Google Scholar]
- 16.Elston MA. Women and Medicine: the future. London: Royal College of Physicians; 2009 [Google Scholar]
- 17.Department of Health Improving working lives for doctors. London: Department of Health; 2001 [Google Scholar]
- 18.Department of Health Reviewing your retirement options: consultant and senior hospital doctors. London: Department of Health; 2005 [Google Scholar]
- 19.Department of Health Reviewing your retirement options: general practitioners. London: Department of Health; 2005 [Google Scholar]
- 20.Chambers R, Mohanna K, Thornett A, Baker M. Changing the culture to support doctors' careers. BMJ 2003;326:193–4 [DOI] [PubMed] [Google Scholar]