Abstract
The combination of magic angle spinning (MAS) with the high-resolution 1H NOESY NMR experiment is an established method for measuring through-space 1H…1H dipolar couplings in biological membranes. The segmental motion of the lipid acyl chains along with the overall rotational diffusion of the lipids provides sufficient motion to average the 1H dipolar interaction to within the range where MAS can be effective. One drawback of the approach is the relatively long NOESY mixing times needed for relaxation processes to generate significant crosspeak intensity. In order to drive magnetization transfer more rapidly, we use solid-state radiofrequency driven dipolar recoupling (RFDR) pulses during the mixing time. We compare the 1H MAS NOESY experiment with a 1H MAS RFDR experiment on dimyristoylphosphocholine, a bilayer forming lipid, and show that the 1H MAS RFDR experiment provides considerably faster magnetization exchange than the standard 1H MAS NOESY experiment. We apply the method to model compounds containing basic and aromatic amino acids bound to membrane bilayers to illustrate the ability to locate the position of aromatic groups that have penetrated to below the level of the lipid headgroups.
1. Introduction
1H Nuclear Overhauser Enhancement Spectroscopy (NOESY) is a standard solution NMR approach used to establish through space contacts, and has been applied to biological membranes under solid-state magic angle spinning (MAS) conditions [1] to determine the location of bound drugs and peptides [2–9]. For solid-state 1H NMR spectra, the MAS frequency typically has to exceed the width of the 1H-1H dipolar interaction to narrow the 1H linewidths. The effectiveness of MAS in reducing 1H linewidths for 1H NOESY experiments of biological membranes is attributed to the high degree of mobility exhibited by membrane lipids. Rapid lateral diffusion averages intermolecular 1H dipolar couplings, while rapid rotational diffusion and conformational flexibility of the acyl chains average intramolecular 1H dipolar couplings. Typical membrane lipids undergo rapid rotational diffusion with correlation times on the order of a few nanoseconds or less and exhibit segmental motions with correlation times of 5–100 picoseconds [4, 10]. Despite the ability to observe the 1H nucleus directly, one of the limitations of the approach for studies of membrane bound peptides has been sensitivity. Two ways of improving sensitivity are to use high molar ratios of peptide-to-lipid and to make measurements using long NOESY mixing times. The drawbacks of these methods, however, are that high peptide concentrations often lead to peptide aggregation or disruption of the local bilayer structure, while long mixing times allow for increased spin diffusion and difficulty in interpreting crosspeak intensities in terms of close 1H…1H contacts.
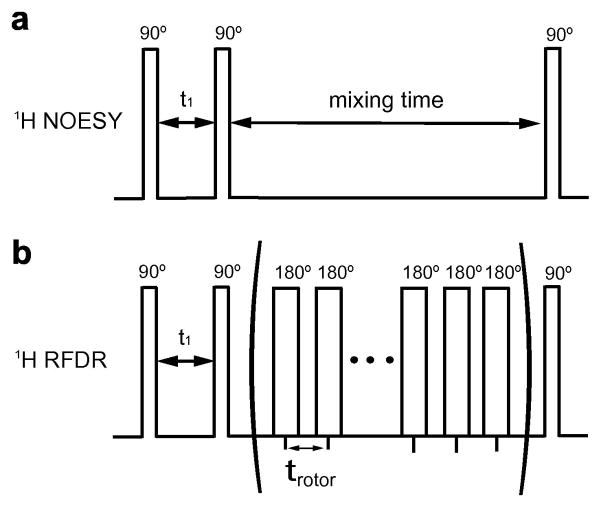
We have been exploring methods to improve the sensitivity in the 1H MAS NOESY experiment in order to work at shorter mixing times where spin diffusion is less of a concern. The approach complements a growing number of NMR-based methods for enhancing sensitivity and determining the location of membrane-bound peptides (e.g. [11, 12]). One mechanism for driving magnetization exchange under solid-state NMR conditions is to use schemes involving the longitudinal exchange of magnetization. Radiofrequency driven dipolar recoupling (RFDR) is perhaps one of the simplest solid-state methods for recoupling the dipolar interaction in the presence of MAS in that it only requires implementing a series of rotor synchronized π-pulses (Fig. 1). Griffin and coworkers [13, 14] have shown that π-pulses generate longitudinal exchange of magnetization during the mixing time. Lipid bilayers are characterized by a unique molecular motional regime that makes it possible to apply both solid-state and solution-state methods together. That is, despite the rapid rotational and lateral diffusion of membrane lipids, the 1H dipolar interaction is not averaged to zero, which allows the application of methods that transfer magnetization via the residual dipolar couplings.
Fig. 1.
1H NOESY and RFDR pulse sequences. The simple NOESY experiment consists of three 90° pulses. In the 1H MAS RFDR experiment, a series of π-pulses are introduced during the mixing time synchronized with the rotor frequency. In both experiments, the first 90° pulse creates transverse magnetization that evolves under the influence of the isotropic chemical shift during the first delay. The second 90° pulse rotates the magnetization back to the z axis. Magnetization exchange takes place during the mixing time.
In this report, we introduce RFDR pulses during the mixing time in a 1H MAS NOESY experiment. This method has previously been applied to observe the conformation of peptides bound to resins [15]; the motional characteristics of resin-bound peptides are similar to the membrane-bound peptides investigated here. We first compare the 1H MAS NOESY experiment with the 1H MAS NOESY-RFDR hybrid experiment (referred to as 1H MAS RFDR) on dimyristoylphosphocholine (DMPC), a model bilayer-forming lipid. The 1H MAS NOESY experiment has been used extensively to study the lateral organization and molecular disorder of lipid membranes [16]. For example, one of the striking results that has emerged from the application of 1H MAS NOESY NMR to pure lipid membranes is the observation of significant contacts between the methyl groups at the ends of the lipid acyl chains and the methyl groups associated with the phosphocholine headgroup [17, 18]. Here, we show that the 1H MAS RFDR experiment provides significantly faster magnetization exchange than the standard 1H MAS NOESY experiment. The shorter mixing times that are possible with the 1H MAS RFDR experiment confirm that the contacts between the terminal methyl groups and the choline headgroup are not due to spin diffusion along the lipid chain [18].
We then compare the ability of the 1H MAS NOESY and RFDR experiments to establish the location of basic-aromatic model compounds bound to DMPC bilayers. Sequence motifs containing basic and aromatic amino acids are increasingly found as a common mechanism that membrane proteins use to disrupt and penetrate membrane bilayers [7, 19], recruit lipids and cholesterol [20], and mediate membrane fusion (e.g. see [21]). We illustrate the differences between the two pulse sequences using the simplest basic-aromatic model system, phenylalanine methyl ester. This model amino acid has an aromatic side chain and a single positively charged amine. We then extend these studies to a nine-residue peptide, Ac-KKKFSFKKK-OMe. The peptide serves as a model of the effector domain of the MARCKS (myristoylated alanine-rich C kinase substrate) protein [22, 23]; the deep penetration of the MARCKS effector domain into membrane bilayers mediates the recruitment of phosphatidylinositol 4,5-bisphosphate (PI(4,5)P2) an important membrane lipid involved in signal transduction [24, 25].
Together the examples show that the 1H MAS NOESY-RFDR hybrid experiment is a useful tool for studying the conformation and location of peptides and small molecules in membrane bilayers. The results confirm that the crosspeaks observed between the terminal methyl groups on the lipid acyl chains and the choline methyl groups on the lipid headgroup are not due to spin diffusion, but result from close contacts reflecting molecular disorder in the liquid crystalline phase lipids. The observation of intense crosspeaks at very short mixing times between the acyl chain protons and the phenylalanine ring in the MARCKS analog confirms that phenylalanine rings can penetrate below the level of the headgroups in membrane bilayers.
2. Materials and Methods
2.1. Materials
1,2-Dimyristoyl-sn-glycero-3-phosphocholine (DMPC), 1,2-dimyristoyl-sn-glycero-3-[phospho-rac-(1-glycerol)] (DMPG) and 1,2-dimyristoyl-D67-sn-glycero-3-phosphocholine (deuterated DMPC) were obtained from Avanti Polar Lipids (Alabaster, AL) and used without further purification. D2O (99.9%) was purchased from Acros Organics (Geel, Belgium). Deuterium depleted H2O was acquired from Cambridge Isotope Laboratory (Andover, MA) and phenylalanine methyl ester was obtained from Sigma (St. Louis, MO).
2.2. Peptide Synthesis and Purification
The peptide Ac-KKKFSFKKK-OMe was synthesized by solid-phase FMOC chemistry and purified by reverse phase HPLC (Varian Prostar) on a C4 column with an acetonitrile-water gradient and lyophilized. The solvents contained 0.1% (w/v) trifluoroacetic acid. The purity was confirmed with MALDI mass spectrometry and analytical HPLC.
2.3. Membrane Peptide Reconstitution
DMPC and DMPG were co-dissolved in cyclohexane and lyophilized. The lyophilized lipids were hydrated (H2O) with 5 mM phosphate or 20 mM HEPES buffer, 50 mM NaCl (pH 7.0) and briefly bath sonicated. The resulting multilamellar dispersions were vortexed and incubated for 30 min, and then extruded through a 100 nm polycarbonate membrane 11 times at 40°C to form large unilamellar vesicles (LUVs). After the extrusion, the samples were centrifuged at 265,000 × g for 1 h at 4°C. For the preparation of samples having phenylalanine methyl ester or Ac-KKKFSFKKK-OMe bound to DMPC:DMPG membranes, the aromatic model compounds were added to the LUVs prior to centrifugation at a 1:10 or 1:20 molar ratio, respectively. The higher molar ratio of phenylalanine methyl ester to lipid compensated for its weaker binding to the DMPC:PG vesicles compared to the Ac-KKKFSFKKK-OMe peptide. The hydrated pellets were lyophilized, rehydrated with D2O (60 wt%) and incubated overnight at 37°C.
2.4. NMR Spectroscopy
The NMR experiments were performed on a Bruker spectrometer operating at a 1H Larmor frequency of 700 MHz using a 2.5 mm MAS probe. The typical RF field strength is about 80 kHz for protons. All experiments were carried out at a temperature of 303.0 K or 310.0 K ± 0.5 K and at a MAS spinning rate of 6 kHz or 7 kHz for one-dimensional proton measurements and 1H NOESY experiments. 128 scans were collected for each experiment for 1D 1H measurements. The 1H MAS NOESY and RFDR were acquired in a phase sensitive mode using the TPPI method. A total of 1024 increments, each with 16 scans were collected for 1H MAS NOESY and RFDR. A series of 16 dummy scans at the beginning of each experiment were used to establish steady state. A repetition delay of 2 s was used in all experiments.
3. Results
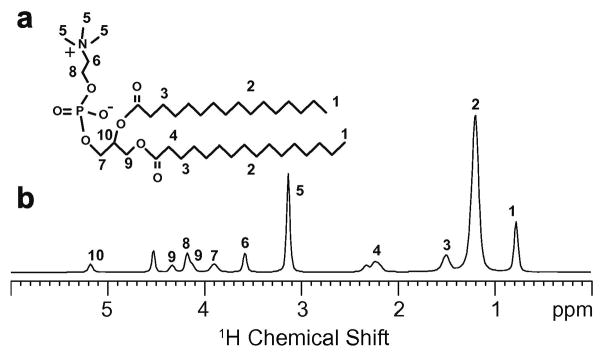
Fig. 2 shows the chemical structure of DMPC along with the 1H NMR spectrum obtained using MAS at a 6 KHz spinning rate. The phospholipid headgroup is formed by the negatively charged phosphate and positively charged choline functional groups. Choline is comprised of two methylene groups (protons 8 and 6) and three methyl groups (protons 5) attached to a quaternary nitrogen. The glycerol backbone of DMPC (protons 7, 9 and 10) is the anchor point for the phosphocholine headgroup and two 14-carbon acyl chains (protons 1–4).
Fig. 2.
Molecular structure (a) and 1H MAS spectrum (b) of DMPC. The assignments of the resonances to specific protons of DMPC are indicated [1, 30].
Lipid molecules are highly mobile. Correlation times for gauche/trans isomerization of the lipid acyl chains are on the order of 50–100 ps, while correlation times for molecular rotation are on the order of 1–2 ns [4]. Lipid lateral diffusion is on a longer time scale (170 ns) and was found to be the major contributor to intermolecular relaxation [26, 28]. It is important to note that the correlation times modulate magnetization exchange. The observation that lateral diffusion dominates the relaxation mechanism suggests that crosspeaks associated with intermolecular contacts in the 1H MAS NOESY experiment correspond to contact probabilities between protons [16].
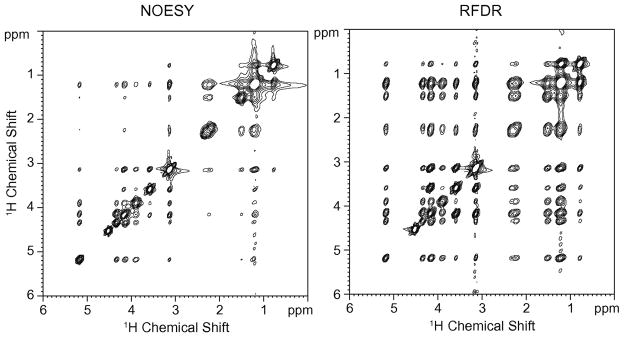
Fig. 3 presents 2D NOESY and RFDR spectra of DMPC hydrated with D2O. The mixing time is 50 ms for both spectra. A prominent difference between these two spectra is the presence of stronger crosspeaks obtained using the RFDR pulse sequence. As discussed below, the rotor-synchronized π-pulses drive magnetization exchange through the dipolar coupling (~ 1/r3) faster than relaxation via the nuclear Overhauser effect (~ 1/r6), and consequently the crosspeaks buildup at a much faster rate using the RFDR sequence.
Fig. 3.
Comparison of 2D 1H MAS NOESY (left) and RFDR (right) spectra of DMPC bilayers. The spectra were obtained using a mixing time of 50 msec. The DMPC sample was hydrated with D2O. The MAS frequency was 7 kHz.
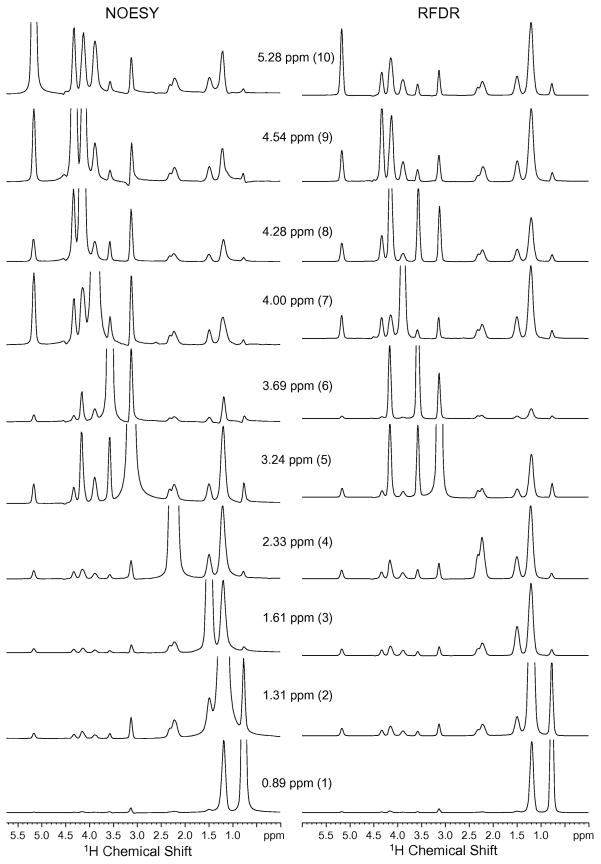
Fig. 4 presents rows from the 2D spectra in Fig. 3 taken through the lipid diagonal resonances. Three regions in the lipid structure can be distinguished: the acyl chains (protons 1–4 in Fig. 2), phosphocholine headgroup (protons 5, 6 and 8) and glycerol backbone (protons 7, 9 and 10). In both the NOESY and RFDR spectra, the crosspeaks between protons within the same region are generally stronger than crosspeaks between protons in different regions. Nevertheless, there are several significant differences in the crosspeak intensities observed in the NOESY and RFDR as discussed below.
Fig. 4.
Comparison of crosspeak intensities from 2D 1H MAS NOESY (left column) and RFDR (right column) spectra of DMPC. Rows are shown from the 2D spectra in Fig. 3. The spectra were obtained using a mixing time of 50 msec. The MAS frequency was 7 kHz.
The acyl chain proton resonances (peaks 1–4) exhibit the simplest crosspeak pattern in both the NOESY and RFDR spectra. The terminal methyl protons (peak 1) show predominately a crosspeak to the acyl chain methylene protons (peak 2). A small crosspeak is observed with the choline methyl protons at 3.24 ppm (peak 5). Huster and Gawrish [18] have shown that this is a through-space contact in the NOESY experiment, i.e. the crosspeak intensity is not due to spin diffusion along the acyl chain. The RFDR experiment yields roughly the same crosspeak intensity between the terminal methyl protons and the choline methyl protons consistent with the idea that the crosspeak arises from a close (although rare) intermolecular contact between lipids rather than from spin diffusion within a single lipid.
The acyl chain methylene protons (peak 2) yield the most intense resonance in the 1H MAS spectra of DMPC. Comparison of the NOESY and RFDR spectra shows that the crosspeak associated with the terminal methyl protons is the strongest and has the same relative intensity in both spectra. The difference in resolution in the row through the diagonal resonance at 1.3 ppm (peak 2) results from a significant reduction of the diagonal intensity for the RFDR spectrum (see below). This loss of diagonal intensity is clearly seen in the row through the acyl chain protons associate with peak 3 at 1.6 ppm. In this case, the crosspeak with the acyl chain protons at 1.3 ppm (peak 2) is actually more intense than the 1.6 ppm diagonal resonance. The RFDR pulse sequence appears to be able to rapidly drive magnetization down the lipid acyl chain.
For the choline functional group (protons 5, 6 and 8), the major crosspeaks in the RFDR spectra are with the neighboring protons. For example, in the row through the diagonal resonance of the choline methyl protons (peak 5), the crosspeaks to the methylene proton resonances (peaks 6 and 8) have roughly the same intensity and are more intense than the crosspeaks to any other resonance. In contrast, the crosspeak pattern for the choline protons in the NOESY spectra is not as simple. For example, the most intense crosspeak in the row through the diagonal resonance for the choline methyl protons is associated with the acyl chain protons (peak 2). This comparison between the NOESY and RFDR experiments highlights the conclusion from Huster and Gawrisch [18] that the intensity in the NOESY experiment comes from intermolecular cross relaxation. In contrast, much of the magnetization of the choline methyl protons appears to remain in the choline moiety, which is separated from the rest of the lipid chain protons by the lipid phosphate group.
For the glycerol protons (7, 9 and 10), the distribution of crosspeak intensity for both the NOESY and RFDR experiments is relatively complex. There is significant intensity in many resonances that correspond to protons that are not adjacent in the lipid structure. For example, in the RFDR spectra the most intense crosspeak in the rows through the glycerol diagonal resonances is associated with the acyl chain protons (peak 2) suggesting that a mixing time of 50 msec is sufficient to drive much of the magnetization away from the glycerol backbone.
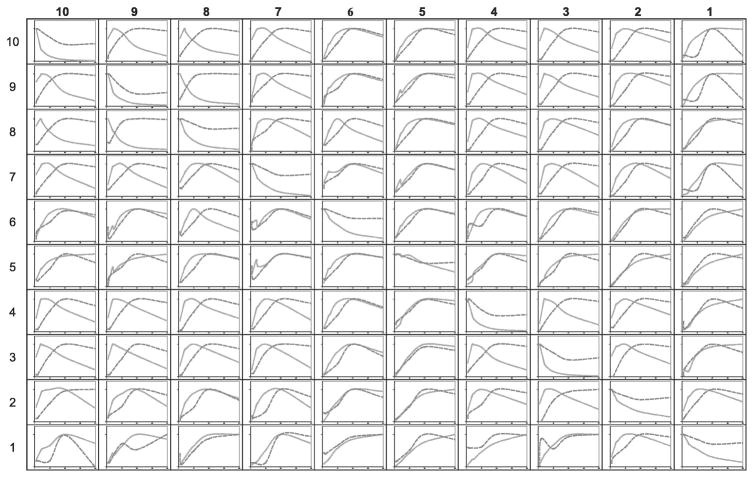
In order to address the intensity differences observed between the NOESY and RFDR experiments, we present the buildup curves using both the NOESY and RFDR experiments in Fig. 5. Huster et al. [27] have reported a similar set of build-up curves for the NOESY experiment. Overall, two features of the curves are apparent. First, the cross peak intensities for the RFDR experiment build up more quickly and the diagonal intensity decays more quickly than in the NOESY experiment. Second, there is more variation in the buildup rates and decays for the RFDR curves than for the NOESY curves.
Fig. 5.
Buildup of crosspeak intensity of DMPC bilayers in the 1H MAS NOESY (dashed line) and RFDR (solid-line) experiments. The intensities are normalized to 1 and plotted as a function of the mixing time from 0 to 200 msec.
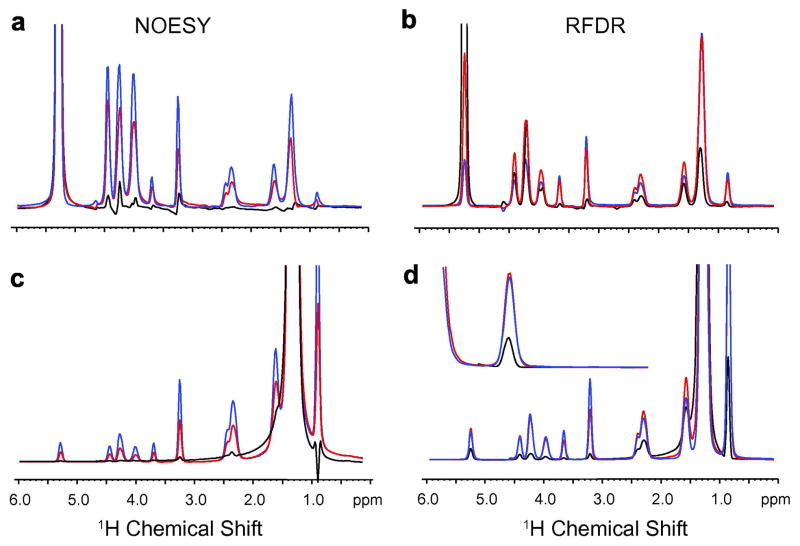
Fig. 6 emphasizes these points by presenting rows through the 2D NOESY and RFDR spectra for different mixing times. Fig. 6a presents the row through the diagonal resonance of peak 10, corresponding to the proton on the C2 carbon of the glycerol backbone, at mixing times of 5 msec (black), 50 msec (red) and 100 msec (blue). In the NOESY experiment, there is no significant intensity in crosspeaks associated with this diagonal resonance at the short mixing time of 5 msec. At 50 msec, the intensity for each crosspeak has increased significantly and is ~70–80% of the intensity at 100 msec. For all of the crosspeaks, the buildup rates are roughly the same.
Fig. 6.
Dependence of crosspeak intensity on mixing time for the 1H MAS NOESY and 1H MAS RFDR experiments. For the NOESY experiment, rows are shown through peak 10 (a) and peak 2 (c) for mixing times of 5 (black), 50 (red) and 100 (blue) msecs. The corresponding rows are shown for the RFDR experiment in (b) and (d). The inset corresponds to the crosspeak at 0.89 ppm.
In contrast, the rates at which crosspeaks buildup intensity in the RFDR experiment are very different (Fig. 6b). The fastest rates are associated with the adjacent protons (peaks 7 and 9) on the glycerol backbone. In the case of peak 9 (which overlaps with peak 8 at 4.28 ppm), the intensity obtained with a mixing time of 5 msec is equal to the intensity at 50 msec; the intensity has already decayed significantly at the 100 msec mixing time. The slowest build-up rates are observed for the crosspeaks associated with the choline methyl protons (peak 5) and the terminal methyl protons (peak 1). These protons are at the two extreme ends of DMPC. However, from the spectra in Fig. 6b it is clear that already at 50 msec the RFDR pulse sequence is able to transfer significant magnetization from the glycerol protons to the acyl chain. (Note that the crosspeaks associated with the acyl chain protons near the glycerol backbone, peaks 3 and 4, build up intensity more rapidly than the acyl chain protons associated with peak 2 or peak 1.)
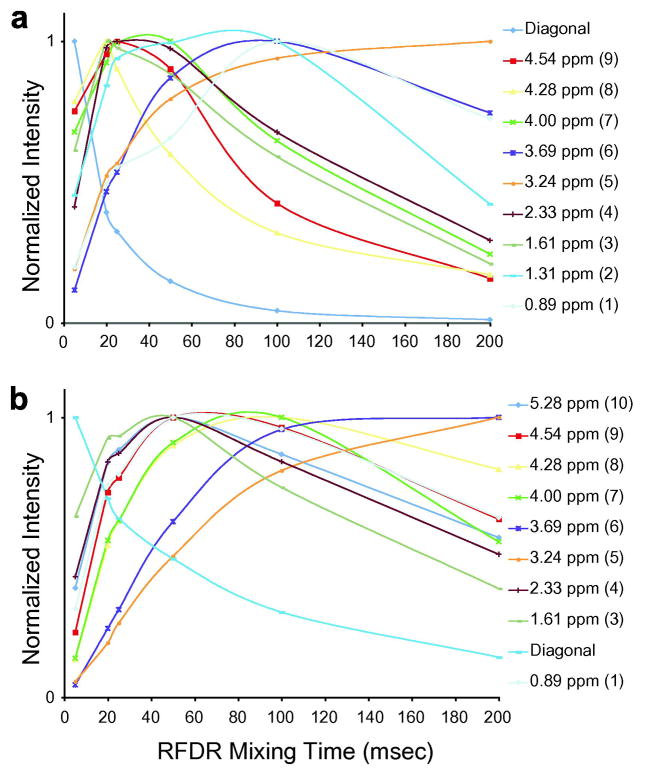
Fig. 7a presents the decay curve for the diagonal resonance of peak 10 in the RDFR experiment along with the build-up curves for each of its associated crosspeaks between 0 and 200 msec. These curves clearly show that crosspeaks associated with the resonances of the nearby protons (e.g. peaks 7 and 9) begin to decay before the crosspeak intensity associated with the more distant protons (e.g. peaks 1 and 5) reaches a maximum.
Fig. 7.
Buildup of crosspeak intensity in the RFDR experiment for the glycerol proton at 5.28 ppm (a) and the acyl chain protons at 1.3 ppm (b). The buildup curves are shown for mixing times from 0–200 msecs.
Fig. 6c presents rows through the diagonal resonance of the acyl chain protons (peak 2) in the NOESY spectrum. As above, the build-up rates are similar for all crosspeaks and do not depend on the intramolecular distance. As shown by Huster and Gawrisch [18], crosspeaks corresponding to intermolecular contacts dominate in 1H MAS NOESY spectra of lipids. For each crosspeak, the intensity obtained with a 50 msec mixing time is roughly half of the intensity at 100 msec. In contrast, in the RFDR experiment (Fig. 6D) the crosspeaks with the most rapid build of intensity correspond to other protons in the acyl chain (i.e. peaks 1, 3 and 4). The crosspeak with the slowest buildup corresponds to the choline methyl protons, which are the most distant.
Comparison of the absolute crosspeak intensities in the NOESY experiment shows that the most intense crosspeaks arise with the acyl chain diagonal resonance (see for example Figures 3 and 4 in ref [27]). The large intensity is attributed to the intense diagonal resonance (i.e. there are 44 protons in the two acyl chains of DMPC that resonate at this position). For example, in the NOESY experiment there is a large crosspeak between the resonances associated with the acyl chain protons (peak 2) and choline methyl protons (peak 5). In the RFDR experiment, a similar overall pattern is observed. However, there is less of a difference between the acyl chain crosspeak intensities and other crosspeaks in the 2D spectrum. The similarity is best appreciated by comparing the NOESY and RFDR spectra in Fig. 3.
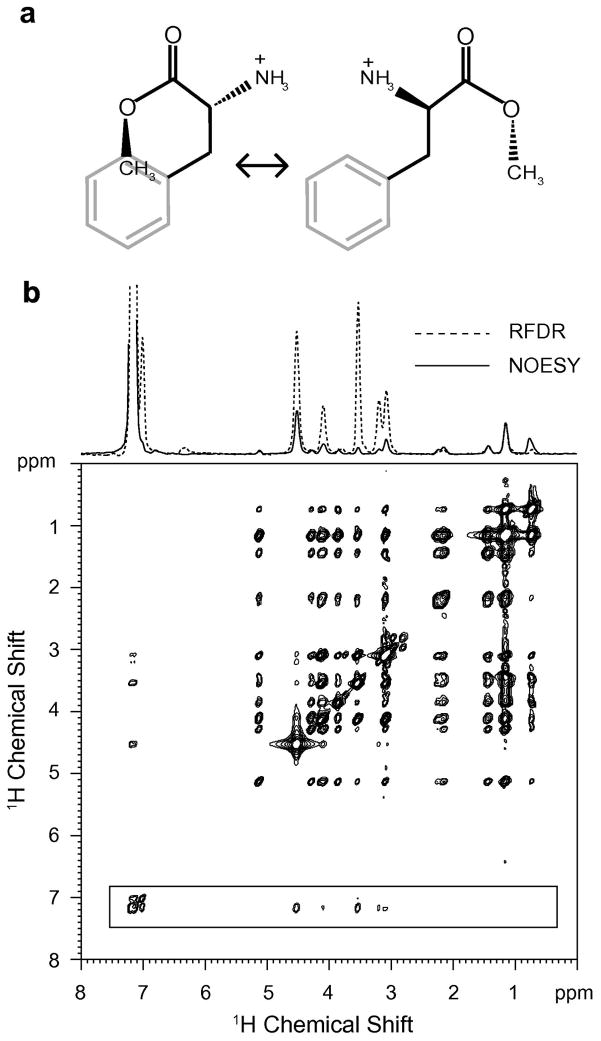
One motivation for exploring the use of RFDR instead of the 1H MAS NOESY experiment is to establish the closest intermolecular contacts between small molecules and lipids. Fig. 8 shows the 2D 1H MAS RFDR spectrum of phenylalanine methyl ester bound to DMPC:DMPG bilayers. DMPG has a negatively charged lipid headgroup that facilitates binding of the positively charged aromatic model compound. The RFDR spectrum overall has stronger crosspeak intensities than the NOESY experiment for the same mixing time (data not shown). At the top of the 2D spectrum, we present rows through the aromatic diagonal resonance of the 1H MAS NOESY (red) and the 1H MAS RFDR (black) spectra. The strong crosspeaks with the aromatic protons can be assigned to the α-protons (4.10 ppm), β-protons (3.21/3.08 ppm) and the CH3 protons (3.53 ppm) of phenylalanine methyl ester on the basis of model compound chemical shifts and from the loss of the crosspeak at 3.53 ppm when the methyl protons of the methyl ester are substituted with deuterium (data not shown). The strong CH3 to aromatic crosspeak intensity suggests that the methyl group on the phenylalanine methyl ester bends around and packs on the ring when the phenylalanine methyl ester binds to membrane bilayers (see Fig. 8a).
Fig. 8.
Molecular structure (a) and comparison of 1H MAS NOESY and 1H MAS RFDR spectra (b) of phenylalanine methyl ester bound to DMPC:DMPG bilayers. The 2D 1H MAS RFDR spectrum obtained with a 50 msec mixing time is shown. Above the spectrum are rows obtained through the aromatic protons of the phenylalanine ring comparing 1H MAS NOESY (solid line) with 1H MAS RFDR (dashed line) for the same mixing time and number of scans. For these experiments, the DMPC:DMPG molar ratio was 10:3 and the molar ratio of total lipid to phenylalanine methyl ester was 10:1.
This comparison illustrates two aspects of the 1H MAS RFDR experiment. First, there is considerably greater intensity for intramolecular crosspeaks in the RFDR than in the NOESY experiment. Second, the intermolecular lipid-protein crosspeaks obtained with a 50 msec mixing time show roughly the same intensity in the two experiments. For example, the intensity of the crosspeak at 1.3 ppm between the phenylalanine ring proton resonance and lipid acyl chain resonance (peak 2) is similar in the NOESY and RFDR spectra at 50 msec. The similar intensities indicate that the motion of the lipids and phenylalanine methyl ester does not enhance the intramolecular correlations at the expense of the intermolecular correlations.
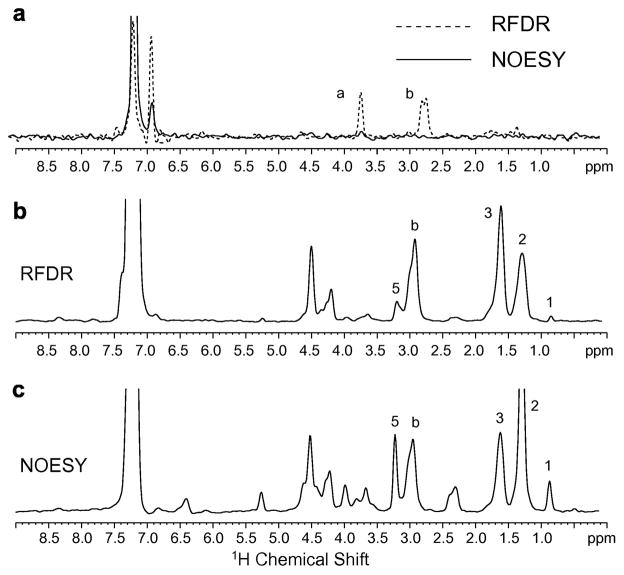
In order to determine if the intensity of the crosspeaks corresponding to intramolecular contacts in phenylalanine methyl ester are enhanced in membrane-bound peptides, we extended these studies to a 9-residue peptide that mimics the effector domain of the MARCKS protein. Fig. 9a presents rows of the 2D 1H MAS NOESY and 1H MAS RFDR spectra of the peptide Ac-KKKFSFKKK-OMe in fully deuterated DMPC (D67). The peptide-to-lipid molar ratio was 1:20. A comparison of the rows through the diagonal resonance of the aromatic phenylalanine ring protons between the 1H MAS NOESY (solid lines) with 1H MAS RFDR (dashed lines) spectra shows that the intensity of the intramolecular crosspeaks between the ring protons and the Cα-H and CβH protons of phenylalanine is dramatically enhanced.
Fig. 9.
Comparison of 1H MAS NOESY and 1H MAS RFDR spectra of Ac-KKKFSFKKK-OMe. (a) Peptide bound to deuterated (D67) DMPC bilayers. Rows through the diagonal resonance of the aromatic phenylalanine ring proton resonance at 7.11 ppm are shown comparing 1H MAS NOESY (solid line) with 1H MAS RFDR (dashed line) for the same mixing time (50 msec) and number of scans. The intramolecular crosspeaks to the Cα-H and CβH protons of phenylalanine dominate the 1H MAS RFDR spectrum. The peptide-to-lipid molar ratio was 1:20. (b) Peptide bound to DMPC:DMPG bilayers using 1H MAS RFDR with a mixing time of 50 msec. The row through the diagonal resonance of the aromatic phenylalanine ring protons at 7.11 ppm shows the correlations to the lipid protons. (c) Peptide bound to DMPC:DMPG bilayers using 1H MAS NOESY with a mixing time of 300 ms. The same row as in (b) is shown through the diagonal resonance of the aromatic phenylalanine ring protons at 7.11 ppm.
In Fig. 9b, we present the row through the diagonal resonance of the aromatic phenylalanine ring protons at 7.11 ppm of the 1H MAS RFDR spectrum using the same mixing time of 50 msec. In this case, the lipids are protonated. There are several striking features of the RFDR spectrum of Ac-KKKFSFKKK-OMe bound to protonated lipids compared to the spectrum of phenylalanine methyl ester reconstituted with lipids in the same fashion. First, crosspeaks arising from intramolecular transfer do not dominate the spectrum of Ac-KKKFSFKKK-OMe. We assign the peak at ~3.0 ppm to the phenylalanine β-protons and the peak at 4.2 ppm to the α protons. (These frequencies match the chemical shifts observed in phenylalanine methyl ester, although are slightly shifted compared to those observed in the experiments using deuterated lipids. The origin of this difference has not been determined.) Second, there is significant intermolecular exchange between the acyl chain protons (peaks 2 and 3) with the aromatic phenylalanine ring. The observation of intense crosspeaks to the acyl chain protons indicate that the ring is inserting into the acyl chain region of the bilayer. The relative intensities of the α, β and acyl chain crosspeaks compared to those in phenylalanine methyl ester (see Fig. 8b) suggest that the Ac-KKKFSFKKK-OMe peptide is more tightly bound and consequently magnetization transfer to the lipids is more efficient.
In Fig. 9c, we present the same row as in Fig. 9b for the 1H MAS NOESY experiment. The 2D spectrum was obtained with a 300 msec mixing time. The longer mixing time for the NOESY experiment provides roughly the same sensitivity as the 50 msec mixing time for RFDR experiment. In this case, the most intense crosspeak corresponds to the lipid acyl chain protons (peak 2 at 1.3 ppm). In contrast to the 1H MAS RFDR spectrum, there is observable crosspeak intensity with all of the other protons in the lipid with approximately the same intensity. Also, the intramolecular crosspeaks to the α- and β-carbons of the phenylalanine ring have comparable intensity to, for example, the choline methyl protons, indicating that intermolecular magnetization exchange is favored over intramolecular exchange.
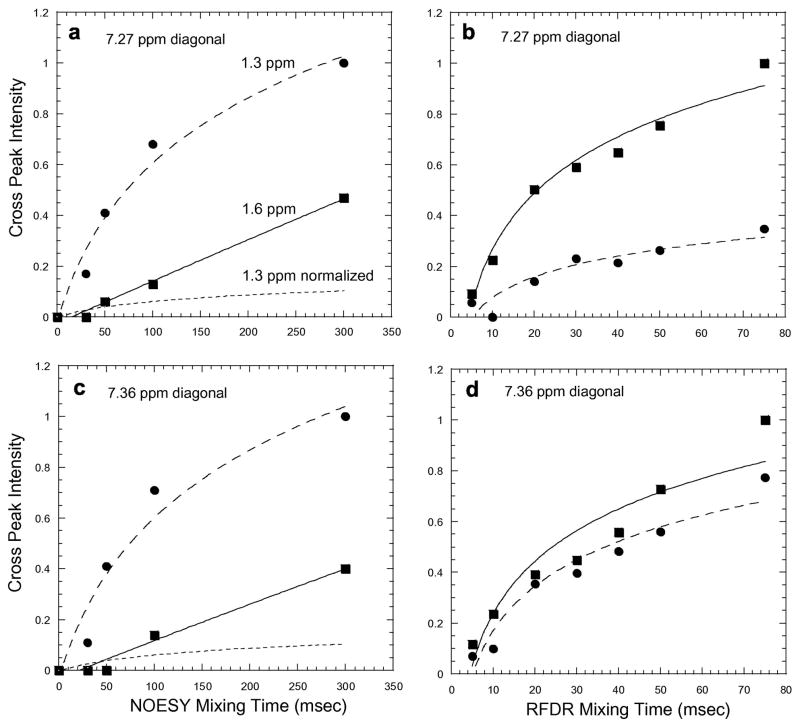
The difference in the relative intensity of the 1.3 and 1.6 ppm crosspeaks between the 1H MAS NOESY and 1H MAS RFDR experiments is not due to the difference in mixing time. Fig. 10 presents the buildup curves for these two resonances in the two experiments. In the RFDR experiment, the 1.6 ppm crosspeak builds up rapidly in intensity and is greater for all mixing times measured. The relative intensity is reversed in the 1H MAS NOESY experiment.
Fig. 10.
Buildup of crosspeak intensity in the 1H MAS NOESY (a,c) and RFDR (b,d) experiments for the acyl chain protons at 1.3 ppm (dashed line, circles) and 1.6 ppm (solid line, squares). The error in the measurement of crosspeak intensity due to noise in the 2D spectra is represented by size of the symbols (circles, squares). The noise and corresponding error is the same at all mixing times. Normalization of the NOESY crosspeak intensities in Figs. 10a and 10c is indicated by dashed black lines.
In Fig. 10, we present the buildup curves for both the 7.27 ppm and 7.36 ppm diagonal resonances, which are assigned to the δ and ε protons of the phenylalanine ring, respectively, on the basis of their crosspeak intensities with the β-protons and standard ring chemical shifts. The more rapid buildup of crosspeak intensity at 1.6 ppm vs. 1.3 ppm for the 7.27 ppm diagonal resonance argues that the δ-protons of the phenylalanine ring are in closer proximity to the C3 protons than to the C4–C13 protons of the acyl chain.
4. Discussion
The combination of MAS and the NOESY NMR experiment for measuring 1H…1H through space correlations provides a high-resolution method for determining the structure and location of small molecules and peptides in membrane bilayers. We have extended this technique with the introduction of an RFDR train of pulses during the mixing period in order to significantly increase the rate of magnetization exchange between neighboring protons. The method enhances the sensitivity at shorter mixing times and increases the intensity of intramolecular correlations in membrane systems.
The ability to more rapidly drive magnetization exchange allows one to distinguish the pathways of magnetization transfer in lipid bilayers. The NOESY experiment favors the intermolecular magnetization transfer, while the RFDR experiment favors intramolecular transfer with neighboring protons. Huster and Gawrisch have demonstrated that lipid lateral diffusion is the major contributor to intermolecular relaxation in the 1H MAS NOESY experiment in membrane bilayers [26, 28]. As a result, the crosspeaks correspond to contact probabilities between protons, predominantly on neighboring lipids. The difference between the 1H MAS NOESY and RFDR methods is very clearly seen in comparison of the crosspeaks associated with the diagonal resonance of the choline methyl protons (peak 5). In the RFDR experiment, the crosspeaks between the choline methyl and choline methylene resonances (peaks 6 and 8) are roughly the same intensity and are more intense than the crosspeaks to any other resonance. The choline methyl and methylene protons are nearest neighbors. In contrast, in the NOESY experiment the most intense crosspeak in the row through the choline methyl diagonal resonance is associated with the acyl chain protons (peak 2). The observation of the intense crosspeak between the choline methyl and acyl chain protons has important implications for bilayer structure and disorder, which are often not fully appreciated, except through NMR and MD simulations. In x-ray and deuteron diffraction studies of fluid membrane bilayers, although the fluid bilayers are disordered, the terminal methyl group is found to have a relatively narrow Gaussian distribution about the center of the bilayer [29]. The apparent discrepancy stems from the ability of the NMR experiments to detect the relatively rare, but close, contacts between the choline methyl and acyl chain protons.
The observation of the strong intramolecular contacts in phenylalanine methyl ester as seen in Fig. 8 is striking. First, the difference in the phenylalanine methyl ester crosspeaks indicates that the NOESY and RFDR experiments provide complementary information and together can be used in favorable cases to distinguish intramolecular and intermolecular contacts. However, more importantly it indicates that for small molecules bound to membranes, the 1H MAS RFDR experiment provides a method for establishing small molecule structure. For example, the observation of the intense crosspeak between the methyl ester protons and the protons on the aromatic phenyalanine ring corresponds to through-space magnetization transfer. The intensity argues for a conformation similar to that shown in Fig. 8a (left) where the methyl ester is in close proximity to the aromatic ring.
We demonstrate the ability of the 1H MAS RFDR experiment to characterize the membrane location of sequence motifs comprised of basic and aromatic amino acids. These motifs occur widely in transmembrane and membrane-associated proteins. The first striking comparison is between the 1H MAS NOESY and RFDR spectra of the Ac-KKKFSFKKK-OMe peptide in deuterated lipids (Fig. 9a). The 1H MAS RFDR experiment results in considerable intensity between the ring protons and the CαH and CβH protons of phenylalanine compared to the 1H MAS NOESY experiment. The same enhancement of intramolecular magnetization transfer in the RFDR experiment was observed for phenylalanine methyl ester (Fig. 8). The lack of intramolecular magnetization transfer in the 1H MAS NOESY spectrum reinforces the observation that this experiment favors intermolecular cross relaxation. Importantly, the strong intensity in the intramolecular crosspeaks relative to the intermolecular crosspeaks that was observed for the small phenylalanine methyl ester model compound in the RFDR experiment is not observed for the longer Ac-KKKFSFKKK-OMe peptide. This difference suggests that magnetization transfer is faster from the phenylalanine ring protons to the lipid protons than to the CβH protons in the Ac-KKKFSFKKK-OMe peptide. In addition, the crosspeak between the phenylalanine ring protons and the CαH protons is much less intense than that between the ring protons and the CβH protons, indicating that magnetization flows toward the lipid protons rather than remaining within the peptide.
The most intense crosspeak in Fig. 9b corresponds to the methylene protons on the C3 carbon of the acyl chain. The assignment of this crosspeak is reinforced by the absence of this peak in the spectra obtained using deuterated lipids (i.e. it must be a aromatic ring – lipid contact). Intriguingly, the intensity of the crosspeak associated with the methylene protons on the C2 carbon of the lipid acyl chain is weak, while the intensity of the crosspeak associated with the other methylene protons (peak 2) is relatively strong. These intensities argue for a direct contact between the ring and the C3H protons, and suggest that there is a lipid conformation that places the aromatic ring closer to C3H protons than to the C2H protons. The buildup curves in Fig. 10 indicate that the magnetization does not rapidly diffuse into the lipid acyl chain protons.
In contrast to the 1H MAS RFDR spectrum, in the 1H MAS NOESY spectrum the row through the aromatic ring diagonal exhibits crosspeaks to many of the other resonances in the lipid molecule, and the most intense crosspeak is with the lipid acyl chain resonance at 1.3 ppm. The spectrum in Fig. 9c was obtained using a 300 msec mixing time. However, the relative crosspeak intensities do not significantly change as a function of mixing time (Fig. 10). Long mixing times (≫ 50 msec) are often used to obtain 1H MAS NOESY spectra of membrane bound peptides to increase the intensity of the crosspeaks.
The differences between the NOESY and RFDR experiments provide insights into how to interpret the crosspeak intensity in terms of through space contacts. Crosspeak intensities in the 1H MAS NOESY experiment are often normalized by the intensity of the diagonal resonance (i.e. by the number of protons with the same chemical shift) [27] in order to account for distant (but abundant) protons contributing to cross relaxation. Normalization of the NOESY crosspeak intensities in Figs. 10a and 10c (indicated by dashed black lines) yields buildup curves for the 1H MAS NOESY experiment that more closely match the trends observed in the 1H MAS RFDR experiment. For example, the normalized rate of buildup of the 1.3 ppm crosspeak is now less than the buildup rate for the 1.6 ppm crosspeak in the 1H MAS NOESY experiment. These comparisons provide support for the idea that distant protons can contribute to the NOESY crosspeak intensities. However, the lack of quantitative agreement for the 7.27 ppm and 7.36 ppm resonances suggests the normalization might be different depending on the depth of the aromatic ring in the bilayer.
The comparisons in Fig. 9 and 10 provide support for the use of the crosspeak intensities in the RFDR spectrum (without normalization) as a way to measure the closest contacts between protons. These results suggest that the aromatic rings of phenylalanine in the Ac-KKKFSFKKK-OMe peptide are inserted at the level of the C3 carbon of the acyl chain and relatively well localized in the bilayer. If this is the case, the increased intensity of the crosspeaks in the NOESY spectra corresponding to more distant lipid protons (e.g. peaks 1 and 10 in Figs. 9b, 9c) suggests that there is a larger contribution from spin diffusion in the NOESY experiment than in the RFDR experiment.
Finally, the analysis of the crosspeak intensities indicate that the aromatic ring of both phenylalanine methyl ester and the Ac-KKKFSFKKK-OMe peptide are at or below the level of the acyl chain carbonyls. We are in the process of comparing these results with those of basic and aromatic peptides containing tryptophan and tyrosine to address how different aromatic side chains partition into the lipid bilayer.
Acknowledgments
We gratefully acknowledge the W.M. Keck Foundation for support of the NMR facilities in the Center of Structural Biology at Stony Brook. This work was supported by instrumentation grants from the NIH and NSF (S10 RR13889 and DBI-9977553), and research grants from the National Institutes of Health (GM-46732 and GM-06965) and Japanese Ministry of Education.
Abbreviations
- DMPC
1,2-dimyristoyl-sn-glycero-3-phosphocholine
- DMPG
1,2-dimyristoyl-sn-glycero-3-[phospho-rac-(1-glycerol)]
- HEPES
2-[4-(2-hydroxyethyl)-1-piperazinyl]-ethanesulfonic acid
- LUV
large unilamellar vesicle
- MARCKS
myristoylated alanine-rich C kinase substrate
- MAS
magic angle spinning
- NOESY
nuclear Overhauser effect spectroscopy
- PC
phosphocholine
- RFDR
radiofrequency driven dipolar recoupling
- TMS
tetramethylsilane
- MALDI
matrix-assisted laser desorption/ionization
Footnotes
Publisher's Disclaimer: This is a PDF file of an unedited manuscript that has been accepted for publication. As a service to our customers we are providing this early version of the manuscript. The manuscript will undergo copyediting, typesetting, and review of the resulting proof before it is published in its final citable form. Please note that during the production process errors may be discovered which could affect the content, and all legal disclaimers that apply to the journal pertain.
References
- 1.Oldfield E, Bowers JL, Forbes J. High-resolution proton and carbon-13 NMR of membranes: why sonicate? Biochemistry. 1987;26:6919–6923. doi: 10.1021/bi00396a009. [DOI] [PubMed] [Google Scholar]
- 2.Holte LL, Gawrisch K. Determining ethanol distribution in phospholipid multilayers with MAS-NOESY spectra. Biochemistry. 1997;36:4669–4674. doi: 10.1021/bi9626416. [DOI] [PubMed] [Google Scholar]
- 3.Yau WM, Wimley WC, Gawrisch K, White SH. The preference of tryptophan for membrane interfaces. Biochemistry. 1998;37:14713–14718. doi: 10.1021/bi980809c. [DOI] [PubMed] [Google Scholar]
- 4.Davis JH, Auger M, Hodges RS. High resolution 1H nuclear magnetic resonance of a transmembrane peptide. Biophys J. 1995;69:1917–1932. doi: 10.1016/S0006-3495(95)80062-7. [DOI] [PMC free article] [PubMed] [Google Scholar]
- 5.Bouchard M, Davis JH, Auger M. High-speed magic angle spinning solid-state 1H nuclear magnetic resonance study of the conformation of gramicidin A in lipid bilayers. Biophys J. 1995;69:1933–1938. doi: 10.1016/S0006-3495(95)80063-9. [DOI] [PMC free article] [PubMed] [Google Scholar]
- 6.Huster D, Kuhn K, Kadereit D, Waldmann H, Arnold K. H-1 high-resolution magic angle spinning NMR spectroscopy for the investigation of a Ras lipopeptide in a lipid membrane. Angew Chem Int Ed. 2001;40:1056–1058. doi: 10.1002/1521-3773(20010316)40:6<1056::aid-anie10560>3.0.co;2-7. [DOI] [PubMed] [Google Scholar]
- 7.Zhang W, Crocker E, McLaughlin S, Smith SO. Binding of peptides with basic and aromatic residues to bilayer membranes: phenylalanine in the myristoylated alanine-rich C kinase substrate effector domain penetrates into the hydrophobic core of the bilayer. J Biol Chem. 2003;278:21459–21466. doi: 10.1074/jbc.M301652200. [DOI] [PubMed] [Google Scholar]
- 8.LeGuerneve C, Seigneuret M. High-resolution mono- and multidimensional magic angle spinning 1H nuclear magnetic resonance of membrane peptides in nondeuterated lipid membranes and H2O. Biophys J. 1996;71:2633–2644. doi: 10.1016/S0006-3495(96)79455-9. [DOI] [PMC free article] [PubMed] [Google Scholar]
- 9.Kumashiro KK, Schmidt-Rohr K, Murphy OJ, Ouellette KL, Cramer WA, Thompson LK. A novel tool for probing membrane protein structure: solid- state NMR with proton spin diffusion and X-nucleus detection. J Am Chem Soc. 1998;120:5043–5051. [Google Scholar]
- 10.Brown M. Membrane structure and dynamics studied with NMR spectroscopy. In: Merz KM, Raux B, editors. Biological Membranes. A Molecular Perspective from Computation and Experiment. Birkhauser; Boston: 1996. pp. 175–252. [Google Scholar]
- 11.Dvinskikh SV, Yamamoto K, Durr UHN, Ramamoorthy A. Sensitivity and resolution enhancement in solid-state NMR spectroscopy of bicelles. J Magn Reson. 2007;184:228–235. doi: 10.1016/j.jmr.2006.10.004. [DOI] [PMC free article] [PubMed] [Google Scholar]
- 12.Su Y, Mani R, Hong M. Asymmetric insertion of membrane proteins in lipid bilayers by solid-state NMR paramagnetic relaxation enhancement: a cell-penetrating peptide example. J Am Chem Soc. 2008;130:8856–8864. doi: 10.1021/ja802383t. [DOI] [PMC free article] [PubMed] [Google Scholar]
- 13.Sodickson DK, Levitt MH, Vega S, Griffin RG. Broad-band dipolar recoupling in the nuclear-magnetic-resonance of rotating solids. J Chem Phys. 1993;98:6742–6748. [Google Scholar]
- 14.Bennett AE, Ok JH, Griffin RG, Vega S. Chemical-shift correlation spectroscopy in rotating solids - radio frequency-driven dipolar recoupling and longitudinal exchange. J Chem Phys. 1992;96:8624–8627. [Google Scholar]
- 15.Raya J, Bianco A, Furrer J, Briand JP, Piotto M, Elbayed K. Proton dipolar recoupling in resin-bound peptides under high-resolution magic angle spinning. J Magn Reson. 2002;157:43–51. doi: 10.1006/jmre.2002.2573. [DOI] [PubMed] [Google Scholar]
- 16.Scheidt HA, Huster D. The interaction of small molecules with phospholipid membranes studied by 1H NOESY NMR under magic-angle spinning. Acta Pharmacol Sin. 2008;29:35–49. doi: 10.1111/j.1745-7254.2008.00726.x. [DOI] [PubMed] [Google Scholar]
- 17.Chen ZJ, Stark RE. Evaluating spin diffusion in MAS-NOESY spectra of phospholipid multibilayers. Solid State Nucl Magn Reson. 1996;7:239–246. doi: 10.1016/s0926-2040(96)01237-4. [DOI] [PubMed] [Google Scholar]
- 18.Huster D, Gawrisch K. NOESY NMR crosspeaks between lipid headgroups and hydrocarbon chains: spin diffusion or molecular disorder? J Am Chem Soc. 1999;121:1992–1993. [Google Scholar]
- 19.Zhang W, Smith SO. Mechanism of penetration of Antp(43–58) into membrane bilayers. Biochemistry. 2005;44:10110–10118. doi: 10.1021/bi050341v. [DOI] [PubMed] [Google Scholar]
- 20.Epand RM. Do proteins facilitate the formation of cholesterol-rich domains? Biochimica Et Biophys Acta. 2004;1666:227–238. doi: 10.1016/j.bbamem.2004.07.004. [DOI] [PubMed] [Google Scholar]
- 21.Kweon DH, Kim CS, Shin YK. Insertion of the membrane-proximal region of the neuronal SNARE coiled coil into the membrane. J Biol Chem. 2003;278:12367–12373. doi: 10.1074/jbc.M211123200. [DOI] [PubMed] [Google Scholar]
- 22.Arbuzova A, Schmitz AAP, Vergeres G. Cross-talk unfolded: MARCKS proteins. Biochem J. 2002;362:1–12. doi: 10.1042/0264-6021:3620001. [DOI] [PMC free article] [PubMed] [Google Scholar]
- 23.Gambhir A, Hangyas-Mihalyne G, Zaitseva I, Cafiso DS, Wang JY, Murray D, Pentyala SN, Smith SO, McLaughlin S. Electrostatic sequestration of PIP2 on phospholipid membranes by basic/aromatic regions of proteins. Biophys J. 2004;86:2188–2207. doi: 10.1016/S0006-3495(04)74278-2. [DOI] [PMC free article] [PubMed] [Google Scholar]
- 24.Czech MP. PIP2 and PIP3: complex roles at the cell surface. Cell. 2000;100:603–606. doi: 10.1016/s0092-8674(00)80696-0. [DOI] [PubMed] [Google Scholar]
- 25.McLaughlin S, Wang JY, Gambhir A, Murray D. PIP2 and proteins: interactions, organization, and information flow. Annu Rev Biophys Biomol Str. 2002;31:151–175. doi: 10.1146/annurev.biophys.31.082901.134259. [DOI] [PubMed] [Google Scholar]
- 26.Feller SE, Huster D, Gawrisch K. Interpretation of NOESY cross-relaxation rates from molecular dynamics simulation of a lipid bilayer. J Am Chem Soc. 1999;121:8963–8964. [Google Scholar]
- 27.Huster D, Arnold K, Gawrisch K. Investigation of lipid organization in biological membranes by two-dimensional nuclear overhauser enhancement spectroscopy. J Phys Chem B. 1999;103:243–251. [Google Scholar]
- 28.Yau WM, Gawrisch K. Lateral lipid diffusion dominates NOESY cross-relaxation in membranes. J Am Chem Soc. 2000;122:3971–3972. [Google Scholar]
- 29.Wiener MC, White SH. Structure of a fluid dioleoylphosphatidylcholine bilayer determined by joint refinement of x-ray and neutron diffraction data. II. Distribution and packing of terminal methyl groups. Biophys J. 1992;61:428–433. doi: 10.1016/S0006-3495(92)81848-9. [DOI] [PMC free article] [PubMed] [Google Scholar]
- 30.Forbes J, Husted C, Oldfield E. High-field, high-resolution proton magic-angle sample-spinning nuclear magnetic-resonance spectroscopic studies of gel and liquid-crystalline lipid bilayers and the effects of cholesterol. J Am Chem Soc. 1988;110:1059–1065. [Google Scholar]


