

Abstract
The habenula is a dorsal diencephalic structure consisting of medial and lateral subnuclei and a principal output tract, the fasciculus retroflexus, which together form a link between the limbic forebrain and ventral midbrain. Here, we have used microarray and bioinformatic approaches in the mouse to show that the habenula is a distinctive molecular territory of the CNS, with a unique profile of neurotransmitter, ion channel, and regulatory factor expression. Neurons of the medial habenula and part of the lateral habenula express the transcription factor Brn3a/Pou4f1, and Brn3a-expressing habenular neurons project exclusively to the interpeduncular nucleus in the ventral midbrain. In Brn3a mutant embryos, the fasciculus retroflexus is directed appropriately, but habenular neurons fail to innervate their targets. Microarray analysis of Brn3a null embryos shows that this factor regulates an extensive program of habenula-enriched genes, but not generic neural properties. The orphan nuclear receptor Nurr1/Nr4a2 is coexpressed with Brn3a in the developing habenula, is downstream of Brn3a, and mediates expression of a subset of Brn3a-regulated transcripts. Together, these findings begin to define a gene regulatory pathway for habenula development in mammals.
Introduction
The habenula is a paired midline structure, located on the dorsal surface of the thalamus. It is part of a division of the diencephalon termed the epithalamus, which also includes the pineal organ and, in nonmammalian vertebrates, the parapineal. In mammals, it consists of two principal parts, the medial habenula (MH) and the lateral habenula (LH). The dorsal MH expresses the neuropeptide substance P (SP), whereas the ventral MH expresses choline acetyltransferase (Contestabile et al., 1987; Lecourtier and Kelly, 2007). LH neurons exhibit greater diversity in cytoarchitecture, neurotransmitter expression, and connectivity, and the LH appears to be composed of multiple subnuclei (Andres et al., 1999; Geisler et al., 2003).
The habenula mediates a major descending pathway connecting the limbic forebrain to the monoaminergic nuclei of the midbrain tegmentum, via direct connections and also indirectly through the interpeduncular nucleus (IPN) (Klemm, 2004; Lecourtier and Kelly, 2007). A hallmark of the habenula is a prominent output tract, the habenulopeduncular tract or fasciculus retroflexus (FR). MH neurons project almost exclusively via this tract to the IPN (Contestabile and Flumerfelt, 1981). The IPN, in turn, innervates secondary midbrain targets, including the median raphe, ventral tegmental area (VTA), and dorsal tegmental nucleus (Shibata and Suzuki, 1984). Efferents from the LH also project via the FR but may connect directly to brainstem structures, bypassing the IPN (Herkenham and Nauta, 1979). It has been proposed that these habenular pathways regulate midbrain monoamine systems in parallel with the medial forebrain bundle (Hikosaka et al., 2008).
Little is known about the development of the habenula in mammals. In fish and frogs, the habenula and its projections are bilaterally asymmetrical (Concha and Wilson, 2001; Aizawa et al., 2005) and develop in relationship to the photoreceptive parapineal organ under the influence of nodal signaling (Concha et al., 2003; Gamse et al., 2003; Aizawa et al., 2007; Roussigne et al., 2009). In mammals, which do not have a photoreceptive pineal complex, this asymmetry appears to be lost. However, in both fish and rodents, neuropilin–semaphorin signaling plays a role in directing habenular axons to their midbrain targets (Giger et al., 2000; Kantor et al., 2004; Kuan et al., 2007).
Here, we have used microarray data and bioinformatic analysis of high-throughput in situ hybridization (ISH) to define a unique habenular profile of neurotransmitters, receptors, ion channels and regulatory factors. Nearly all MH neurons, and a subset of those in the LH, express the POU-domain transcription factor Brn3a (product of the Pou4f1 gene). Brn3a-expressing habenular neurons project exclusively to the IPN. In Pou4f1−/− embryos, the FR has an appropriate initial trajectory but does not innervate its target. Microarray analysis of Pou4f1−/− embryos shows that Brn3a regulates a large subset of the habenula-enriched genes, but not generic neural properties. One target of Brn3a regulation is the orphan nuclear receptor Nurr1 (product of the Nr4a2 gene), which is coexpressed with Brn3a throughout the habenula and requires Brn3a for the initiation of its expression. Examination of Nr4a2−/− mice reveals that this factor is required for the expression of some of the genes downstream of Brn3a, defining a pathway for the establishment of a unique molecular profile for habenular neurons.
Materials and Methods
Mice and matings.
Mice bearing a null allele of Pou4f1 (Xiang et al., 1996), a tauLacZ fusion protein targeted to the Pou4f1 locus (Pou4f1tLacZ) (Quina et al., 2005) and a null allele of Nr4a2 (Castillo et al., 1998), and the genotyping of these alleles have been described previously. All alleles were carried on a C57BL/6 genetic background and have been backcrossed to C57BL/6 for at least five generations. All targeted alleles of the Pou4f1 and Nr4a2 loci are neonatal lethal when homozygous, and heterozygous mice were mated to generate null embryos and newborn pups. Noon on the day of the detection of a mucous plug was designated embryonic day 0.5 (E0.5).
Microarray analysis.
For studies of global gene expression in the developing habenula, mice bearing Pou4f1− and Pou4f1tLacZ alleles were interbred to generate litters with Pou4f1tLacZ/− knock-out embryos and Pou4f1tLacZ/+ controls, which were harvested at E16.5. The embryonic brain was dissected intact and hemisected in the sagittal plane to expose the habenula near the midline. For transgene-guided microdissection, brain tissue was stained in xgal buffer containing 100 mm potassium phosphate, pH 7.4, 5 mm EGTA, 2 mm MgCl2, 0.5 mg/ml xgal, and 1 mm EDTA for 15–30 min at 37°C, and the stained habenulae were dissected using fine forceps. The tissue was then rinsed in PBS and stored in RNAlater (Qiagen) at 4°C for up to 1 week, until the completion of genotyping. Knock-out and control embryos were then pooled according to genotype and transferred to −80°C for subsequent storage. For each microarray sample, RNA was prepared from 11 pairs of habenulae using an RNAqueous-Micro kit (Ambion) according to the manufacturer's protocol, followed by DNase treatment, yielding ∼1 μg of RNA per sample. For comparison of gene expression between the habenula, cortex, and thalamus, tissue was harvested from Pou4f1tLacZ/+ E16.5 embryos and processed as described above. The thalamic sample consisted of the entire thalamus, minus habenula. The cortical sample was a full-thickness explant of the dorsolateral part of the frontoparietal cortex, avoiding the midline and ventral regions. The quality of the extracted RNA was monitored by the ratio of the intensity of 18S and 28S ribosomal RNA bands using an Agilent 2100 Bioanalyzer, and RNA was quantified using a Nanodrop ND-1000 spectrophotometer.
For microarray analysis, amplified RNA (aRNA) was synthesized from 0.5 ± 0.1 μg of total RNA, using the Message Amp II kit (Ambion), following the manufacturer's instructions for a one-step amplification. Yields of biotin-labeled aRNA ranged from 75 to 100 μg per sample, and 15 μg was used for hybridization to the Affymetrix Mouse Genome 430 version 2.0 (430v2) array. Hybridization to GeneChip arrays were all performed according to standard protocols provided by the manufacturer (Affymetrix). Comparisons of gene expression for the habenula versus thalamus and cortex, and between habenula samples from Pou4f1tLacZ/+ and Pou4f1tLacZ/− embryos, were performed in duplicate, using entirely separate samples (biological replicates).
The primary analysis of microarray data, including determination of the absence/presence of the assayed transcripts, transcript expression levels, and the probability of change in transcript expression between samples (“change-p”) was performed with Microarray Suite 5.0 (MAS5; Affymetrix). Default MAS5 parameters were used for increase (I) and decrease (D) calls. For the 430v2 array set, these cutoff values were p < 0.002 and p > 0.998 for I and D, respectively. All array values were initially scaled to a mean value of 500 using global scaling. Microarray probe sets were related to the corresponding mouse transcripts using the NetAffx database (Affymetrix), based on the National Center for Biotechnology Information Build 36 annotation of the mouse genome.
Detailed methods for the bioinformatic analysis of the adult brain appear in the supplemental Methods (available at www.jneurosci.org as supplemental material).
Electroporation in utero.
Timed-pregnant ICR mice (Charles River) bearing E13.5 embryos were anesthetized by isoflurane inhalation, their abdominal cavity was incised, and the uterine horns were exposed as described by Saito (2006). Approximately 1 μl of solution encoding Brn3a and/or green fluorescent protein (GFP) was injected into the third ventricle of embryos using a pulled-glass micropipette (see Fig. 9). Before injection, plasmid DNA was diluted to 4 μg/μl in PBS, and Fast Green solution was added to a final concentration of 0.03% to monitor the injection.
Figure 9.
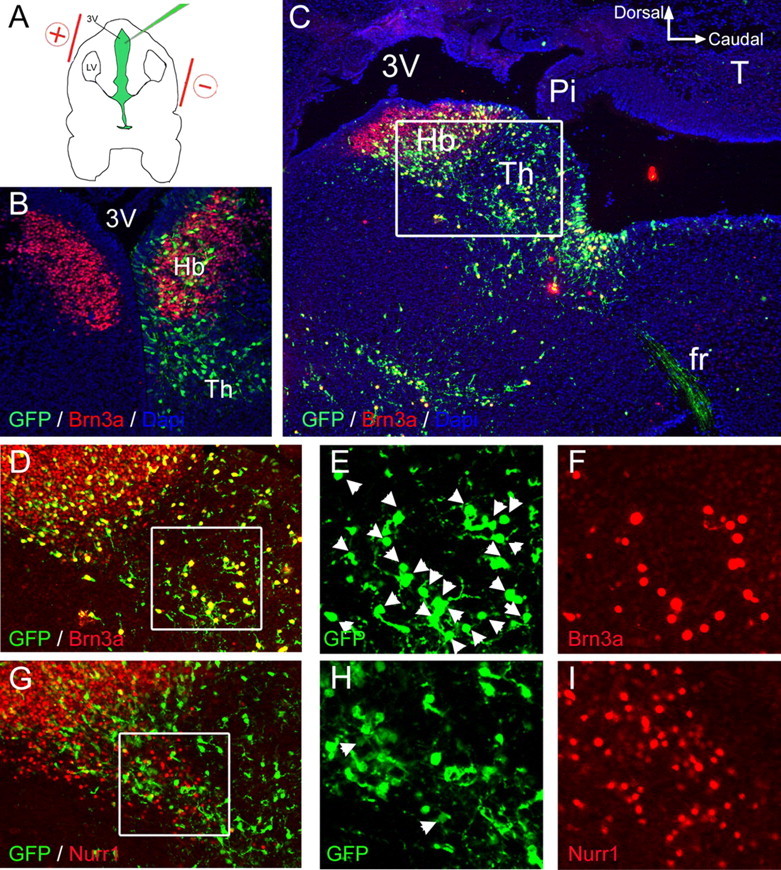
Brn3a is not sufficient to induce ectopic expression of Nurr1 in the diencephalon. A, Plasmids encoding Brn3a plus cytoplasmic or nuclear targeted GFP, or a control plasmid expressing GFP alone, were electroporated into habenular precursors by injection into the third ventricle at E13.5. Embryos were harvested at E16.5. B, Expression of GFP from a control plasmid was observed within the habenula, and in more ventral and caudal domains within the developing thalamus. The control plasmid did not alter the pattern of endogenous Brn3a expression. C, Low-power image of the habenula and periventricular thalamus in sagittal section, following electroporation of a Brn3a-GFP expression vector. Immunofluorescence for Brn3a and GFP with 4′,6-diamidino-2-phenylindole staining reveals colocalization of the expressed proteins in nearly all cells for which the nucleus resides within the plane of section. The inset box indicates the area enlarged in D and G. D–I, Expression of Brn3a (D–F) and Nurr1 in adjacent sections (G–I) after electroporation of a Brn3a-GFP plasmid. Nurr1 expression was observed in 4% of GFP+ cells in this region electroporated with Brn3a-GFP (n = 400) and 2% of cells electroporated with GFP alone (n = 400; data not shown), which did not represent a statistically significant difference. 3V, Third ventricle; Pi, pineal; fr, fasciculus retroflexus; Hb, habenula; Th, thalamus; LV, lateral ventricle.
Tweezers-type electrodes (CUY650-P5; Harvard Apparatus) were placed on each side of the fetal head, such that a line between the electrode faces formed an ∼20° angle with the horizontal plane, with the anode in the more dorsal position. Square-wave electrical pulses (30 V, 50 ms) were then applied five times at 1 s intervals with an electroporator (BTX T820). Only a few embryos at a time were exposed, and care was taken to quickly place them back into the abdominal cavity to avoid excessive cooling. The wall and skin of the abdominal cavity were then closed, and embryos were allowed to develop normally until harvest at E16.5. Embryos were then processed for immunofluorescence as described below.
Four plasmids were used for electroporation studies, designed to express Brn3a plus cytoplasmic GFP (pTS-Brn3a), Brn3a plus nuclear GFP (pTSn-Brn3a), or cytoplasmic/nuclear GFP alone (pTS, pTSn). The parent vector pTS is derived from the vector pMES and has been described previously (Fedtsova et al., 2008). It contains a cytomegalovirus enhancer, a chick βactin promoter, a multiple cloning site, an internal ribosomal entry site sequence, an enhanced GFP expression cassette, and a βglobin polyadenylation signal. The expression cassette encoding the full mouse Brn3a open reading frame has been described previously (Gruber et al., 1997), and the coding sequence corresponds to Entrez accession number NP_035273. Because electroporation of pTS-Brn3a alone resulted in expression of Brn3a protein, which clearly exceeded endogenous levels in habenula neurons, Brn3a expression plasmids were premixed with pTS vector in a 1:1 ratio to allow expression of high levels of the GFP marker and physiologically appropriate levels of Brn3a.
Immunofluorescence and ISH.
Tissue for immunofluorescence and ISH was fixed by immersion in 4% paraformaldehyde in PBS at stages up to E16.5 and by cardiac perfusion in newborn and adult mice. Cryostat sections at 15–30 μm were used for both techniques. Primary antibodies used included the following: rabbit anti-Brn3a (Fedtsova and Turner, 1995); guinea pig anti-Brn3a (Quina et al., 2005); rabbit anti-Nurr1, a gift from T. Perlmann (Karolinska Institute, Stockholm, Sweden) (Wallen et al., 2001) and from a commercial source (Santa Cruz Biotechnology); rabbit anti-Robo3/Rig-1, a gift from F. Murakami (Osaka University, Osaka, Japan) (Tamada et al., 2008); rabbit anti-Etv1/Er81, a gift from S. Arber (University of Basel, Basel, Switzerland) (Arber et al., 2000); rabbit anti-Dbx1, a gift from Y. Nakagawa (University of Minnesota, Minneapolis, MN) (Vue et al., 2007); rabbit and guinea pig anti-Olig3, gifts from C. Birchmeier (Max-Delbrück-Centrum, Berlin, Germany) (Storm et al., 2009); mouse monoclonal Pax3 (Developmental Studies Hybridoma Bank); rat monoclonal anti-substance P; goat anti-ChAT, rabbit anti-tyrosine hydroxylase (TH), and rabbit anti-tryptophan hydroxylase 2 (Tph2; (Millipore); goat anti-β-galactosidase (βgal; Biogenesis); rabbit anti-βgal (5Prime-3Prime); and mouse monoclonal anti-tubulin β-3 (R & D Systems). Secondary antibodies conjugated to Alexa series fluorophores were obtained from Invitrogen. ISH was performed as described previously (Eng et al., 2004). Sources for ISH probes appear in supplemental Table 1 (available at www.jneurosci.org as supplemental material).
Results
Brn3a expression defines a functionally related population of habenular neurons
To begin to understand the role of Brn3a in habenula development, we first examined Brn3a expression in the adult mouse MH and LH. To trace the projections of Brn3a-expressing neurons, we used a transgenic line with a tauLacZ reporter integrated into the Pou4f1 locus (Quina et al., 2005). Staining for βgal activity revealed the habenula, FR, IPN, and fiber tracts originating from other sites of Brn3a expression in these mice (Fig. 1A–D). Examination of the habenula by immunofluorescence for Brn3a protein revealed expression in nearly all MH neurons, but only in a subset of LH cells (Fig. 1E,F).
Figure 1.
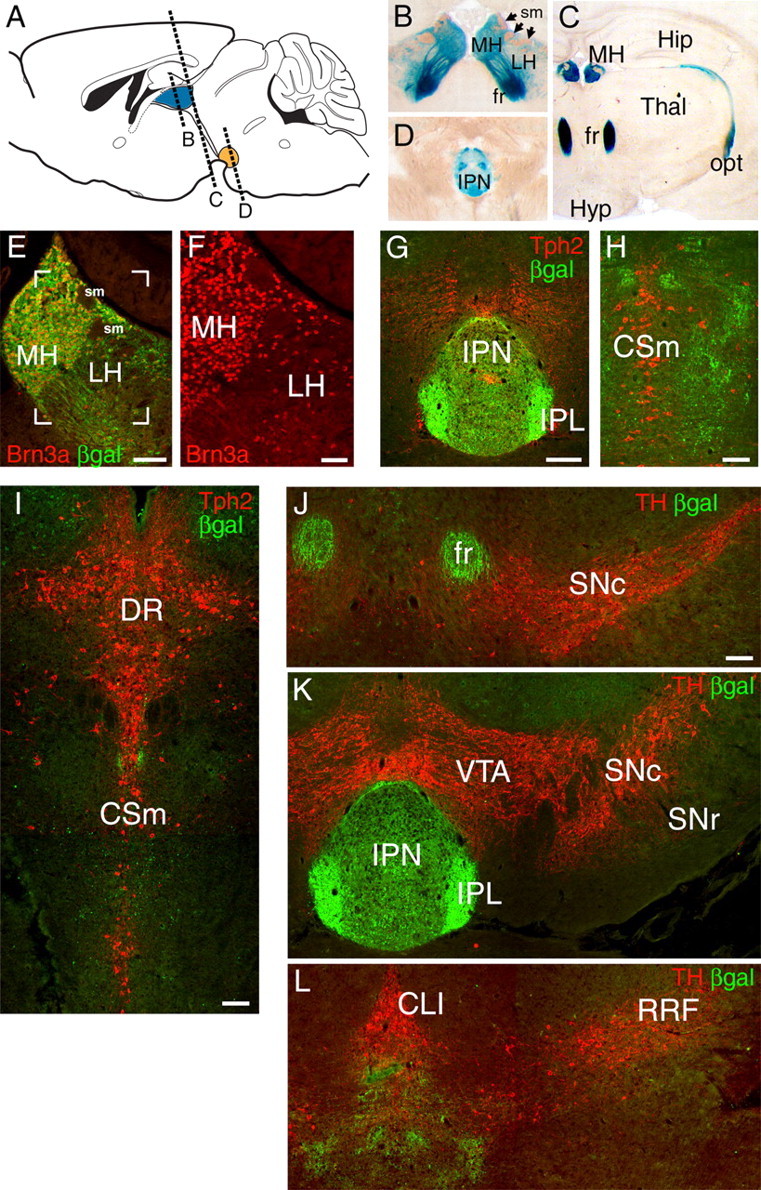
Brn3a is expressed in habenular neurons projecting specifically to the IPN. A–D, Expression of a Pou4f1tLacZ transgene in the habenula and its projections revealed by xgal staining in the adult mouse brain. Afferent habenular fibers of the striae medularis are also indicated. E, F, Colocalization of Brn3a protein expression and βgal immunoreactivity in the MH and LH. Brn3a is expressed in nearly all MH and a subset of LH neurons. The bracketed area in E is enlarged in F. G–I, Relationship of habenular projections to serotonergic neurons and fibers revealed by Tph2 immunoreactivity. G, βgal-labeled habenular fibers terminate in the IPN. Tph2 staining at this level is predominantly ascending serotonergic fiber tracts. The plane of the section is similar to D. H, I, Progressively more caudal sections showing that βgal-labeled fibers do not associate with cell bodies of serotonergic neurons of the raphe nuclei. J–L, Relationship of habenular projections to dopaminergic neurons and fibers, marked by TH immunoreactivity. βgal-labeled fibers do not project to the dopaminergic areas of the basal midbrain. CLI, Central linear nucleus raphe; CSm, superior central nucleus raphe, medial part; DR, dorsal raphe; fr, fasciculus retroflexus; Hip, hippocampus; Hyp, hypothalamus; IPL, IPN, lateral subnucleus; opt, optic tract, RRF, retrorubral field; sm, striae medularis; SNr, substantia nigra, pars reticulata; Thal, thalamus. Scale bars: E, G–L, 100 μm; F, 50 μm.
Past neuroanatomical studies of the habenula have shown that habenular neurons project via the FR to the IPN and also directly to ventral monoaminergic nuclei including the dopaminergic substantia nigra, pars compacta (SNc) and VTA and the serotonergic raphe nuclei. To resolve the projections of the Brn3a-expressing neurons in the MH and LH, we combined transgenic tract tracing with immunofluorescence for Tph2 and TH, which identify 5-HT and dopamine neurons, respectively. Examination of the entire course of the habenular projections labeled in Pou4f1tLacZ mice revealed that the vast majority of the βgal-labeled fibers terminated in the IPN or immediately caudal to the IPN (Fig. 1G,H). Labeling was not observed in the vicinity of the Tph2+ neurons of the median raphe (Fig. 1H,I) or the dorsal raphe (Fig. 1I), or of the TH+ neurons of the SN (Fig. 1J), VTA (Fig. 1K), central linear nucleus raphe, or retrorubral field (Fig. 1L). We conclude that although Brn3a is expressed in a subset of neurons in the LH, which is known to contain neurons that project directly to monoaminergic areas, the Brn3a+ LH neurons do not. Instead, the projections of the Brn3a+ LH neurons resemble those of the MH, exclusively innervating the IPN or contiguous areas.
To determine the neurotransmitter phenotype of the Brn3a-expressing neurons in the MH, we examined the expression of ChAT and SP in Pou4f1tLacZ mice. ChAT immunoreactivity strongly colocalized with βgal in the ventral two-thirds of the MH (Fig. 2A,C,D) and also in the principal part of the IPN (Fig. 2F,G). SP/Tac1-expressing neurons were confined to the dorsal third of the MH, which was also positive for βgal (Fig. 2D,E), and SP immunoreactivity colocalized with βgal in the lateral subnucleus of the IPN (Fig. 2H,I). These results demonstrate that both of these major subclasses of MH neurons, cholinergic and peptidergic, express Brn3a.
Figure 2.

Neurotransmitter phenotype of Brn3a-expressing habenular neurons. A–D, Immunofluorescence in adult brain sections for ChAT and βgal expressed from the Pou4f1 locus showed colocalization in the ventral two-thirds of the MH. The bracketed area in A appears enlarged in B–D. E, ISH signal for SP/Tac1 was restricted to the dorsal third of the MH (ABA Tac1_187_2030). F, G, ChAT strongly colocalizes with βgal in the principal part of the IPN, but not in the lateral subnucleus. H, I, SP immunoreactivity strongly colocalizes with βgal in the lateral subnucleus of the IPN. fr, fasciculus retroflexus; IPL, IPN, lateral subnucleus. Scale bars: A–D, 100 μm; F–I, 200 μm.
The habenula is a unique molecular territory of the CNS
We next used microarray analysis to compare global gene expression in the habenula, thalamus, and cerebral cortex of E16.5 embryos. To accurately dissect habenula tissue for RNA extraction, a rapid xgal staining protocol was used, which allowed the habenula to be visualized in the brains of hemisected Pou4f1taulacZ/+ embryos within 15 min (supplemental Fig. 1 and Methods, available at www.jneurosci.org as supplemental material). Pairwise comparisons of habenula–thalamus and habenula–cortex gene expression were made using Affymetrix murine 430v2 arrays, and the experiments were performed with two independent samples from each brain region. The patterns of gene expression in replicate samples from each tissue were highly reproducible, whereas many divergently expressed transcripts were noted in comparisons of the habenula versus thalamus and habenula versus cortex (supplemental Fig. 1, available at www.jneurosci.org as supplemental material). Average expression values from these brain regions were used to determine a set of transcripts most enriched in the habenula (Table 1). Of 45,037 probe sets on the array, Brn3a ranked as second-most enriched in the habenula relative to the other CNS regions, confirming this factor as a habenula-specific marker in the forebrain.
Table 1.
Transcripts enriched in E16.5 habenula relative to cerebral cortex and thalamus
| Gene symbol | Gene title | Microarray ratio |
ABA |
||||
|---|---|---|---|---|---|---|---|
| Hab/Ctx | Hab/Thal | Hab/other | Visual | Hab/Ctx | Hab/Thal | ||
| Complete | |||||||
| Robo3 | Roundabout homolog 3 | 294 | 103 | 152 | + | 1.7 | 0.9 |
| Pou4f1 | POU domain, class 4, transcription factor 1; Brn3a | 180 | 99 | 128 | ++ | 69 | 75 |
| Dcc | Deleted in colorectal carcinoma | 29 | 171 | 49 | ne | ||
| Gpr151 | G-protein-coupled receptor 151 | 51 | 34 | 40 | +++ | 25 | 179 |
| Irx2 | Iroquois related homeobox 2 | 118 | 22 | 38 | ++ | 29 | 68 |
| Kcnma1 | K+ large conductance Ca++-activated channel, subfamily M, α member 1 | 63 | 25 | 36 | + | 3.2 | 1.7 |
| Msi2 | Musashi homolog 2 | 32 | 34 | 33 | + | 5.7 | 4.5 |
| Dmt2 | Dorsomedial telencephalon gene 2 | 447 | 17 | 33 | nd | ||
| Gng8 | Guanine nucleotide binding protein, γ8 subunit | 146 | 18 | 32 | nd | ||
| Scube2 | Signal peptide, CUB domain, EGF-like 2 | 230 | 17 | 32 | ne | ||
| Ppnr | Per-pentamer repeat gene | 129 | 16 | 29 | + | 1.4 | 5.5 |
| Kcng4 | K+ voltage-gated channel, G4 | 28 | 27 | 27 | ++ | 9.4 | 9.7 |
| Tesc | Tescalcin | 117 | 14 | 25 | + | 8.8 | 2.1 |
| Dbx1 | Developing brain homeobox 1 | 33 | 19 | 24 | ne | ||
| Tmem16a | Transmembrane protein 16A | 29 | 19 | 23 | +++ | 52 | 123 |
| Irx5 | Iroquois related homeobox 5 | 79 | 12 | 21 | ne | ||
| Pbx3 | Pre-B-cell leukemia transcription factor 3 | 21 | 18 | 19 | ++ | 8.0 | 11 |
| Htr5b | 5-HT (serotonin) receptor 5B | 69 | 11 | 19 | +++ | 33 | 43 |
| Chrnb4 | Cholinergic receptor, nicotinic, β polypeptide 4 | 27 | 14 | 18 | +++ | 80 | 177 |
| Col2a1 | Procollagen, type II, α1 | 21 | 16 | 18 | nc | 0.7 | 1.5 |
| Irx1 | Iroquois related homeobox 1 | 55 | 10 | 17 | + | 1.7 | 1.5 |
| Robo1 | Roundabout homolog 1 | 15 | 19 | 17 | + | 3.5 | 7.8 |
| Selected | |||||||
| Ttr | Transthyretin | 14 | 17 | 15 | cp | 3.5 | 6.4 |
| 3110047P20Rik | Hematological and neurological expressed 1 | 188 | 7.6 | 15 | +++ | 32 | 15 |
| Efcbp2 | EF hand calcium binding protein 2 | 40 | 8.7 | 14 | ++ | 4 | 23 |
| Etv1 | Ets variant gene 1 | 11 | 19 | 14 | ++ | 9.5 | 2.1 |
| Vav3 | Vav 3 oncogene | 42 | 7.2 | 12 | ++ | 2.9 | 18 |
| Ntng2 | Netrin G2 | 8.0 | 26 | 12 | ++ | 1.9 | 8.5 |
| Kctd8 | Potassium channel tetramerization domain containing 8 | 23 | 8.3 | 12 | +++ | 28 | 19 |
| Nrp2 | Neuropilin 2 | 20 | 8.6 | 12 | ++ | 15 | 85 |
| Grb10 | Growth factor receptor bound protein 10 | 14 | 10 | 12 | +++ | 11 | 131 |
| Nr4a2 | Nuclear receptor subfamily 4, group A, member 2 Nurr1 | 8.1 | 22 | 12 | + | 1.3 | 0.8 |
Microarray analysis at E16.5 and bioinformatic analysis of the adult brain were used to identify habenula-enriched transcripts. Microarray values are derived from the means of two independent arrays for the habenula (Hab), cortex (Ctx), and thalamus (Thal). The ratio of habenula/other is calculated using the mean of the cortex and thalamus values. ABA data were examined by visual inspection and automated signal quantitation (see Materials and Methods).
+++, Enriched in the habenula with minimal other CNS expression;
++, enriched in the habenula with a few other CNS sites of expression;
+, enriched in the habenula with multiple other CNS sites of expression; nc, expression not correlated with habenula; ne, not expressed, little or no expression detected in any area of CNS; nd, no data in ABA; cp, highly enriched in choroid plexus.
To test whether the embryonic pattern of habenula-specific gene expression detected at E16.5 was maintained in the adult, we examined the expression of the enriched transcripts in the extensive atlas of gene expression generated for the mouse brain by the Allen Institute [Allen Brain Atlas (ABA), http://mouse.brain-map.org] (Lein et al., 2007). The results of a visual inspection of the ABA for the most habenula-enriched transcripts appears in Table 1, and the habenula ISH results for these transcripts appear in supplemental Figure 2 (available at www.jneurosci.org as supplemental material). Many of the habenula-enriched transcripts identified on the microarray have a similar pattern of expression in the adult brain, suggesting that the ABA may be used to comprehensively examine habenula gene expression. However, the ABA contains expression data for ∼20,000 transcripts in the mouse brain, beyond the practical limit for determining regional gene expression by visual inspection.
To globally identify habenula-enriched transcripts in the adult brain, we used a bioinformatic approach. All ISH data in the ABA are spatially registered to a common three-dimensional atlas space derived from the Allen Reference Atlas (Dong, 2007) using previously described image processing algorithms (Ng et al., 2007). Three-dimensional regions of interest (ROIs) can thus be identified in reference atlas space and projected onto the ISH data for analysis. Three ROIs were defined for this analysis, including the habenula (medial plus lateral), the thalamus, and the cerebral cortex, corresponding as closely as possible to the physical dissections performed for the microarray study of the embryonic brain (see Materials and Methods). From these ROIs, expression signal extraction was performed using morphological filtering and adaptive thresholding techniques, resulting in an expression mask for each ISH image classifying each pixel as either expressing or nonexpressing (Ng et al., 2007). This mask was combined with ISH signal intensity data for the expressing pixels to compute an “expression energy” for the ROI (see Materials and Methods). Habenula/thalamus and habenula/cortex expression energy ratios were then computed as measures of habenula enrichment. Cortex and thalamus expression energies were also averaged to allow a single value for habenula enrichment to be generated (habenula/other CNS).
We then compared the set of habenula-enriched transcripts identified by microarray to the results of the bioinformatic analysis of the adult brain (Fig. 3A). We identified 112 transcripts in the microarray data set that had the most enriched microarray expression in the habenula compared with the average expression in the thalamus and cortex, and 91 of these had extractable data in the ABA. Of these 91, 42 had enriched expression in the adult habenula, 30 had detectable expression that was not enriched in the habenula, and 19 had habenula expression below the reliable threshold of detection. We also selected 88 control transcripts from the microarray experiment that had equal expression in the habenula and thalamus/cortex (Fig. 3B). Of these, only three showed increased habenula expression in the analysis of the ABA data. A bionomial test (supplemental Methods, available at www.jneurosci.org as supplemental material) was used to assess the probability that the 42 habenula-enriched transcripts and the 3 control transcripts from the microarray analysis that were also enriched in the ABA analysis would be selected by chance from among the 10,108 transcripts with significant habenula expression in the ABA. This test yielded a p value of 4.44 × 10⁻¹⁶ (highly unlikely) for obtaining >42 enriched probes by random selection and a p value of 0.98 (highly likely) for obtaining >3 enriched probes by random selection. We conclude that a large subset of habenula-enriched transcripts are stable across developmental time and are identifiable by both array and bioinformatic methods.
Figure 3.

Microarray and bioinformatic analysis of habenula gene expression in the embryonic and adult brain. A, Microarray analysis of the E16.5 habenula, cortex, and thalamus revealed 112 unique transcripts with >10-fold enriched expression in the habenula compared with the mean expression level in the cortex/thalamus. Of these transcripts, 91 had available data in the ABA. Quantitative analysis of the ABA data showed that 42 of these transcripts also had enriched expression in the adult brain, whereas 30 were expressed but not enriched and 19 were not detectable. Microarray enrichment of transcripts in all three categories were verified by quantitative RT-PCR (qPCR; mean and SD of 3 assays are shown). B, Control transcripts were identified in the microarray analysis that had equal expression in the habenula and cortex/thalamus. Of 88 control transcripts, 82 had available data in the ABA. Three of the control transcripts exhibited habenula-enriched expression in the adult brain, whereas 50 did not show enriched expression and 29 were not detected. C, Characteristic expression patterns of habenula-enriched transcripts. Recurring patterns observed included MH plus LH (Pou4f1, Vav2), MH only (Tac2), and the ventral part of the MH only (Slc18a3). Enriched expression in the dorsal half of the MH or in the LH alone was much less frequently observed (Nhlh2, Prokr2). See also data for ChAT and SP/Tac1 in Figure 2. Hab, habenula; cortex, Ctx; Thal, thalamus; Pou4f1, Brn3a; Vav2, Vav2 oncogene; Tac2, Tachykinin 2; Slc18a3, solute carrier family 18, member 3/vescicular acetylcholine transporter; Nhlh2, nescient helix loop helix 2; Prokr2, Prokineticin receptor 2. ISH data are derived from the ABA. Scale bar, 200 μm.
Although the microarray and bioinformatic analyses were concordant for a large number of transcripts, we wanted to determine why some of the transcripts that were habenula enriched in the microarray analysis at E16.5 were not enriched in the ABA. To rule out artifacts in the microarray analysis, we examined the expression of 21 habenula-enriched transcripts by reverse transcription (RT)-PCR (Fig. 3A), in addition to those verified by ISH, described below. RT-PCR confirmed the microarray results for 20 of 21 comparisons between habenula and cortex regardless of whether enriched expression, equal expression, or no detectable habenula signal was observed in the ABA data. We conclude that the transcripts that are habenula enriched at E16.5, but show equal expression in the adult, are enriched because of the later developmental program of the thalamus and cortex and represent a difference in timing rather than true specificity for the habenula. Transcripts that are habenula enriched at E16.5 but not detectable in the adult are likely to represent developmental genes that are transiently expressed in the habenula.
The high correlation between the microarray and bioinformatic analysis suggested that the ABA data set could be effectively searched for novel habenula-specific transcripts. Based on parameters derived from the test set of microarray-enriched transcripts, the ABA data set was filtered for transcripts that exhibited expression energy at least 10-fold enriched in habenula/cortex and 4-fold enriched in habenula/thalamus, plus a minimal threshold of habenula expression. This yielded ISH data for 306 unique transcripts, which were then visually inspected in the ABA data set. Of these transcripts, 98 were below the threshold of reliable detection and 78 exhibited high expression in the choroid plexus or in cells, presumably glia, which lined the ventricle. Both of these cell types lie immediately adjacent to the habenula and thus could not be distinguished from the habenula proper by the automated analysis. The remaining 130 transcripts were verified as habenula enriched in the atlas (supplemental Table 2, Fig. 3, available at www.jneurosci.org as supplemental material).
Specific habenula-enriched transcripts exhibited characteristic expression patterns within the MH and LH (Fig. 3C). The restricted expression of ChaT and SP/Tac1 in the ventral and dorsal MH, respectively (Fig. 2), was confirmed in the ABA data, although these transcripts did not meet the cutoff for habenula specificity because of significant expression in the neocortex. A large set of transcripts were expressed throughout the MH, with (e.g., Pou4f1, Vav2) or without (Tac2) expression in a subset of LH neurons. A second large set of transcripts were restricted to the ventral part of the MH, including multiple genes related to cholinergic systems (Slc18a3/VAChT). Expression restricted to the dorsal habenula (Nhlh2) or to neurons in the LH only (Prokr2) was much less frequently observed. Together, these patterns of gene expression begin to define a systematic set of markers for the subnuclear anatomy of the habenula.
Brn3a is required for correct innervation of habenular targets
To understand the specific role of Brn3a in habenula development, we next examined the effects of loss of Brn3a on the morphology of the habenula and FR and on the innervation of the IPN. Brn3a expression in the dorsal diencephalon was first detected in a few neurons in the mantle layer at 11.5 (data not shown). Using Brn3a as a marker for early habenula neurons in E12.5 embryos, we examined the relationship between the differentiation of the habenula and key markers that pattern the neuroepithelium of the diencephalon (Vue et al., 2007). The transcription factors Pax3, Dbx1, and Olig3 showed minimal overlap in their expression and portioned the neuroepithelium into three nearly discrete neurogenic domains in the apical, dorsal, and ventral diencephalon, respectively (Fig. 4A–C). Differentiation of the habenula, marked by Brn3a+ postmitotic neurons in the mantle layer, was associated with the Dbx1+ neuroepithelial domain, whereas Pax3+ precursors appeared more dorsal to the habenula neurogenic zone and Olig3+ precursors were primarily ventral to this area (Fig. 4D–F).
Figure 4.
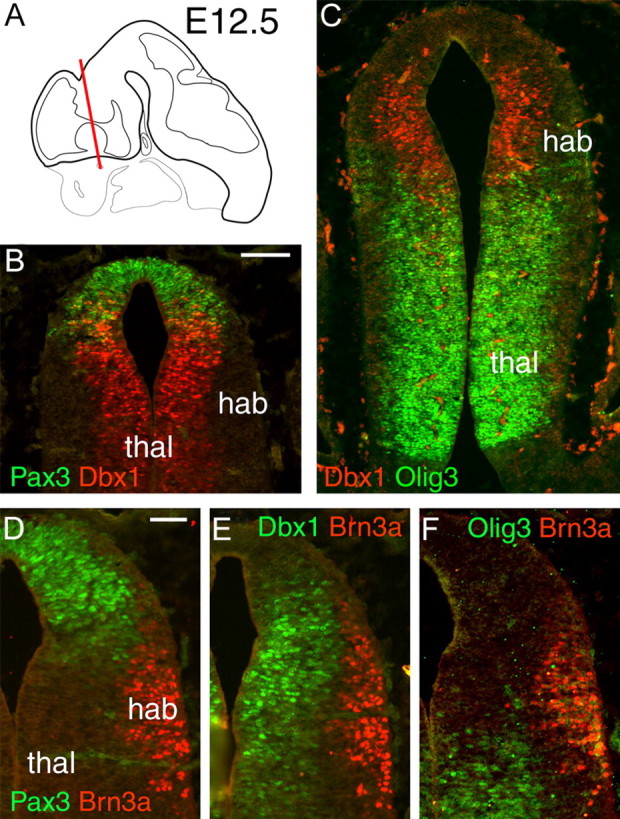
The habenula develops from Dbx1-expressing precursors in the presumptive dorsal thalamus. A, Schematic of the brain at E12.5 showing approximate plane of section for subsequent views. B, C, Immunofluorescence for Pax3, Dbx1, and Olig3 reveals nearly discrete domains in the neuroepithelium of the presumptive thalamus. D–F, Immunofluorescence for Brn3a with each of the progenitor domain markers reveals an association of the habenula with Dbx1-expressing precursors. Scale bars: B, C, 100 μm; D–F, 50 μm. thal, Thalamus; hab, habenula.
In Pou4f1tLacZ/− mutant embryos, habenula development was examined in the absence of Brn3a protein using the expression of the LacZ transgene as a marker. At E12.5, differentiating habenula neurons in control and Pou4f1tLacZ/− mutant embryos both expressed the early neuronal cytoskeletal marker tubulin β-3, and early fibers of the FR projected toward their midbrain targets similarly in both genotypes but did not yet reach the IPN (supplemental Fig. 4, available at www.jneurosci.org as supplemental material). By E16.5, labeled axons of the FR had reached the IPN, and their general trajectory was normal in Pou4f1tLacZ/− embryos (Fig. 5B,C). However, at this stage, the morphology of the habenula was clearly abnormal in the mutants, with displacement of the LacZ-expressing neurons toward the midline (Fig. 5D,E).
Figure 5.
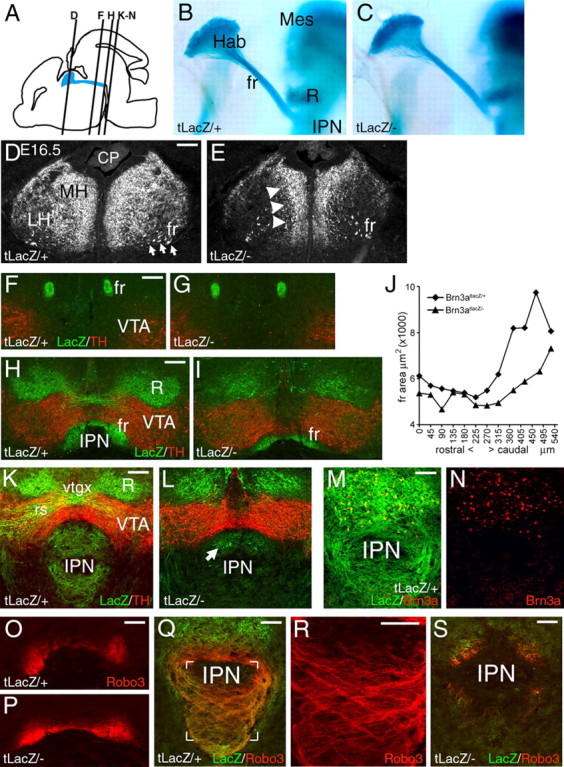
Displacement of habenular neurons and defective target innervation in Brn3a knock-out mice. A, Sagittal view of the brain at E16.5 showing the location of the habenula, FR, and IPN and the plane of sections shown in subsequent views. B, C, Midline view of habenula, FR, and IPN in hemisected, xgal-stained E16.5 embryos. D, E, Structure of the habenula in Pou4f1tLacZ/+ and Pou4f1tLacZ/− E16.5 embryos. Habenular neurons and axons are displaced toward the midline in the knock-out. F–I, Coronal sections showing the course of the FR in Pou4f1tLacZ/+ and Pou4f1tLacZ/− P0 mice, taken near the middle of its course (F, G) and just before termination in the IPN (H, I). J, Cross-sectional area of the FR from the caudal end of the habenula (zero coordinate) to the interpeduncular nucleus in P0 mice. Average values of right and left measurements are shown. The paired t test for the comparison of all sections from Pou4f1tLacZ/+ and Pou4f1tLacZ/− mice yields p = 1.0 × 10⁻⁴. K–N, Termination zone of habenular axons in the IPN at P0. The majority of βgal-immunoreactive fibers are missing in the Pou4f1tLacZ/− specimen (K, L), and the remaining expression appears to be associated with a few Brn3a+ neurons that are intrinsic to the IPN (M, N). O–S, Robo3 expression in the habenulopeduncular system. Robo3 is undiminished in the caudal FR (O, P; plane of section is similar to H). Robo3-expressing fibers innervate the IPN in a crossing pattern in a Pou4f1tLacZ/+ embryo (Q; detail R; plane of section is similar to K), but are nearly absent in a Pou4f1tLacZ/− specimen (S). CP, Choroid plexus; fr, fasciculus retroflexus; Hab, habenula; Mes, mesencephalon; R, red nucleus; rs, rubrospinal tract; vtgx, ventral tegmental decussation. Scale bars: D–I, 100 μm; K, L, O–S, 100 μm; M, N, 50 μm.
Because of neonatal lethality, postnatal day 0 (P0) was the last stage at which the habenulopeduncular system could be studied in Brn3a mutants. At this stage, the FR followed a normal trajectory toward its target (Fig. 5F,G) but was significantly diminished as it approached the IPN (Fig. 5H–J). Within the IPN, LacZ-labeled fibers were absent in the mutant animals, and residual LacZ labeling appeared to be attributable to a small population of Brn3a-expressing neurons that are intrinsic to the dorsal IPN (Fig. 5K–N), outside the entry zone of the FR axons.
Habenular axons strongly expressed the pathfinding signal Robo3/Rig1 (Tamada et al., 2008), and Robo3 expression in the FR was undiminished in Pou4f1tLacZ/− embryos (Fig. 5O,P). In control embryos, Robo3-immunoreactive fibers innervated the IPN in an intricate crossing pattern (Fig. 5Q,R), but Robo3-immunoreactive axons were nearly absent from the IPN of mutant embryos (Fig. 5S), confirming the loss of target innervation. Examination of ChAT and SP immunoreactivity in the IPN of Pou4f1tLacZ/− mice revealed that both of these classes of MH neurons fail to effectively innervate their respective targets in the medial and lateral IPN (supplemental Fig. 5, available at www.jneurosci.org as supplemental material).
Brn3a regulates a coordinated program of habenular gene expression
We next adopted a microarray strategy to determine the downstream targets of Brn3a in the habenula. Rapid staining for βgal activity was again used to visualize the habenula and facilitate tissue harvesting in unfixed brains of E16.5 Pou4f1tLacZ/− embryos and Pou4f1tLacZ/+ controls (see Materials and Methods). Although the Pou4f1tLacZ allele is a null allele, heterozygous Pou4f1tLacZ/+ embryos are suitable controls because Brn3a knock-out mice have no known heterozygote phenotype, and in previous studies of the sensory ganglia, Pou4f1+/+ and Pou4f1+/− mice have shown little difference in gene expression (Eng et al., 2004, 2007).
Loss of Brn3a resulted in profound changes in habenular gene expression. Table 2 and supplemental Table 3 (available at www.jneurosci.org as supplemental material) list transcripts that were significantly and reproducibly decreased in the Pou4f1tLacZ/− habenula relative to controls. Prominent among these transcripts are several that encode components of neurotransmitter systems, including Htr5b, Gpr151, Chrnb4, Sstr4, and Chrna3; components or accessory proteins of K+ channels, such as Kctd8, Kcnip1, and Kcnma1; and neurodevelopmental transcription factors, including Nurr1, Irx6, Neurod1, and Etv1. Extensive overlap was immediately apparent between the set of transcripts identified as most habenula enriched by microarray and bioinformatic analysis and the Brn3a-dependent transcripts.
Table 2.
Transcripts decreased in the habenula of E16.5 Brn3a knock-out embryos
| Gene symbol | Gene title | Experiment 1 |
Experiment 2 |
Mean HT/KO | ||
|---|---|---|---|---|---|---|
| Het1 | KO1 | Het2 | KO2 | |||
| Complete | ||||||
| Pou4f1 | POU domain, class 4, transcription factor 1; Brn3a | 12886 | 118 | 6208 | 182 | 64 |
| Kctd8 | K+ channel tetramerization domain containing 8 | 99 | 2 | 422 | 22 | 22 |
| Htr5b | 5-Hydroxytryptamine (serotonin) receptor 5B | 242 | 6 | 305 | 34 | 14 |
| Sncg | Synuclein, γ | 257 | 22 | 616 | 58 | 11 |
| Gpr151 | G-protein-coupled receptor 151 | 1971 | 209 | 2027 | 248 | 8.8 |
| Irx6 | Iroquois related homeobox 6 | 204 | 13 | 362 | 65 | 7.3 |
| 3110047P20Rik | RIKEN 3110047P20 gene | 13229 | 2801 | 11756 | 2443 | 4.8 |
| Kcnip1 | Kv channel-interacting protein 1 | 581 | 116 | 1641 | 360 | 4.7 |
| Rtn4rl2 | Reticulon 4 receptor-like 2 | 254 | 72 | 825 | 160 | 4.7 |
| Selected | ||||||
| Chrnb4 | Cholinergic receptor, nicotinic, β polypeptide 4 | 533 | 163 | 601 | 103 | 4.3 |
| Sstr4 | Somatostatin receptor 4 | 822 | 177 | 434 | 121 | 4.2 |
| 9430028L06Rik | RIKEN 9430028L06 gene | 218 | 57 | 341 | 79 | 4.1 |
| Nr4a2 | Nuclear receptor subfamily 4, group A, member 2; Nurr1 | 7300 | 1902 | 4452 | 1297 | 3.7 |
| Cart | Cocaine and amphetamine regulated transcript | 518 | 154 | 959 | 266 | 3.5 |
| Plch2 | Phospholipase C, eta 2; Phospholipase C-like 4; Plcl4 | 1524 | 442 | 2022 | 703 | 3.1 |
| Cacng5 | Ca++ channel, voltage-dependent, γ subunit 5 | 396 | 151 | 546 | 155 | 3.1 |
| Syt9 | Synaptotagmin IX | 1921 | 788 | 2744 | 745 | 3.0 |
| Kcnma1 | K+ large conductance calcium-activated channel, subfamily M, α member 1 | 2315 | 704 | 849 | 378 | 2.9 |
| Msi2 | Musashi homolog 2 | 3230 | 1067 | 1364 | 637 | 2.7 |
| Cacnb1 | Ca++-dependent, β1 subunit | 252 | 107 | 898 | 323 | 2.7 |
| Chrna3 | Cholinergic receptor, nicotinic, α polypeptide 3 | 1203 | 523 | 2408 | 835 | 2.7 |
| Cacnb3 | Ca++ channel, voltage-dependent, β3 subunit | 5191 | 2260 | 8193 | 3118 | 2.5 |
| Neurod1 | Neurogenic differentiation 1 | 7968 | 3243 | 4988 | 2211 | 2.4 |
| Rgma | RGM domain family, member A | 875 | 462 | 2148 | 850 | 2.3 |
| Etv1 | Ets variant gene 1; ER81 | 9202 | 3665 | 7438 | 3639 | 2.3 |
| Slc6a17 | Solute carrier family 6 (neurotransmitter transporter), member 17 | 275 | 121 | 816 | 364 | 2.2 |
| Epha8 | Eph receptor A8 | 846 | 549 | 1127 | 338 | 2.2 |
| Irx5 | Iroquois related homeobox 5 | 1753 | 846 | 3435 | 1676 | 2.1 |
| Efcbp2 | EF hand Ca++ binding protein 2 | 9409 | 5229 | 13343 | 5974 | 2.0 |
LacZ transgene-guided microdissection was used to isolate the habenula of Brn3atlacZ/+ and Brn3atlacZ/− embryos. Two independent microarray analyses were performed, and results are ranked by the heterozygote/knockout (HT/KO) ratio of the mean expression values. Array results were verified by ISH (Fig. 6) and quantitative RT-PCR (supplemental Fig. 6, available at www.jneurosci.org as supplemental material).
In contrast, relatively few transcripts exhibited increased expression in the Pou4f1tLacZ/− habenula (supplemental Table 4, available at www.jneurosci.org as supplemental material). The changes were also small in magnitude, and most of the increased transcripts were neither highly expressed nor specific for the habenula. The only generalization that could be drawn from these changes was a modest relative increase in the expression of some components of inhibitory neurotransmitter receptors, including the GABAA receptor subunits Gabrg1 and Gabra4 and the glycine receptor subunits Glra2 and Glrb.
To confirm the array results and to refine our understanding of the expression patterns of the Brn3a-regulated genes, we performed ISH for several of the downstream transcripts in wild-type and Pou4f1−/− embryos (Fig. 6). Changes in the receptor and channel components Gpr151, Kcnip1, Kctd8, and Kcnma1; the transcription factors Nurr1, Neurod1, and Etv1; the axon guidance molecules Rtn4lr2 and Deleted in colorectal carcinoma (DCC); and phospholipase C-eta2 (Plch2) were validated by this method. Only a small change in DCC expression was observed, and the most remarkable aspect of its expression was its restriction to a population of cells immediately adjacent to the ventricle, not observed for other factors. Neuropilin 2 (Nrp2) was confirmed as unchanged, although Nrp2-expressing cells were displaced toward the midline. RT-PCR validation of additional transcripts decreased in the Pou4f1tLacZ/− habenula confirmed the array results in 9 of 10 cases in which the array change was >2.5-fold (supplemental Fig. 6, available at www.jneurosci.org as supplemental material).
Figure 6.
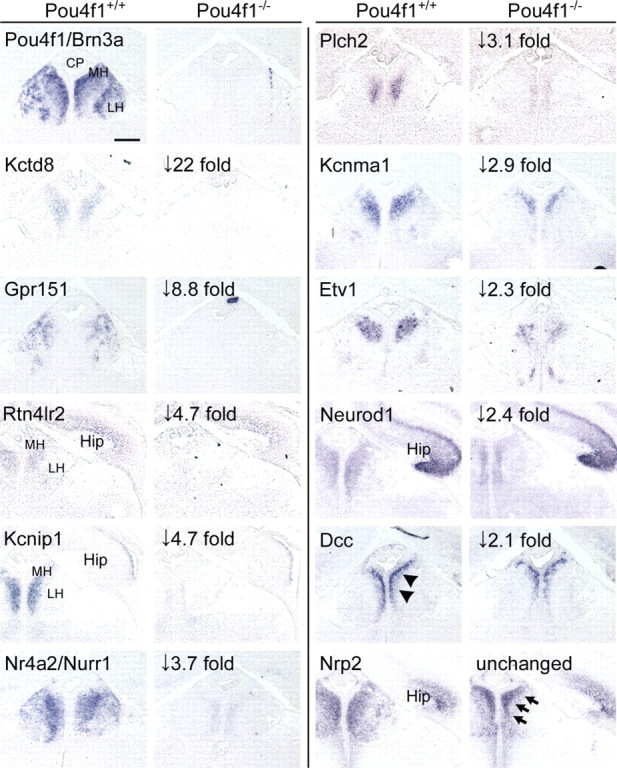
Molecular phenotype of the habenula in Brn3a null mice. Expression of potential Brn3a target genes identified by microarray were examined in Pou4f1+/+ and Pou4f1−/− embryos at E16.5 using ISH. In general, the magnitude of the changes in expression detected by ISH appeared to be greater than the changes observed on the array, and transcripts with more than fourfold decreased expression on the microarray were generally undetectable by ISH in Pou4f1−/− embryos. This may be in part because the use of heterozygous controls in the microarray study somewhat reduced the magnitude of the changes in expression measured by that method. DCC expression was verified but restricted to cells immediately adjacent to the ventricle (arrowheads). Nrp2 expression appeared unchanged, but Nrp2-expressing cells were displaced toward the midline, as observed for other markers (arrows). Expanded gene names appear in Table 2. Hip, Hippocampus; CP, choroid plexus. Scale bar, 100 μm.
The pattern of ISH for the transcription factors Brn3a, Nurr1, and Etv1, and the dependence of Nurr1 and Etv1 on Brn3a, suggest that these factors are expressed in the same set of MH and LH neurons. To confirm this, we examined the colocalization of Brn3a with each of the other factors by immunofluorescence (Fig. 7A–I). In control embryos at E16.5, both factors strongly colocalize with Brn3a, although the relative intensity of expression varied across the MH and LH. In the habenula of Pou4f1−/− embryos, Nurr1 expression was barely detectable (Fig. 7E), but a small number of neurons persistently expressed Etv1, and these appeared to be medially displaced (Fig. 7I). To determine whether Brn3a null embryos exhibited a primary loss of Nurr1 expression, or a failure to maintain Nurr1, we examined earlier developmental stages. A significant population of Brn3a-immunoreactive habenular neurons are present by E12.5 (Fig. 7J). Nurr1 expression followed Brn3a expression closely, and nearly all cells marked by βgal expression in Pou4f1tLacZ/+ embryos at E12.5 also expressed Nurr1 (Fig. 7K). However, in E12.5 Pou4f1tLacZ/− embryos, there was no evidence for Nurr1 expression, demonstrating a primary failure to activate this gene (Fig. 7L).
Figure 7.

Coexpression of transcription factors regulating habenula development. Expression of Brn3a, Nurr1, and Etv1 were examined by immunofluorescence at E16.5 and E12.5. A, Diagram depicting the planes of section in subsequent views. B–E, Coexpression of Brn3a and Nurr1 in E16.5 embryos. D, Nearly all neurons that express Brn3a in the MH and LH also express Nurr1, although relative expression levels vary. E, Nurr1 is almost undetectable in the Pou4f1−/− habenula. F–I, Coexpression of Brn3a and Etv1 in E16.5 embryos. In the Pou4f1−/− habenula, a small residual population of Etv1+ neurons is noted near the ventricle. J–L, Brn3a and Nurr1 expression in early habenular neurons at E12.5. J, Expression of the tauLacZ transgene faithfully replicates the expression of Brn3a protein in the first habenular neurons to differentiate in Pou4f1tLacZ/+ embryos. K, L, All or nearly all of these neurons coexpress Nurr1 (K), and Nurr1 expression is not initiated in the absence of Brn3a (L). Scale bars: B–I, J–L, 100 μm.
Nurr1 mediates Brn3a regulation of habenular targets
The early and nearly complete loss of Nurr1 expression in the habenula of Pou4f1−/− embryos suggests that Nurr1 may mediate some of the developmental effects of Brn3a. Nurr1 is required for the normal differentiation of dopaminergic neurons of the ventral tegmentum and substantia nigra (Perlmann and Wallen-Mackenzie, 2004), but the habenula is not dopaminergic, and the role of Nurr1 in the habenula has not been described. Homozygous Nurr1 knock-out mice die in the perinatal period, but Nr4a2+/− mice are viable and fertile (Zetterstrom et al., 1997; Castillo et al., 1998). To examine Nurr1 function in habenular development, we obtained Nr4a2+/− mice that were then crossed with the Pou4f1tLacZ reporter line, and the resulting double heterozygotes were bred with Nr4a2+/− mice to generate Nr4a2+/+ and Nr4a2−/− embryos bearing the LacZ reporter allele.
We first examined the cellular phenotype of the habenula in Nr4a2−/− mice at E16.5. As in Brn3a null embryos, the projection of the FR to the ventral midbrain was grossly normal (data not shown; embryos appeared identical to Fig. 5B,C). Loss of Nurr1 expression did not replicate the defects in habenular structure and target innervation seen in Brn3a null embryos. Specifically, in Nurr1 knock-outs we did not observe the medial displacement of habenular neurons and axons noted in Brn3a mutants at E16.5 (Fig. 8A–D), nor did we observe the defects in the innervation of the IPN seen in Brn3a knock-outs at P0 (Fig. 8E,F).
Figure 8.
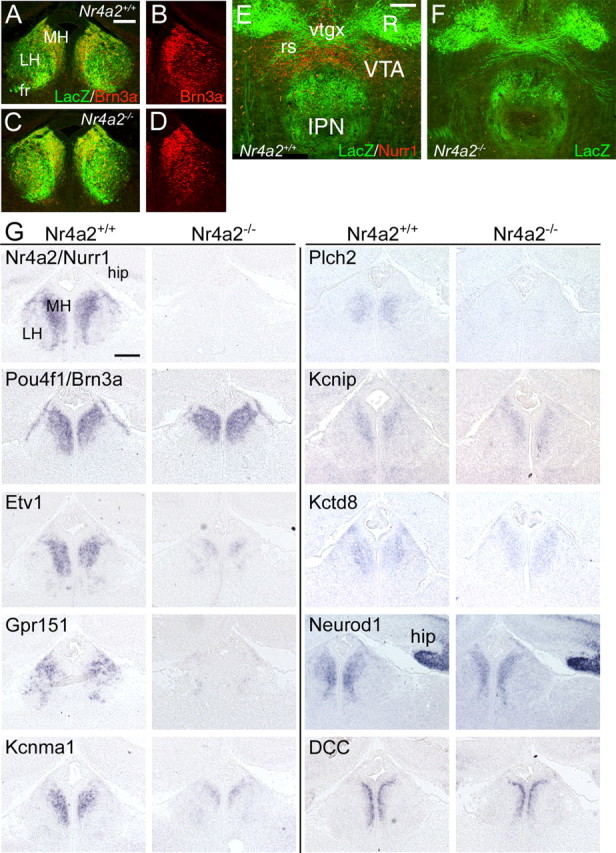
Regulation of habenular gene expression by Nurr1. A–D, Brn3a and LacZ expression in the habenula of E16.5 Nr4a2+/+ and Nr4a2−/− embryos bearing a Pou4f1tLacZ reporter allele. Neurons and axons do not display the medial displacement observed in Pou4f1−/− embryos, and Brn3a expression is not affected by the loss of Nurr1. E, F, Innervation of the IPN in P0 Nr4a2+/+ and Nr4a2−/− mice carrying a Pou4f1tLacZ reporter allele. Nurr1 expression also identifies dopaminergic neurons in the VTA adjacent to the IPN. G, Changes in gene expression in Nr4a2−/− embryos at E16.5. Nurr1 mediates a subset of the gene expression changes observed in the habenula of Brn3a null embryos. Complete gene names appear in Table 2. fr, Fasciculus retroflexus; hip, hippocampus; R, red nucleus; rs, rubrospinal tract; vtgx, ventral tegmental decussation. Scale bars: A–D, 50 μm; E, F, 100 μm; G, 100 μm.
To determine whether Nurr1 mediates some of the transcriptional effects of Brn3a, and to establish a gene regulatory pathway for the habenula, we examined the expression of key transcripts downstream of Brn3a in the habenula of Nr4a2−/− embryos at E16.5 (Fig. 8G). First, the examination of Brn3a expression in Nurr1 knock-outs revealed no change, clearly demonstrating that Nurr1 lies downstream from Brn3a in the program of habenula development. Loss of Nurr1 resulted in decreased expression of Etv1 to an extent resembling that observed in Pou4f1−/− embryos. Similarly Gpr151, Kcnma1, and Plch2 were markedly decreased in Nr4a2−/− embryos. However, Kcnip, Kctd8, and Neurod1 were minimally affected by the loss of Nurr1. Thus, Nurr1 regulates a distinct segment of the overall program of gene expression regulated by Brn3a.
Nurr1 and several downstream genes exhibit nearly complete dependence on Brn3a in the habenula. However, Brn3a expression in the superior colliculus, dorsal spinal cord, and sensory ganglia is not associated with Nurr1 or most other habenula-enriched genes. To determine whether Brn3a is sufficient to induce Nurr1 in other regions of the CNS, particularly in diencephalic areas adjacent to the habenula, we misexpressed Brn3a by electroporation in utero. To target the habenula and adjacent thalamus, a dicistronic expression plasmid encoding Brn3a and GFP (pTS-Brn3a) (supplemental Methods, available at www.jneurosci.org as supplemental material) was introduced into the third ventricle (Fig. 9A), and a pulsed electric field was applied. A vector encoding GFP alone was used as a control (Fig. 9B). Because only dividing neural precursors in the ventricular zone are accessible to electroporation, the procedure was performed at E13.5, before cell cycle exit for most habenular neurons, and the embryos were examined at E16.5, when habenular neurogenesis is mostly complete. Electroporation of Brn3a-GFP plasmid resulted in nearly 100% coexpression of GFP and Brn3a protein (Fig. 9C–F).
Ectopic expression of Brn3a failed to induce Nurr1 expression in the diencephalon, even in the periventricular thalamus adjacent to the habenula (Fig. 9G–I). Similarly, Brn3a did not induce Nurr1 in the cerebral cortex, ventral thalamus, hypothalamus, or midbrain superior colliculus (supplemental Fig. 7, available at www.jneurosci.org as supplemental material). Thus, Brn3a is necessary but not sufficient for induction of the habenula program of gene expression and is likely to act only in combination with other factors present in this domain.
Discussion
The habenula is a unique molecular territory of the CNS
The results presented here establish the habenula as a highly distinctive molecular compartment of the CNS, yet also underscore the molecular and functional heterogeneity of habenular neurons. Several of the habenula-enriched transcripts show remarkable specificity for the habenula, with little or no expression elsewhere in the mature CNS. Some of these include the orphan 7-transmembrane receptor Gpr151, which may be a galanin receptor (Vassilatis et al., 2003; Ignatov et al., 2004); Tmem16a, recently shown to be a Ca2+-dependent chloride channel (Caputo et al., 2008; Schroeder et al., 2008); the serotonin receptor Htr5b; the acetylcholine receptor subunit Chrnb4; and the potassium channel interacting protein Kctd8, which is known to be a habenula marker in lower vertebrates (Gamse et al., 2005). Numerous other transcripts are expressed in the habenula and a very limited number of other CNS regions.
We did not identify any transcript that was expressed throughout the entire MH and LH, and also distinguished the habenula from other diencephalic or telencephalic regions, indicating that the habenula, as a whole, is an anatomical rather than a functional domain. However, Brn3a and several other genes were expressed throughout the MH and also in a subset of LH neurons. The Brn3a-expressing neurons of the MH and LH are functionally related in that they all appear to project to the IPN via the FR and do not contribute to the previously characterized direct LH projections to the midbrain monoaminergic nuclei including the SNc, VTA, and raphe (Sutherland, 1982; Lecourtier and Kelly, 2007). Thus, Brn3a identifies, along with several other markers, an unrecognized set of LH neurons that share gene expression and connectivity characteristics with the MH.
Previous studies have defined subdomains of the MH based on the dorsal and ventral expression of Tac1 (substance P) and ChAT (choline acetyltransferase), respectively (Contestabile et al., 1987). Recent work has shown that the MH neurons projecting to the IPN neurons also express glutamatergic markers (Qin and Luo, 2009). It has also been shown that the dorsal MH projects predominantly to the lateral subnucleus of the IPN and the ventral MH to central and intermediate subnuclei of the IPN (Kawaja et al., 1988). The expression patterns of habenula-enriched transcripts in the ABA data set (supplemental Table 2, Figs. 2, 3, available at www.jneurosci.org as supplemental material) strongly support the division of the MH into dorsal and ventral subnuclei, although many more ventral-specific transcripts were identified than dorsal. Several of the ventral-specific transcripts are clearly linked to cholinergic pathways (ChAT, Slc18a3, Chrnb4, Chrna3), but several have other or unknown functions, including the receptors Gpr151, Npr1, and Tacr1, and molecules of diverse function including Ctnnbip1, Prkcq, Robo3, and Tmem16a.
A series of studies in the rat have defined up to 10 subnuclei of the LH based on morphology and immunohistochemistry for a set of molecular markers (Geisler et al., 2003). The expression patterns of a number of transcripts in the LH, examined here and in the ABA data, appear to support a division into lateral and medial subnuclei (e.g., Pou4f1, Gpr151, and Efcpb2, which are expressed in the lateral part of the LH and the MH). However, evidence for a finer subnuclear structure is not immediately evident and will require simultaneous examination of multiple markers and a careful distinction between signals derived from resident neurons and afferent fibers.
In the present study, microarray and bioinformatic approaches to habenula-specific gene expression were highly concordant. Future bioinformatic searches for transcripts expressed in specific brain regions will be greatly facilitated by the recently developed Anatomic Gene Expression Atlas (AGEA; http://mouse.brain-map.org/agea) (Ng et al., 2009), a relational atlas of the mouse brain computationally derived from the ABA ISH image data. AGEA supports the generation of neuroanatomical maps based on related patterns of gene expression rather than traditional structural boundaries, using either three-dimensional spatial correlation or a hierarchical transcriptome-based parcellation of the brain. A search facility allows the retrieval of lists of genes exhibiting enriched expression in local correlated domains. AGEA analysis of the habenula identifies a majority of the habenula-enriched transcripts described here and supports the conclusion that the habenula is a distinct domain of the CNS with respect to gene expression.
A hallmark of the habenula in fish, amphibians, and reptiles is bilaterally asymmetrical morphology (Concha and Wilson, 2001; Halpern et al., 2003), connectivity (Aizawa et al., 2005), gene expression (Gamse et al., 2005), and timing of neurogenesis (Aizawa et al., 2007), but this asymmetry has not been demonstrated in birds and mammals. Brn3a is symmetrically expressed in the zebrafish habenula (Aizawa et al., 2007) and is not likely to participate in the generation of these asymmetrical features. Members of the KCTD family, related to murine Kctd8, which has been identified here as downstream of Brn3a and Nurr1, are asymmetrically expressed in the zebrafish habenula (Gamse et al., 2005). The zebrafish neuropilin, Nrp1a, is also expressed asymmetrically and interacts with members of the Sema3 family to establish and refine asymmetrical habenulopeduncular projections (Kuan et al., 2007), clearly using some of the same molecular pathways used for FR axon guidance in mice (Kantor et al., 2004). No lateral asymmetry in expression was observed for any of the habenula-enriched transcripts identified here by microarray or bioinformatic analysis, including Kctd8 and Nrp2, but the methods used here cannot rule out subtle differences in the extent or intensity of gene expression between the left and right habenulae.
A developmental pathway for the mammalian habenula
Microarray results for Pou4f1−/− embryos demonstrate that Brn3a is required for the coordinated expression of a battery of genes that characterize the habenula. The majority of the regulated genes are highly enriched in the habenula, and none are “housekeeping” genes or genes encoding generic neuronal factors. These Brn3a-regulated genes include transcription factors, components of neurotransmitter systems, K+ and Ca2+ channels, and mediators of intracellular signal transduction.
Previous work has established neuropilin/semaphorin and netrin signaling mechanisms in the guidance of the FR (Funato et al., 2000; Giger et al., 2000; Kantor et al., 2004). Nrp2 transcripts are highly enriched in E16.5 habenula but are not changed in Pou4f1−/− embryos. This is consistent with the normal initial trajectory and fasciculation of the FR in Brn3a knock-outs and suggests that these pathways are independent of Brn3a.
Nurr1 is clearly downstream of Brn3a in a regulatory hierarchy, as Nurr1 expression is lost from the onset of its expression in Pou4f1−/− embryos, but Brn3a expression is maintained in Nr4a2−/− mice. Nurr1 mediates the expression of a distinct subset of the genes downstream of Brn3a, including the ets-domain transcription factor Etv1 and the effectors of neural function Gpr151, Plch2, and Kcnma1. In contrast, the Brn3a targets Kcnip, Kctd8, and Neurod1 were not significantly decreased in Nr4a2−/− embryos. These examples are not sufficient to determine whether Nurr1-dependent and -independent habenula transcripts belong to distinct functional categories. However, loss of Nurr1 does not produce the severe defect in the innervation of the IPN seen in Pou4f1−/− embryos, suggesting that some critical factors mediating the interaction of habenular axons with their targets are Brn3a dependent but Nurr1 independent.
Tissue-specific developmental roles for Brn3a
One objective of the current study was to determine whether Brn3a regulates conserved target genes in the sensory nervous system and CNS. In previous studies, we have shown that in the trigeminal and dorsal root ganglia, Brn3a represses the expression of transcription factors characteristic of early sensory neurogenesis, such as Neurog1, Neurod1, Neurod4 (Math3), and Tcfap2b (Eng et al., 2004, 2007). Brn3a has also been shown to bind directly to Neurod1 and Neurod4 regulatory sequences in the developing trigeminal ganglion (Lanier et al., 2007). In the sensory ganglia, the set of transcripts that are positively regulated by Brn3a (decreased in the knock-out) are expressed later and associated with the differentiation of specific sensory subtypes.
In contrast to sensory neurons, in the habenula Brn3a appears to function almost exclusively as a transcriptional activator. Few transcripts exhibit increased expression in the habenula of Pou4f1−/− embryos, and the changes are of small magnitude and may be indirect, effectively ruling out a repressor role analogous to the sensory system. The context-dependent function of Brn3a is illustrated by its effects on Neurod1, one of the few identified target genes in common between the habenula and sensory ganglia, which is repressed by Brn3a in the sensory ganglia and activated in the habenula. The apparent lack of a repressor role for Brn3a in the habenula may be related to the distinct timing of Brn3a expression in the CNS and sensory system. In the CNS, Brn3a is expressed only in postmitotic neurons, whereas in the peripheral sensory system its expression is initiated before cell-cycle exit (Fedtsova and Turner, 1995), consistent with a model in which the repression of early neurogenic genes is exclusively a sensory function of Brn3a.
Even when only positively regulated target genes are considered, there is little overlap between the gene expression program regulated by Brn3a in the habenula and sensory system. The majority of Brn3a-regulated targets in the habenula are preferentially expressed there and are not expressed in developing sensory neurons. Conversely, the majority of genes that require Brn3a for their expression in sensory neurons are not expressed in the habenula, and it is rarely, if ever, the case that a transcript is expressed in both tissues and regulated in just one. There is also limited overlap between the regulatory targets of Brn3a in the habenula and the extensive set of downstream targets defined for the closely related factor Brn3b in the retina (Mu et al., 2004, 2008; Qiu et al., 2008).
Much less is known about the downstream targets of Nurr1, which has been characterized mainly with respect to its role in the differentiation of midbrain dopaminergic neurons (Perlmann and Wallen-Mackenzie, 2004). Because the specific genes downstream of Nurr1 identified here, such as Gpr151, Kcnma1, and Etv1, are not expressed in the VTA or substantia nigra, the targets of Nurr1 regulation in the midbrain and the habenula are probably distinct.
How these or any transcription factors regulate different sets of downstream targets in different tissues remains mostly unknown. It is likely that in each cell type, Brn3a and Nurr1 act combinatorially to exert their effects and may have different DNA binding partners or cofactors in different tissues. However, recently we also have shown that the binding of Brn3a to high-affinity sites in vivo is restricted to regions of transcriptionally active chromatin, characterized by histone H3-K9/14 acetylation and H3-K4 methylation (Lanier et al., 2007). This suggests a model in which Brn3a cannot interact with large segments of the genome, and its tissue-specific effects are determined in part by uniquely accessible subsets of potential target genes in each cell type.
Footnotes
This work was supported in part by Department of Veterans Affairs MERIT funding and National Institutes of Health Grants HD33442 and MH065496 (E.E.T.). E.E.T. is a National Alliance for Research on Schizophrenia and Depression Investigator. We thank Drs. Geraldine Kerjan and Joe Gleeson for help with developing protocols for electroporation in utero. We also thank Drs. Thomas Perlmann, Fujio Murakami, Yasushi Nakagawa, Sylvia Arber, and Carmen Birchmeier for their generous gifts of antisera; and Drs. Qiufu Ma and Keijo Luukko for ISH probes. We are also indebted to Dr. Vera Nikodem for providing Nurr1 knock-out mice, Dr. William Wachsman and Lutfunnessa Shireen of the University of California, San Diego/Veterans Affairs microarray core facility for assistance with microarray technology, and Gian Carlo Parico for technical assistance. Mouse monoclonal antibodies were obtained from the Developmental Studies Hybridoma Bank, maintained under contract 758 NO1-HD23144 from the National Institute of Child Health and Human Development.
References
- Aizawa H, Bianco IH, Hamaoka T, Miyashita T, Uemura O, Concha ML, Russell C, Wilson SW, Okamoto H. Laterotopic representation of left-right information onto the dorso-ventral axis of a zebrafish midbrain target nucleus. Curr Biol. 2005;15:238–243. doi: 10.1016/j.cub.2005.01.014. [DOI] [PMC free article] [PubMed] [Google Scholar]
- Aizawa H, Goto M, Sato T, Okamoto H. Temporally regulated asymmetric neurogenesis causes left-right difference in the zebrafish habenular structures. Dev Cell. 2007;12:87–98. doi: 10.1016/j.devcel.2006.10.004. [DOI] [PubMed] [Google Scholar]
- Andres KH, von During M, Veh RW. Subnuclear organization of the rat habenular complexes. J Comp Neurol. 1999;407:130–150. doi: 10.1002/(sici)1096-9861(19990428)407:1<130::aid-cne10>3.0.co;2-8. [DOI] [PubMed] [Google Scholar]
- Arber S, Ladle DR, Lin JH, Frank E, Jessell TM. ETS gene Er81 controls the formation of functional connections between group Ia sensory afferents and motor neurons. Cell. 2000;101:485–498. doi: 10.1016/s0092-8674(00)80859-4. [DOI] [PubMed] [Google Scholar]
- Caputo A, Caci E, Ferrera L, Pedemonte N, Barsanti C, Sondo E, Pfeffer U, Ravazzolo R, Zegarra-Moran O, Galietta LJ. TMEM16A, a membrane protein associated with calcium-dependent chloride channel activity. Science. 2008;322:590–594. doi: 10.1126/science.1163518. [DOI] [PubMed] [Google Scholar]
- Castillo SO, Baffi JS, Palkovits M, Goldstein DS, Kopin IJ, Witta J, Magnuson MA, Nikodem VM. Dopamine biosynthesis is selectively abolished in substantia nigra/ventral tegmental area but not in hypothalamic neurons in mice with targeted disruption of the Nurr1 gene. Mol Cell Neurosci. 1998;11:36–46. doi: 10.1006/mcne.1998.0673. [DOI] [PubMed] [Google Scholar]
- Concha ML, Wilson SW. Asymmetry in the epithalamus of vertebrates. J Anat. 2001;199:63–84. doi: 10.1046/j.1469-7580.2001.19910063.x. [DOI] [PMC free article] [PubMed] [Google Scholar]
- Concha ML, Russell C, Regan JC, Tawk M, Sidi S, Gilmour DT, Kapsimali M, Sumoy L, Goldstone K, Amaya E, Kimelman D, Nicolson T, Grunder S, Gomperts M, Clarke JD, Wilson SW. Local tissue interactions across the dorsal midline of the forebrain establish CNS laterality. Neuron. 2003;39:423–438. doi: 10.1016/s0896-6273(03)00437-9. [DOI] [PubMed] [Google Scholar]
- Contestabile A, Flumerfelt BA. Afferent connections of the interpeduncular nucleus and the topographic organization of the habenulo-interpeduncular pathway: an HRP study in the rat. J Comp Neurol. 1981;196:253–270. doi: 10.1002/cne.901960206. [DOI] [PubMed] [Google Scholar]
- Contestabile A, Villani L, Fasolo A, Franzoni MF, Gribaudo L, Oktedalen O, Fonnum F. Topography of cholinergic and substance P pathways in the habenulo-interpeduncular system of the rat. An immunocytochemical and microchemical approach. Neuroscience. 1987;21:253–270. doi: 10.1016/0306-4522(87)90337-x. [DOI] [PubMed] [Google Scholar]
- Dong HW. Hoboken, NJ: Wiley; 2007. Allen reference atlas : a digital color brain atlas of the C57Black/6J male mouse. [Google Scholar]
- Eng SR, Lanier J, Fedtsova N, Turner EE. Coordinated regulation of gene expression by Brn3a in developing sensory ganglia. Development. 2004;131:3859–3870. doi: 10.1242/dev.01260. [DOI] [PubMed] [Google Scholar]
- Eng SR, Dykes IM, Lanier J, Fedtsova N, Turner EE. POU-domain factor Brn3a regulates both distinct and common programs of gene expression in the spinal and trigeminal sensory ganglia. Neural Dev. 2007;2:3. doi: 10.1186/1749-8104-2-3. [DOI] [PMC free article] [PubMed] [Google Scholar]
- Fedtsova N, Turner E. Brn-3.0 expression identifies early post-mitotic CNS neurons and sensory neural precursors. Mech Dev. 1995;53:291–304. doi: 10.1016/0925-4773(95)00435-1. [DOI] [PubMed] [Google Scholar]
- Fedtsova N, Quina LA, Wang S, Turner EE. Regulation of the development of tectal neurons and their projections by transcription factors Brn3a and Pax7. Dev Biol. 2008;316:6–20. doi: 10.1016/j.ydbio.2007.12.040. [DOI] [PMC free article] [PubMed] [Google Scholar]
- Funato H, Saito-Nakazato Y, Takahashi H. Axonal growth from the habenular nucleus along the neuromere boundary region of the diencephalon is regulated by semaphorin 3F and netrin-1. Mol Cell Neurosci. 2000;16:206–220. doi: 10.1006/mcne.2000.0870. [DOI] [PubMed] [Google Scholar]
- Gamse JT, Thisse C, Thisse B, Halpern ME. The parapineal mediates left-right asymmetry in the zebrafish diencephalon. Development. 2003;130:1059–1068. doi: 10.1242/dev.00270. [DOI] [PubMed] [Google Scholar]
- Gamse JT, Kuan YS, Macurak M, Brosamle C, Thisse B, Thisse C, Halpern ME. Directional asymmetry of the zebrafish epithalamus guides dorsoventral innervation of the midbrain target. Development. 2005;132:4869–4881. doi: 10.1242/dev.02046. [DOI] [PubMed] [Google Scholar]
- Geisler S, Andres KH, Veh RW. Morphologic and cytochemical criteria for the identification and delineation of individual subnuclei within the lateral habenular complex of the rat. J Comp Neurol. 2003;458:78–97. doi: 10.1002/cne.10566. [DOI] [PubMed] [Google Scholar]
- Giger RJ, Cloutier JF, Sahay A, Prinjha RK, Levengood DV, Moore SE, Pickering S, Simmons D, Rastan S, Walsh FS, Kolodkin AL, Ginty DD, Geppert M. Neuropilin-2 is required in vivo for selective axon guidance responses to secreted semaphorins. Neuron. 2000;25:29–41. doi: 10.1016/s0896-6273(00)80869-7. [DOI] [PubMed] [Google Scholar]
- Gruber C, Rhee J, Gleiberman A, Turner E. POU-domain factors of the Brn-3 class recognize functional DNA elements which are distinctive, symmetrical, and highly conserved in evolution. Mol Cell Biol. 1997;17:2391–2400. doi: 10.1128/mcb.17.5.2391. [DOI] [PMC free article] [PubMed] [Google Scholar]
- Halpern ME, Liang JO, Gamse JT. Leaning to the left: laterality in the zebrafish forebrain. Trends Neurosci. 2003;26:308–313. doi: 10.1016/S0166-2236(03)00129-2. [DOI] [PubMed] [Google Scholar]
- Herkenham M, Nauta WJ. Efferent connections of the habenular nuclei in the rat. J Comp Neurol. 1979;187:19–47. doi: 10.1002/cne.901870103. [DOI] [PubMed] [Google Scholar]
- Hikosaka O, Sesack SR, Lecourtier L, Shepard PD. Habenula: crossroad between the basal ganglia and the limbic system. J Neurosci. 2008;28:11825–11829. doi: 10.1523/JNEUROSCI.3463-08.2008. [DOI] [PMC free article] [PubMed] [Google Scholar]
- Ignatov A, Hermans-Borgmeyer I, Schaller HC. Cloning and characterization of a novel G-protein-coupled receptor with homology to galanin receptors. Neuropharmacology. 2004;46:1114–1120. doi: 10.1016/j.neuropharm.2004.02.004. [DOI] [PubMed] [Google Scholar]
- Kantor DB, Chivatakarn O, Peer KL, Oster SF, Inatani M, Hansen MJ, Flanagan JG, Yamaguchi Y, Sretavan DW, Giger RJ, Kolodkin AL. Semaphorin 5A is a bifunctional axon guidance cue regulated by heparan and chondroitin sulfate proteoglycans. Neuron. 2004;44:961–975. doi: 10.1016/j.neuron.2004.12.002. [DOI] [PubMed] [Google Scholar]
- Kawaja MD, Flumerfelt BA, Hrycyshyn AW. Topographical and ultrastructural investigation of the habenulo-interpeduncular pathway in the rat: a wheat germ agglutinin-horseradish peroxidase anterograde study. J Comp Neurol. 1988;275:117–127. doi: 10.1002/cne.902750110. [DOI] [PubMed] [Google Scholar]
- Klemm WR. Habenular and interpeduncularis nuclei: shared components in multiple-function networks. Med Sci Monit. 2004;10:RA261–RA273. [PubMed] [Google Scholar]
- Kuan YS, Yu HH, Moens CB, Halpern ME. Neuropilin asymmetry mediates a left-right difference in habenular connectivity. Development. 2007;134:857–865. doi: 10.1242/dev.02791. [DOI] [PubMed] [Google Scholar]
- Lanier J, Quina LA, Eng SR, Cox E, Turner EE. Brn3a target gene recognition in embryonic sensory neurons. Dev Biol. 2007;302:703–716. doi: 10.1016/j.ydbio.2006.10.050. [DOI] [PMC free article] [PubMed] [Google Scholar]
- Lecourtier L, Kelly PH. A conductor hidden in the orchestra? Role of the habenular complex in monoamine transmission and cognition. Neurosci Biobehav Rev. 2007;31:658–672. doi: 10.1016/j.neubiorev.2007.01.004. [DOI] [PubMed] [Google Scholar]
- Lein ES, Hawrylycz MJ, Ao N, Ayres M, Bensinger A, Bernard A, Boe AF, Boguski MS, Brockway KS, Byrnes EJ, Chen L, Chen TM, Chin MC, Chong J, Crook BE, Czaplinska A, Dang CN, Datta S, Dee NR, Desaki AL, et al. Genome-wide atlas of gene expression in the adult mouse brain. Nature. 2007;445:168–176. doi: 10.1038/nature05453. [DOI] [PubMed] [Google Scholar]
- Mu X, Beremand PD, Zhao S, Pershad R, Sun H, Scarpa A, Liang S, Thomas TL, Klein WH. Discrete gene sets depend on POU domain transcription factor Brn3b/Brn-3.2/POU4f2 for their expression in the mouse embryonic retina. Development. 2004;131:1197–1210. doi: 10.1242/dev.01010. [DOI] [PubMed] [Google Scholar]
- Mu X, Fu X, Beremand PD, Thomas TL, Klein WH. Gene regulation logic in retinal ganglion cell development: Isl1 defines a critical branch distinct from but overlapping with Pou4f2. Proc Natl Acad Sci U S A. 2008;105:6942–6947. doi: 10.1073/pnas.0802627105. [DOI] [PMC free article] [PubMed] [Google Scholar]
- Ng L, Pathak SD, Kuan C, Lau C, Dong H, Sodt A, Dang C, Avants B, Yushkevich P, Gee JC, Haynor D, Lein E, Jones A, Hawrylycz M. Neuroinformatics for genome-wide 3D gene expression mapping in the mouse brain. IEEE/ACM Trans Comput Biol Bioinform. 2007;4:382–393. doi: 10.1109/tcbb.2007.1035. [DOI] [PubMed] [Google Scholar]
- Ng L, Bernard A, Lau C, Overly CC, Dong HW, Kuan C, Pathak S, Sunkin SM, Dang C, Bohland JW, Bokil H, Mitra PP, Puelles L, Hohmann J, Anderson DJ, Lein ES, Jones AR, Hawrylycz M. An anatomic gene expression atlas of the adult mouse brain. Nat Neurosci. 2009;12:356–362. doi: 10.1038/nn.2281. [DOI] [PubMed] [Google Scholar]
- Perlmann T, Wallen-Mackenzie A. Nurr1, an orphan nuclear receptor with essential functions in developing dopamine cells. Cell Tissue Res. 2004;318:45–52. doi: 10.1007/s00441-004-0974-7. [DOI] [PubMed] [Google Scholar]
- Qin C, Luo M. Neurochemical phenotypes of the afferent and efferent projections of the mouse medial habenula. Neuroscience. 2009;161:827–837. doi: 10.1016/j.neuroscience.2009.03.085. [DOI] [PubMed] [Google Scholar]
- Qiu F, Jiang H, Xiang M. A comprehensive negative regulatory program controlled by Brn3b to ensure ganglion cell specification from multipotential retinal precursors. J Neurosci. 2008;28:3392–3403. doi: 10.1523/JNEUROSCI.0043-08.2008. [DOI] [PMC free article] [PubMed] [Google Scholar]
- Quina LA, Pak W, Lanier J, Banwait P, Gratwick K, Liu Y, Velasquez T, O'Leary DD, Goulding M, Turner EE. Brn3a-expressing retinal ganglion cells project specifically to thalamocortical and collicular visual pathways. J Neurosci. 2005;25:11595–11604. doi: 10.1523/JNEUROSCI.2837-05.2005. [DOI] [PMC free article] [PubMed] [Google Scholar]
- Roussigne M, Bianco IH, Wilson SW, Blader P. Nodal signalling imposes left-right asymmetry upon neurogenesis in the habenular nuclei. Development. 2009;136:1549–1557. doi: 10.1242/dev.034793. [DOI] [PMC free article] [PubMed] [Google Scholar]
- Saito T. In vivo electroporation in the embryonic mouse central nervous system. Nat Protoc. 2006;1:1552–1558. doi: 10.1038/nprot.2006.276. [DOI] [PubMed] [Google Scholar]
- Schroeder BC, Cheng T, Jan YN, Jan LY. Expression cloning of TMEM16A as a calcium-activated chloride channel subunit. Cell. 2008;134:1019–1029. doi: 10.1016/j.cell.2008.09.003. [DOI] [PMC free article] [PubMed] [Google Scholar]
- Shibata H, Suzuki T. Efferent projections of the interpeduncular complex in the rat, with special reference to its subnuclei: a retrograde horseradish peroxidase study. Brain Res. 1984;296:345–349. doi: 10.1016/0006-8993(84)90071-4. [DOI] [PubMed] [Google Scholar]
- Storm R, Cholewa-Waclaw J, Reuter K, Brohl D, Sieber M, Treier M, Muller T, Birchmeier C. The bHLH transcription factor Olig3 marks the dorsal neuroepithelium of the hindbrain and is essential for the development of brainstem nuclei. Development. 2009;136:295–305. doi: 10.1242/dev.027193. [DOI] [PubMed] [Google Scholar]
- Sutherland RJ. The dorsal diencephalic conduction system: a review of the anatomy and functions of the habenular complex. Neurosci Biobehav Rev. 1982;6:1–13. doi: 10.1016/0149-7634(82)90003-3. [DOI] [PubMed] [Google Scholar]
- Tamada A, Kumada T, Zhu Y, Matsumoto T, Hatanaka Y, Muguruma K, Chen Z, Tanabe Y, Torigoe M, Yamauchi K, Oyama H, Nishida K, Murakami F. Crucial roles of Robo proteins in midline crossing of cerebellofugal axons and lack of their up-regulation after midline crossing. Neural Dev. 2008;3:29. doi: 10.1186/1749-8104-3-29. [DOI] [PMC free article] [PubMed] [Google Scholar]
- Vassilatis DK, Hohmann JG, Zeng H, Li F, Ranchalis JE, Mortrud MT, Brown A, Rodriguez SS, Weller JR, Wright AC, Bergmann JE, Gaitanaris GA. The G protein-coupled receptor repertoires of human and mouse. Proc Natl Acad Sci U S A. 2003;100:4903–4908. doi: 10.1073/pnas.0230374100. [DOI] [PMC free article] [PubMed] [Google Scholar]
- Vue TY, Aaker J, Taniguchi A, Kazemzadeh C, Skidmore JM, Martin DM, Martin JF, Treier M, Nakagawa Y. Characterization of progenitor domains in the developing mouse thalamus. J Comp Neurol. 2007;505:73–91. doi: 10.1002/cne.21467. [DOI] [PubMed] [Google Scholar]
- Wallen AA, Castro DS, Zetterstrom RH, Karlen M, Olson L, Ericson J, Perlmann T. Orphan nuclear receptor Nurr1 is essential for Ret expression in midbrain dopamine neurons and in the brain stem. Mol Cell Neurosci. 2001;18:649–663. doi: 10.1006/mcne.2001.1057. [DOI] [PubMed] [Google Scholar]
- Xiang M, Lin G, Zhou L, Klein WH, Nathans J. Targeted deletion of the mouse POU-domain gene Brn-3a causes a selective loss of neurons in the brainstem and trigeminal ganglion, uncoordinated limb movement, and impaired suckling. Proc Natl Acad Sci U S A. 1996;93:11950–11955. doi: 10.1073/pnas.93.21.11950. [DOI] [PMC free article] [PubMed] [Google Scholar]
- Zetterstrom RH, Solomin L, Jansson L, Hoffer BJ, Olson L, Perlmann T. Dopamine neuron agenesis in Nurr1-deficient mice. Science. 1997;276:248–250. doi: 10.1126/science.276.5310.248. [DOI] [PubMed] [Google Scholar]