The crystallization and initial X-ray diffraction of REV7 in complex with REV3 is reported.
Keywords: REV7, REV3, DNA polymerases
Abstract
REV7 is involved in various cellular functions including DNA replication, signal transduction and cell-cycle regulation. In DNA replication, REV7 interacts with REV3 and forms DNA polymerase ζ, which plays a central role in error-prone DNA synthesis. REV3 is a catalytic subunit and its activity is stimulated by REV7. To clarify the structural basis of the interaction between REV7 and REV3, human REV7 was crystallized in complex with a REV3 fragment. Two crystal forms were obtained. Crystal forms I and II belonged to space groups P21, with unit-cell parameters a = 43.8, b = 50.0, c = 107.3 Å, β = 96.9°, and P41212 or P43212, with unit-cell parameters a = b = 76.6, c = 118.4 Å, respectively.
1. Introduction
REV7 is a member of the HORMA-domain-containing family of proteins, which is composed of Hop1, REV7 and MAD2, and is a conserved protein in eukaryotes (Aravind & Koonin, 1998 ▶). REV7, which is alternatively known as MAD2B or MAD2L2, is involved in various cellular functions including DNA replication, signal transduction and cell-cycle regulation (Nelson et al., 1996 ▶; Chen & Fang, 2001 ▶; Zhang et al., 2007 ▶; Iwai et al., 2007 ▶; Hong et al., 2009 ▶). In DNA replication, REV7 interacts with REV3 and forms DNA polymerase ζ (Polζ; Nelson et al., 1996 ▶), which plays a central role in error-prone DNA synthesis in translesion synthesis (TLS) induced by DNA damage and spontaneous hypermutation. REV3 is the catalytic subunit of Polζ and is classified into the B family of DNA polymerases. The polymerase activity of REV3 is stimulated by REV7 (Nelson et al., 1996 ▶). Consistent with this, yeast rev3 or rev7 mutants show a defect in DNA damage-induced mutagenesis (Lawrence & Christensen, 1979 ▶, 1982 ▶; Lawrence et al., 1985 ▶). Although a yeast rev3 mutant was viable, disruption of the mouse rev3 gene caused embryonic lethality accompanied by massive apoptosis (Wittschieben et al., 2000 ▶), suggesting that mammalian Polζ is indispensable for embryogenesis in early development. Interestingly, human REV7 interacts with the C-terminal region of REV1 (Murakumo et al., 2001 ▶), which is one of the error-prone DNA polymerases classified into the Y family of DNA polymerases (Ohmori et al., 2001 ▶). REV1 is also involved in TLS. In contrast to REV3, REV7 does not affect the polymerase activity of REV1 in vitro (Masuda et al., 2003 ▶) and therefore the cellular function of the interaction between REV7 and REV1 is unknown.
REV7 is also involved in signal transduction and cell-cycle regulation. In the MAPK cascade, REV7 interacts with both the transcription factor Elk1 and the c-Jun N-terminal kinase (JNK) and stimulates the transcription activity of Elk1 (Zhang et al., 2007 ▶). In the Wnt pathway, REV7 interacts with T-cell factor 4 (TCF4) and activates TCF4-mediated E-cadherin expression, resulting in the regulation of cancer progression (Hong et al., 2009 ▶). In the cell cycle, REV7 inhibits the anaphase-promoting complex (APC) by interacting with CDH1 (Chen & Fang, 2001 ▶). Furthermore, the Shigella effector IpaB interacts with REV7. APC therefore undergoes unscheduled activation arising from the interaction between IpaB and REV7 and Shigella thus efficiently infects the intestinal epithelium (Iwai et al., 2007 ▶).
As mentioned above, REV7 plays crucial roles in various cellular functions. However, the three-dimensional structure of REV7 and the mechanism of REV7 interaction are still unclear. In the present work, human REV7 in complex with a human REV3 fragment was overexpressed, purified and crystallized in order to clarify the structural basis of the REV7-mediated interaction. Human REV7 and REV3 are composed of 211 amino-acid residues with a molecular weight of 24 kDa and 3130 amino-acid residues with a molecular weight of 353 kDa, respectively. Human REV7 interacts with the central region of human REV3 (Murakumo et al., 2000 ▶, 2001 ▶). Based on previous reports, a REV3 fragment (residues 1847–1898) was used in this crystallographic study. Hereafter, human REV7 in complex with the human REV3 fragment (residues 1847–1898) is abbreviated REV7–REV3 unless noted otherwise.
2. Materials and results
2.1. Preparation of REV7–REV3 suitable for crystallographic studies
The cDNAs encoding human REV7 and REV3 fragment (residues 1847–1898) were inserted into pETDuet-1 vector (Novagen) at the EcoRI–PstI and NdeI–XhoI sites, respectively. The plasmid encodes REV7 with an N-terminal hexameric His tag and the REV3 fragment. REV7–REV3 was purified using the following procedure. The expression vector was introduced into Escherichia coli BL21 (DE3). The cells were grown at 310 K to a cell density of 0.6–0.8 at 660 nm and grown for a further 6 h at 298 K after the addition of 1 mM isopropyl β-d-1-thiogalactopyranoside (IPTG). The harvested cells were suspended in lysis buffer (50 mM HEPES–NaOH pH 7.4, 500 mM NaCl and 20 mM imidazole) and disrupted by sonication. After centrifugation, the supernatant was applied onto Ni-Sepharose resin (GE Healthcare). The bound proteins were eluted with 50 mM HEPES–NaOH pH 7.4, 100 mM NaCl and 150 mM imidazole and applied onto a HiTrap Q HP column (GE Healthcare) equilibrated with 50 mM Tris–HCl pH 8.5 and 50 mM NaCl. The bound proteins were eluted with a linear gradient from 50 to 600 mM NaCl. Fractions containing REV7–REV3 were applied onto a HiLoad Superdex 200 column (GE Healthcare) equilibrated with 5 mM HEPES–NaOH pH 7.4, 100 mM NaCl and 10 mM DTT. Screening of crystallization conditions for the REV7–REV3 complex was performed by the sitting-drop vapour-diffusion method using a Hydra II Plus One system (Matrix) and various commercially available screening kits (Hampton Research, Molecular Dimensions, Emerald BioSystems and Qiagen). However, no crystals of REV7–REV3 were obtained.
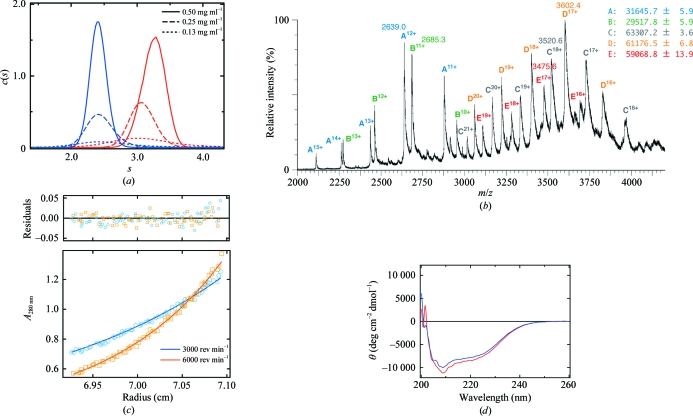
Size-exclusion chromatography (SEC) analysis suggested that REV7–REV3 formed at least a dimeric complex (REV7–REV3)2. To investigate the properties of purified REV7–REV3 in solution, sedimentation-velocity and sedimentation-equilibrium experiments were performed using an Optima XL-I analytical ultracentrifuge and an An-50 Ti rotor (Beckman Coulter) at 293 K. The concentrations of the loaded protein solutions in the sedimentation-velocity experiment were 0.13, 0.25 and 0.50 mg ml−1 in reference buffer (5 mM HEPES–NaOH pH 7.4 and 100 mM NaCl). Absorbance (OD280) scans were collected during sedimentation at 50 000 rev min−1. Data analysis was performed with the programs SEDIFIT (Schuck, 2000 ▶; Schuck et al., 2002 ▶) and SEDNTERP (Laue et al., 1992 ▶). Sedimentation-equilibrium experiments were performed in a six-channel centrepiece with quartz windows. The concentrations of the loaded protein solutions were 0.2, 0.4 and 1.0 mg ml−1 in reference buffer. Data were obtained at 3000 and 6000 rev min−1. Data analysis was performed by global analysis using the program ULTRASPIN (MRC Centre for Protein Engineering, Cambridge, England; http://www.mrc-lmb.cam.ac.uk/dbv/ultraspin2/). Sedimentation-velocity analysis showed that REV7–REV3 oligomerizes with concentration dependence (Fig. 1 ▶ a).
Figure 1.
(a) Sedimentation-velocity analyses of REV7WT–REV3 and REV7R124A–REV3. The sedimentation-coefficient distributions of REV7WT–REV3 and REV7R124A–REV3 are shown by red and blue lines, respectively. (b) NanoESI mass spectrum of REV7WT–REV3. The mass spectrum reveals that the N-terminal methionine or 20 N-terminal residues of REV7 are cleaved; thus, two kinds of REV7–REV3 monomer complexes are detected, corresponding to A and B. Therefore, three kinds of (REV7–REV3)2 dimer complexes (AA, AB and BB) are also detected, corresponding to C, D and E, respectively. (c) Sedimentation-equilibrium analysis of REV7WT–REV3. Sedimentation-equilibrium data is shown with the residuals from the best fit to a monomer–dimer self-association model. The plots show data for REV7WT–REV3 at 1.0 mg ml−1 and 3000 or 6000 rev min−1. (d) CD spectra. The CD spectra of REV7WT–REV3 and REV7R124A–REV3 are shown by a red and a blue line, respectively.
Furthermore, Nanoflow ESI (nanoESI) mass spectra of REV7–REV3 were acquired using a Q-TOF 2 mass spectrometer (Waters). The concentration of the protein solution was adjusted to 50 µM in 100 mM ammonium acetate pH 7.4. The spectra were calibrated with (CsI)nCs+ ions from m/z 2000 to 6000. The program MassLynx v.3.5 (Waters) was used for data processing and peak integration. The temperature of the ion source was set to 353 K. A 5 µl aliquot of the sample solution was placed in a Waters nanospray tip and electrosprayed with an applied capillary voltage of 0.8 kV. The pressure in the quadrupole ion guide of the Q-TOF 2 was adjusted to 8 × 10⁻³ Pa by throttling down the Speedivalve fitted to the rotary pump. Each spectrum was acquired in 2 s and >20 spectra were accumulated and smoothed using the Savitzky–Golay method. A nanoESI–MS experiment revealed that REV7–REV3 forms a (REV7–REV3)2 dimer complex, although truncation of the N-terminus of REV7 was observed (Fig. 1 ▶ b). A monomer–dimer self-association model was used for the sedimentation-equilibrium data analysis and the dissociation constant (K d) of the dimeric (REV7–REV3)2 complex to the monomeric REV7–REV3 complex was estimated to be 13 ± 1 µM (Fig. 1 ▶ c).
We therefore investigated the preparation of alanine mutants of REV7 in an attempt to change the dimeric property of REV7–REV3. Mutations were introduced into REV7 using the QuikChange protocol (Stratagene). REV7–REV3 with an alanine mutation was purified using a similar procedure to that used for REV7–REV3 (referred to hereafter as REV7WT–REV3). To investigate the properties of mutant REV7–REV3, we performed SEC analyses and found that a REV7–REV3 complex with an R124A substitution (REV7R124A–REV3) eluted at a larger retention volume than REV7WT–REV3. Sedimentation-velocity analysis (Fig. 1 ▶ a) and equilibrium analysis (data not shown) revealed that REV7R124A–REV3 existed as a monomeric complex (Fig. 1 ▶ a). Furthermore, we measured the far-UV CD spectra of REV7WT–REV3 and REV7R124A–REV3 using a J-720W spectropolarimeter (Jasco) at 293 K. The proteins were at a concentration of 0.1 mg ml−1 in 5 mM HEPES–NaOH pH 7.4 and 100 mM NaCl. As shown in Fig. 1 ▶(d), the CD spectra of the wild-type and the R124A complexes were indistinguishable. In addition, REV7R124A retains REV3-binding activity, suggesting that the mutation does not affect the three-dimensional structure of REV7–REV3. Therefore, we performed crystallization screening of REV7R124A–REV3.
2.2. Crystallization and initial crystallographic study of the REV7–REV3 complex
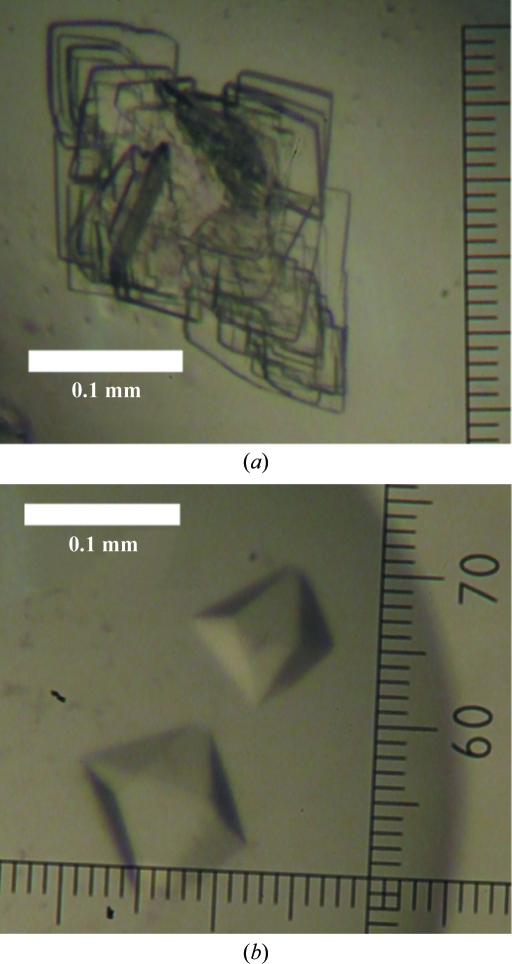
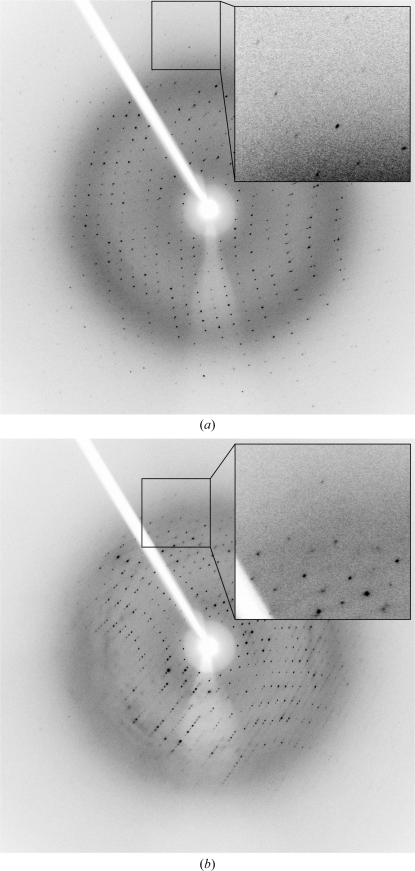
Crystallization screening of REV7R124A–REV3 was performed in a similar way to that of REV7WT–REV3. Crystallization conditions were optimized using the hanging-drop vapour-diffusion method. The purified protein was concentrated to 25 mg ml−1. Monoclinic and tetragonal crystals were obtained under different conditions (Fig. 2 ▶). Monoclinic crystals were obtained using a reservoir solution consisting of 25%(w/v) PEG 2000 MME, 0.1 M Tris–HCl pH 7.5 and 0.8 M sodium formate. Tetragonal crystals were obtained using a reservoir solution consisting of 8%(w/v) PEG 20 000, 8%(w/v) PEG 550 MME, 0.1 M Tris–HCl pH 8.5 and 0.8 M sodium formate. Prior to X-ray experiments, monoclinic and tetragonal crystals were transferred to cryoprotectants consisting of the reservoir solution containing 16.5 and 15% ethylene glycol, respectively, with a nylon loop and were then cooled in a nitrogen-gas stream at 100 K. X-ray data collection was carried out using an FR-D generator with an R-AXIS IV++ detector (Rigaku; Fig. 3 ▶). Diffraction data were integrated, scaled and averaged using HKL-2000 (Otwinowski & Minor, 1997 ▶). The monoclinic crystal belonged to space group P21, with unit-cell parameters a = 43.8, b = 50.0, c = 107.3 Å, β = 96.9°. The tetragonal crystal belonged to space group P41212 or P43212, with unit-cell parameters a = b = 76.6, c = 118.4 Å. Data-collection statistics are summarized in Table 1 ▶. The asymmetric unit of the monoclinic crystal was estimated to contain one (V M = 3.68 Å3 Da−1) or two (V M = 1.84 Å3 Da−1) molecules. The asymmetric unit of the tetragonal crystal was estimated to contain one molecule (V M = 2.74 Å3 Da−1). Structure determination of the REV7R124A–REV3 complex is now in progress using the isomorphous replacement method.
Figure 2.
Crystal forms (a) I and (b) II of the REV7R124A–REV3 complex.
Figure 3.
Typical diffraction images of (a) monoclinic and (b) tetragonal crystals of the REV7R124A–REV3 complex.
Table 1. Data-collection statistics for the monoclinic and tetragonal crystals.
Values in parentheses are for the highest resolution shell.
| Crystal form I | Crystal form II | |
|---|---|---|
| Wavelength (Å) | 1.5418 | 1.5418 |
| Resolution range (Å) | 50.0–2.25 (2.33–2.25) | 50.0–2.70 (2.80–2.70) |
| Measured reflections | 70664 | 114763 |
| Unique reflections | 20581 | 10198 |
| Completeness (%) | 93.0 (77.9) | 99.5 (99.2) |
| Mean I/σ(I) | 13.5 (4.0) | 13.9 (4.3) |
| Rmerge† (%) | 7.5 (29.1) | 7.6 (41.9) |
R
merge = 
 .
.
Acknowledgments
This work was supported by grants from KAKENHI, the Protein 3000 Project and the Target Protein Research Program to MS, TS and HH, and the Yokohama Academic Foundation to HH.
References
- Aravind, L. & Koonin, E. V. (1998). Trends Biochem. Sci.23, 284–286. [DOI] [PubMed]
- Chen, J. & Fang, G. (2001). Genes Dev.15, 1765–1770. [DOI] [PMC free article] [PubMed]
- Hong, C. F., Chou, Y. T., Lin, Y. S. & Wu, C. W. (2009). J. Biol. Chem.284, 19613–19622. [DOI] [PMC free article] [PubMed]
- Iwai, H., Kim, M., Yoshikawa, Y., Ashida, H., Ogawa, M., Fujita, Y., Muller, D., Kirikae, T., Jackson, P. K., Kotani, S. & Sasakawa, C. (2007). Cell, 130, 611–623. [DOI] [PubMed]
- Laue, T. M., Shah, B. D., Ridgeway, T. M. & Pelletier, S. L. (1992). Editors. Analytical Ultracentrifugation in Biochemistry and Polymer Science, pp. 90–125. Cambridge: Royal Society of Chemistry.
- Lawrence, C. W. & Christensen, R. B. (1979). Genetics, 92, 397–408. [DOI] [PMC free article] [PubMed]
- Lawrence, C. W. & Christensen, R. B. (1982). Mol. Gen. Genet.186, 1–9. [DOI] [PubMed]
- Lawrence, C. W., Das, G. & Christensen, R. B. (1985). Mol. Gen. Genet.200, 80–85. [DOI] [PubMed]
- Masuda, Y., Ohmae, M., Masuda, K. & Kamiya, K. (2003). J. Biol. Chem.278, 12356–12360. [DOI] [PubMed]
- Murakumo, Y., Ogura, Y., Ishii, H., Numata, S., Ichihara, M., Croce, C. M., Fishel, R. & Takahashi, M. (2001). J. Biol. Chem.276, 35644–35651. [DOI] [PubMed]
- Murakumo, Y., Roth, T., Ishii, H., Rasio, D., Numata, S., Croce, C. M. & Fishel, R. (2000). J. Biol. Chem.275, 4391–4397. [DOI] [PubMed]
- Nelson, J. R., Lawrence, C. W. & Hinkle, D. C. (1996). Science, 272, 1646–1649. [DOI] [PubMed]
- Ohmori, H. et al. (2001). Mol. Cell, 8, 7–8. [DOI] [PubMed]
- Otwinowski, Z. & Minor, W. (1997). Methods Enzymol.276, 307–326. [DOI] [PubMed]
- Schuck, P. (2000). Biophys. J.78, 1606–1619. [DOI] [PMC free article] [PubMed]
- Schuck, P., Perugini, M. A., Gonzales, N. R., Howlett, G. J. & Schubert, D. (2002). Biophys. J.82, 1096–1111. [DOI] [PMC free article] [PubMed]
- Wittschieben, J., Shivji, M. K., Lalani, E., Jacobs, M. A., Marini, F., Gearhart, P. J., Rosewell, I., Stamp, G. & Wood, R. D. (2000). Curr. Biol.10, 1217–1220. [DOI] [PubMed]
- Zhang, L., Yang, S. H. & Sharrocks, A. D. (2007). Mol. Cell. Biol.27, 2861–2869. [DOI] [PMC free article] [PubMed]


