

Abstract
Background and Aims
A test was made of the hypothesis that the prostrate growth habit of the leaves of the geophyte Brunsvigia orientalis enables utilization of soil-derived CO2 and is related to the presence of lysigenous air-filled channels characteristic of B. orientalis leaves.
Methods
Brunsvigia orientalis was sampled at a field site. Leaf anatomy, stomatal density, leaf/soil gas exchange characteristics and soil atmosphere and leaf δ13C isotope abundances were examined.
Key Results
The leaves of B. orientalis have large lysigenous air-filled channels separating the upper and lower surfaces of the leaves. The upper surface comprised approx. 70 % of the leaf mass and 75 % of the leaf N (mmol g−1). Between 20 % and 30 % of the stomatal conductance and CO2 assimilation was through the lower surface of the leaf. CO2 efflux rates from the soil surface were up to 5·4 µmol m−2 s−1 while photosynthetic fluxes through the lower surface of the leaves were approx. 7 µmol m−2 s−1. However, the utilization of soil-derived CO2 only altered the leaf δ13C isotope abundance of the prostrate leaves by a small amount. Using δ13C values it was estimated that 7 % of the leaf tissue C was derived from soil-derived CO2.
Conclusions
A small proportion of photosynthetically fixed CO2 was derived from the soil, with minimal associated transpirational H2O loss into the space between the leaf and soil. The soil-derived CO2, taken up through the lower surface was probably assimilated by the palisade tissue in the upper surface of the leaf which was exposed to sunlight and where most of the leaf N was located. The occurrence of lysigenous air channels in the leaves may provide longitudinal strength without impaired transfer of CO2 taken up through the lower surface to the upper surface.
Key words: Brunsvigia orientalis, carbon dioxide, soil efflux, photosynthesis, carbon isotope, prostrate, geophyte, lysigenous
INTRODUCTION
Of the five Mediterranean-climate ecosystems in the world, the Cape Mediterranean zone of South Africa has the highest diversity of geophytes (Doutt, 1994; Esler et al., 1999; Procheş and Cowling, 2004) with 2100 species, 84 % of them endemic to the region. Geophytes are also an important component of the flora in the neighbouring semi-arid to arid Succulent Karoo (including Namaqualand) in the winter-rainfall region of South Africa. Geophytes are plants with underground perennation organs such as rhizomes, tubers, bulbs or corms, which also serve as storage organs (Procheş and Cowling, 2004). Most of these geophytes avoid stress by having a strongly seasonal growth habit with the above-ground parts senescing during the summer-drought period (Dafni et al., 1981). In addition to the typical monocot geophyte growth form with upright leaf rosettes, there is a peculiar growth form with leaves prostrate on the soil surface. At least eight geophyte families exhibit this growth form (Amaryllidaceae, Colchicaceae, Eriospermaceae, Geraniaceae, Hyacinthaceae, Iridaceae, Orchidaceae and Oxalidaceae). This growth form is common in the winter-rainfall Succulent Karoo and Fynbos (literally meaning ‘fine-leaved’) biomes of South Africa but less commonly in the summer-rainfall temperate regions of Africa and prostrate-leaved geophytes are almost absent in the rest of the world (Esler et al., 1999). For instance, these authors found that approx. 80 % of prostrate-leaved members of the Amaryllidaceae occur in winter rainfall areas. In contrast, species in the same genera with more ‘erect’ leaves do not exhibit this strong biogeographical pattern. Furthermore, many of the genera have both prostrate and ‘erect’ leaf forms (data of Meerow and Snijman, 2001) indicating multiple origins of the prostrate growth habit.
It would seem likely that the highly localized pattern of distribution of the prostrate growth habit in the winter-rainfall region of South Africa results from specific advantages accruing from this life-style. Speculations as to the benefits of prostrate leaves include: avoidance of herbivory (Eller and Grobbelaar, 1982), a reduction of H2O loss (Lovegrove, 1993), optimization of leaf temperature (Esler et al., 1999), benefits for CO2 acquisition (Rossa and von Willert, 1999) and combinations of these. The localized distributions of prostrate-leaved geophytes, and the fact that many species accumulate toxic alkaloids (e.g. Brunsvigia orientalis; Viladomat et al., 1996), indicates that the prostrate habit is unlikely to be primarily for herbivory avoidance (Esler et al., 1999). The prostrate leaves have been suggested to act as ‘water-trapping umbrellas’, reducing H2O loss through transpiration and creating microclimates for growth (Lovegrove, 1993). The fact that the leaves are closely adpressed to the soil surface may enable them to track soil, rather than air temperature, providing advantages during cold periods as a result of leaf temperatures more favourable for photosynthesis (Esler et al., 1999). The moist habitat underneath the prostrate leaves may facilitate microbial activity, thus increasing the CO2 availability for photosynthesis (Rossa and von Willert, 1999).
Carbon dioxide in soils is derived from chemical and biotic processes. Plant root, soil bacteria, fungi and fauna contribute to the release of CO2 into the soil air space (Johnson et al., 1994). The biotic components are all ultimately dependent on photosynthetic carbon for substrate, which results in the isotope abundance (δ13C) being largely determined by the δ13C of the plants inhabiting the soil, and subsequent fractionation events (Gillson et al., 2004). In general, the concentration of CO2 within soils increases with depth (Franzluebbers et al., 1995), but is usually more than approx. 10-fold greater than the atmospheric CO2 concentration. This CO2 is advected from the soil by H2O movement, but is also lost through the surface by diffusion, contributing to the gradient with depth in the soil (Cramer, 2002). Most CO2 lost from the soil is through the soil surface with the flux ranging from 1 to 46 µmol CO2 m−2 s−1 (Russel, 1950; Franzluebbers et al., 1995). This could provide a source of CO2 for photosynthesis. In forests where air-movement is restricted, the foliage closer to the soil has lower δ13C values than that higher in the canopy, due to the use of 13C-depleted air from the soil (Schleser and Jayasekera, 1985). In plants with a leaf area index close to unity, it is possible that CO2 flux from soil could provide an important resource and possibly result in the δ13C value of the leaves being determined by the δ13C value of soil-respired CO2.
The hypothesis was tested that the prostrate-leaved growth form of the geophyte B. orientalis enabled this plant to obtain CO2 from the soil through stomata on the underside of the leaf. Photosynthetic utilization of CO2 from below the leaves may have the associated advantage that the air space under the leaves remains moist and therefore CO2 can be obtained with little H2O loss. Brunsvigia orientalis flowers between February and March and the large tongue-shaped leaves appear from May and are spread flat on the ground. From about October, the flowerhead wilts and dies back (Bond and Goldblatt, 1984), while the bulb lies dormant during summer. These plants occur on sandy lowland coastal areas from southern Namaqualand to the Cape Peninsula and Plettenberg Bay. The possibility that B. orientalis accesses soil-derived CO2 was investigated by measuring photosynthetic gas exchange of soil and the leaves of both prostrate- and quasi-erect-leaved (leaves held up by surrounding vegetation) of B. orientalis in the field. Leaf and soil atmosphere δ13C measurements were also made to determine the contribution of soil CO2 to photosynthate production.
MATERIALS AND METHODS
Study site
A population of Brunsvigia orientalis (L.) Aiton ex Eckl. was chosen at Rondevlei Nature Reserve (34°03′56″S, 18°30′06″E, altitude 7 m a.s.l.) in Cape Town, South Africa. Rondevlei is a permanent, freshwater body with sandy soils in the surrounding areas. The vegetation in this area is mostly low, relatively open and interspersed with exposed sandy areas. Brunsvigia orientalis was growing in the open sites, generally exposed to light, although some individuals were partially shaded by surrounding vegetation. This population had individuals with large prostrate leaves, but some individuals had their leaves lifted by surrounding vegetation and were thus held erect. Measurements were performed between 2 September and 21 October 2005. In all cases there was a light rainfall on the day preceding sampling. For August/September/October the average daily maximum temperature was 15·9/19·5/21·8, respectively; the average daily minimum temperature (°C) was 7·4/9·5/13·5, respectively; the monthly rainfall (mm) was 89·6/29·7/13·5, respectively (data supplied by the South African Weather Service, Cape Town International airport).
Photosynthetic leaf and soil gaseous exchange
A LI-6400 portable infra-red gas analyser (LI-COR Biosciences Inc., Nebraska, USA) was used to measure photosynthetic assimilation (A), transpiration rate (E), stomatal conductance (Gs), intercellular CO2 (Ci) and leaf temperature of both prostrate and ‘erect’ leaves. The ambient light intensity was 2100 µmol m−2 s−1, and this was set as the light intensity emitted from the red–blue light-emitting diodes of the LI-COR 2 × 4 cm cuvette (LI-COR 6400-02). The cuvette temperature was set to 25 °C and the cuvette CO2 concentration was set to 400 µL L−1. A high flow rate of air through the cuvette (500 µmol s−1) ensured rapid equilibration and measurements were generally taken within 60 s. A thin sheet of transparent LI-COR cuvette film was used to alternately screen the upper and lower surface within the leaf cuvette to allow measurement of either the upper or lower surfaces independently. Using this method, it was found that the sum of the photosynthetic rates of the upper and lower surfaces measured independently was statistically indistinguishable from the whole leaf measured without screens. The edge of the measuring window of this cuvette was positioned approx. 2 cm in from the margin of the leaf. The mid-length sections of leaves of plants with either prostrate or ‘erect’ leaves were measured and also the base (youngest quarter of leaf), middle and tip (oldest quarter) regions of the prostrate leaves. Measurements were taken at three times (2 September, 23 September, 15 October).
The edge of the LI-COR soil respiration cuvette (LI-COR 6400-09) was inserted 1 cm into the soil and allowed to equilibrate for 5 min before CO2 release from the soil was measured. For each gas-flux sample, the soil temperature was measured from 0 cm to 20 cm depth with a LI-COR soil temperature probe. The CO2 efflux was measured three times at a cuvette CO2 concentration of 400 µL L−1 over a range of 10 µL L−1, and averaged. The CO2 efflux was measured from the soil below the leaves and also from open areas close to the plants. A series of CO2 flux measurements were also made over a range of CO2 concentrations in the cuvette (i.e. altering the gradient for CO2 flux from the soil into the atmosphere) between 300 and 1000 µL L−1 on soil below the leaves. This series of measurements was used to derive a curve relating CO2 efflux to the concentration of CO2 in the atmosphere above the soil. The efflux was measured three times at each CO2 concentration as the CO2 concentration in the cuvette passively increased due to diffusion of CO2 from the soil surface.
Leaf characteristics
Leaf material was collected from the study site on the 2 September and hand-cut sections of leaves were double stained with safranin and fast green (Tolivia and Tolivia, 1987). Clear nail polish was applied to a 5 × 5 cm patch in the middle of the leaf lamina close to the base of the leaf, in the middle of the leaf and at the leaf tip on both the upper and lower surfaces. Once dry, the nail polish was peeled off and the surface replica microscopically examined and stomata counted. Samples from the tip, middle and base of the leaves were collected and the upper and lower surface of some of these separated using a blade. The area of the leaves was measured with a LI-3100C area meter (LI-COR) and the samples dried at 70 °C for 48 h prior to weighing. The specific leaf area (m2 kg−1) was calculated. The width and height of the lysigenous air spaces were measured microscopically.
Isotopic analysis
The oven-dried plant components were milled in a Wiley mill using a 0 · 5-mm mesh (Arthur H. Thomas, California, USA). Between 2·100 mg and 2·200 mg of each sample was weighed into an 8 × 5 mm tin capsule (Elemental Microanalysis Ltd, Devon, UK) on a Sartorius microbalance (Goettingen, Germany). The samples were combusted in a Thermo Flash EA 1112 series elemental analyser (Thermo Electron Corporation, Milan, Italy). The gases released were fed into a Delta Plus XP isotope ratio mass spectrometer (Thermo Electron Corporation) via a Finnigan Conflo III control unit (Thermo Electron Corporation), where their δ13C values were determined. Two in-house and one IAEA standards were used to calibrate the results.
Soil air was collected by burying the neck of four deformable 2-L bottles 10 cm below the surface of the sandy soil close to B. orientalis plants. The bottle was left in the soil for 4 d (August 2006) before being removed and immediately capped. The δ13C value of the soil CO2 was determined by attaching an 180 mm × 6 mm OD Pyrex glass tube to a vacuum line. The line was evacuated after which it was closed off from the pump and a small amount of the sample gas from the bottle introduced into the line. The CO2 introduced was condensed in the Pyrex tube by plunging into liquid nitrogen, after which the tube was flame sealed and cut. The δ13C was determined by attaching the tube to the mass spectrometer inlet. The contribution of soil-derived CO2 to leaf photosynthesis was calculated from the following equation:
 |
where δ13CProstrate is the δ13C of the prostrate leaves, δ13CErect is for the erect leaves, δ13CSoil air is for the collected soil air and δ13CAtmosphere is for the atmosphere.
Statistical analysis
The data were analysed using ANOVA with post-hoc Tukey LSD tests in Statistica (Version 7; StatSoft Inc.).
RESULTS
Leaf characteristics
The plants were growing in a sandy open site with leaves adpressed to the soil surface. In many cases the vegetation immediately surrounding the plants was short (<20 cm high; Fig. 1A), but less commonly, the vegetation was taller and the leaves were held aloft by the surrounding vegetation. During the first and second measurements (2 and 23 September) all the leaves were green without signs of insect damage but, at the last measurement (21 October), many of the plants had dead leaves (Fig. 1B), although only green plants were sampled. The end of the growing season corresponded with a decline in the monthly rainfall and a small increase in the monthly average of the daily maximum temperature. The mature leaves measured approx. 48 ± 1 cm in length and 18 ± 1 cm in width (n = 5; Fig. 1A). There were small flattened, etiolated or dead plants under the leaves.
Fig. 1.
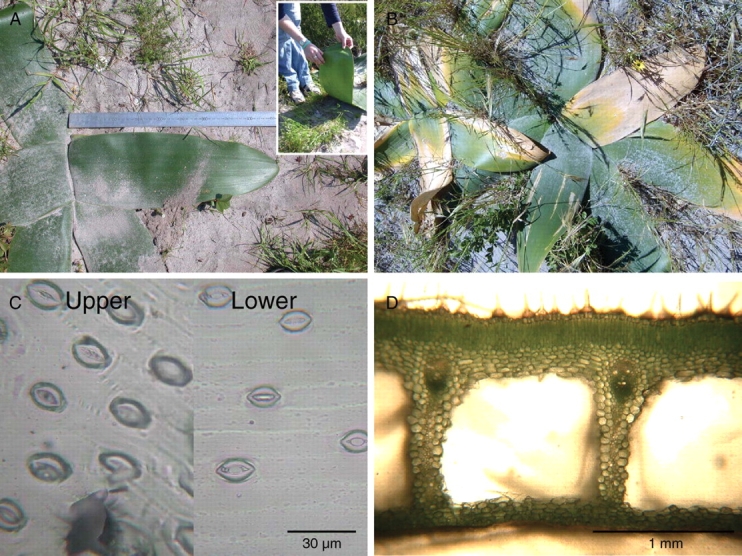
(A) A prostrate-leaved B. orientalis in an open, sandy site photographed on 2 September. The inset photograph shows the pale green lower surface of the leaves and the exposed moist soil surface. (B) A plant with some leaves growing over surrounding vegetation photographed on the 15 October at the end of the growing season. (C) Replicas of the upper and lower surfaces showing stomata and leaf hairs on the upper surface and open stomata on the lower surface. (D) A transverse section through a leaf showing the lysigenous air spaces between columns of cells.
The leaves of B. orientalis are characterized by lysigenous air channels (Vorster and Spreeth, 1996) with the upper and lower surfaces separated by vertical columns of cells that run the length of the leaf (Fig. 1D) and occupy approx. 60 % of the leaf height (Table 1). The vascular bundles are located closer to the upper surface at the upper end of this column of cells. A layer (approx. 0·2 mm) of palisade parenchyma made up of columnar cells lies below the upper epidermis which has short surface hairs. By separating the upper and lower surfaces with a blade, it was determined that 70 % of the leaf dry mass was associated with the upper surface of the leaf (Table 1). The lower surface of the leaf was pale green, glabose and had no clear epidermal layer or parenchyma (Fig. 1). The lysigenous channels were smaller at the tip than in the middle or at the base of the leaves and were air-filled throughout the length and width of the leaves. The specific leaf area did not vary across the length of the leaves (Table 1).
Table 1.
Characteristics of B. orientalis leaves collected on 23 September 2005 from the tip, middle and base of the leaves
| Measure | Position | Leaf portion | ||
|---|---|---|---|---|
| Tip | Mid | Base | ||
| Thickness (mm) | Edge | 0·78 ± 0·05a | 1·03 ± 0·06b | 1·03 ± 0·03b |
| Middle | 2·10 ± 0·12a | 2·75 ± 0·15b | 3·04 ± 0·18b | |
| Air channel width (mm) | 1·26 ± 0·11a | 1·80 ± 0·04b | 1·67 ± 0·07b | |
| Air channel height (mm) | 1·15 ± 0·05a | 1·76 ± 0·12b | 1·87 ± 0·14b | |
| SLA (m2 kg−1) | Both surfaces | 7·2 ± 0·5a | 6·7 ± 0·6a | 6·4 ± 0·4a |
| Lower surface | 23 ± 1b* | |||
| Upper surface | 9·6 ± 0·2a* | |||
Leaf thickness was measured at the edge of the lamina and in the middle of the lamina.
The specific leaf area (SLA, m2 kg−1 Md) was calculated from the dry weights of the upper and lower surfaces.
Values are the mean ± s.e. followed by letters which, when different across the portion of the leaves, indicate significant (n = 5, P < 0·05) differences between leaf portions, as determined from one-way ANOVA followed by post-hoc Tukey LSD tests. Different letters with asterisks indicate significant (n = 5, P < 0·05) differences between leaf surfaces (upper and lower).
Of the total number of stomata (upper + lower surfaces), approx. 22 % were on the lower surface of the leaves (Fig. 2). There were significantly more stomata (upper + lower surfaces) on the prostrate leaves than on those held ‘erect’ by surrounding vegetation. The abundance of stomata was also greater at the tip of the leaves than in other leaf portions. On the upper surface of the leaves, there was a significantly higher stomatal density at the base and the tip of the prostrate leaves, compared with the ‘erect’ leaves. The stomata were similar in size on the lower and upper surfaces (Fig. 1C), and had similar conductances per stoma (data not shown).
Fig. 2.

The stomatal density (mean ± s.e, n = 4) for the upper and lower surfaces of the basal, middle and tip sections of the leaves of B. orientalis. The height of the stacked column shows the total number of stomata (upper + lower surfaces) per leaf area. Different letters above the columns indicate significant differences (P < 0·05) of the lower and upper surfaces (tested separately) between the portions of the leaves as determined by three-way ANOVA (factors orientation, portion of leaf and surface of leaf) followed by post-hoc Tukey LSD tests. Prostrate leaves had significantly higher stomatal densities than erect leaves (P = 0·03). Numbers within the columns indicate the percentage that the lower surface contributed to the total stomatal density (upper + lower surfaces). Capital letters above the graph indicate significant differences between the portions of the leaves (P < 0·05).
Leaf and soil gas exchange properties
Photosynthesis, stomatal conductance and transpiration were all higher for the upper (up to 26 µmol m−2 s−1) than the lower surfaces (up to 6 µmol m−2 s−1) of both prostrate and ‘erect’ leaves (Fig. 3A). The photosynthetic rates of prostrate and ‘erect’ leaves were relatively high and associated with high transpiration rates and stomatal conductances. The internal CO2 concentration was approx. 300 µL L−1 when measured for both the upper and lower surfaces of prostrate and ‘erect’ leaves and was relatively similar between ‘erect’ and prostrate leaves (data not shown). When illuminated from the top, photosynthetic CO2 consumption occurred through both the upper and lower surfaces of the leaves, albeit at a substantially lower rate through the lower surface. Photosynthesis through the lower surface accounted for approx. 25 % of the total photosynthesis in both prostrate and ‘erect’ leaves. Generally, the prostrate leaves had a higher total photosynthetic rate than the ‘erect’ leaves. The middle portion of the leaf had higher overall photosynthetic rates than the youngest basal portion of the leaf (Fig. 3B). The proportion of total photosynthesis due to the lower surface was 17 %, 21 % and 28 % for the basal, middle and tip sections of the leaves, respectively (Fig. 3A). There were no significant differences in stomatal conductances or transpiration rates between the different portions of the leaf.
Fig. 3.
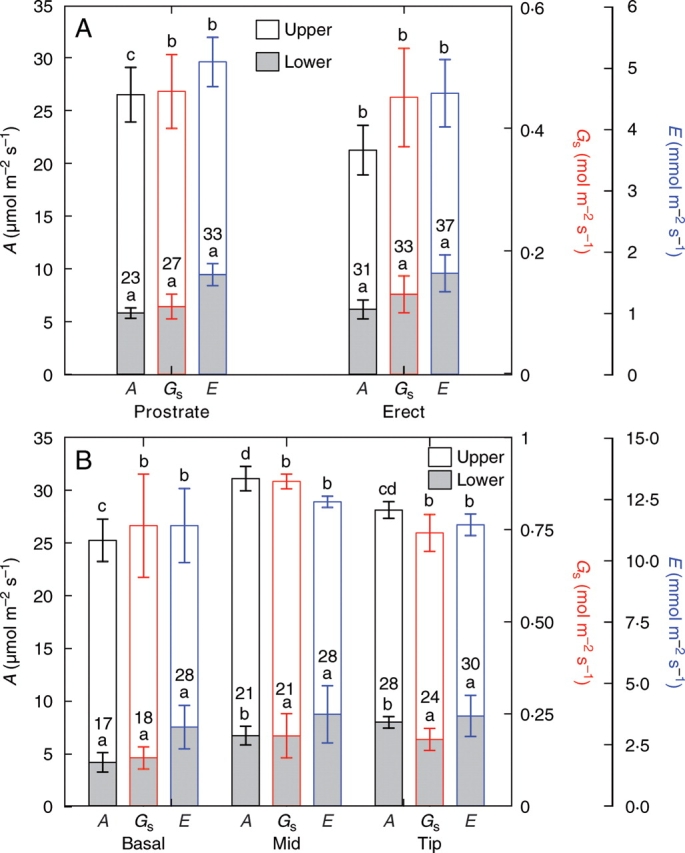
The rates of photosynthetic assimilation (A), stomatal conductances (Gs) and rates of transpiration (E) for (A) the upper and lower surfaces of the prostrate and ‘erect’ leaves of B. orientalis measured on 2 September and (B) the upper and lower surfaces of the basal, middle and tip portions of the prostrate leaves measured on 23 September (mean ± SE, n = 6). Different letters above the columns indicate significant differences (P < 0·05) of the lower and upper surfaces (tested separately) between the different leaf orientations, as determined by ANOVA followed by post-hoc Tukey LSD tests. Numbers within the columns indicate the percentage that the lower surface contributed to the total A, Gs and E.
Over the sampling period, the photosynthetic rates, transpiration rates and stomatal conductances increased between the first and second sampling events and then decreased dramatically (Fig. 4) when the plants senesced (Fig. 1B). The intercellular CO2 concentrations (Ci) were remarkably similar across all sampling times and also between the upper and lower surfaces (Fig. 4D). Although the cuvette was set to regulate temperature, the fact that the weather changed during the onset of spring needs to be taken into account with warmer temperatures and drier conditions prevailing during the 2nd and 3rd sample times. The contribution of the lower surface to overall photosynthetic CO2 acquisition was consistent with the trends in overall photosynthetic rates (Fig. 4A).
Fig. 4.

(A) The rates of photosynthetic CO2 assimilation (A), (B) stomatal conductances to CO2 (Gs), (C) rates of transpiration (E) and (D) intercellular CO2 concentrations (Ci) for the lower surface and both (upper + lower) surfaces of the middle portion of the prostrate leaves of B. orientalis measured at three time points starting on 2 September. Values are the means and bars indicate the s.e. (n = 6).
The soil temperature was approx. 18 °C under the leaves of the B. orientalis and was not significantly different from that in the open sites (Table 2). There was no significant difference in soil CO2 efflux from the open sites compared with that from soil directly under the leaves of the geophytes (Table 2). The lower surfaces of the leaves accumulated surface moisture, especially closer to the base of the leaf, which persisted throughout the day. Water efflux from the soil surface was significantly higher from soil below the leaves than from the drier open sites (Table 2). Over the sampling period, the soil CO2 efflux, H2O efflux and soil temperature followed a similar pattern of change (Fig. 5). Soil temperature was significantly lower during the first sampling than later and thereafter remained relatively constant. Soil CO2 efflux was strongly dependent on the CO2 concentration in the atmosphere above the soil (Fig. 5 inset). From this inverse curvilinear relationship between the CO2 concentration and the CO2 efflux it can be estimated that the CO2 concentration under a CO2 impermeable surface on the soil surface would reach approx. 1727 µL L−1. Furthermore, with CO2 concentration below ambient (approx. 400 µL L−1) in the atmosphere above the soil (as a result of leaf photosynthesis), the rate of CO2 efflux from the soil would be higher than the measured 5·4 µmol m−2 s−1 at ambient CO2 concentration.
Table 2.
CO2 and H2O efflux and soil temperature measurements (mean ± s.e.) taken from under the fully developed leaves of B. orientalis (‘Under leaf’) and from neighbouring sites without vegetation (‘Open’)
| Under leaf | Open | |
|---|---|---|
| CO2 efflux (μmol m−2 s−1) | 5·38 ± 0·23a | 4·74 ± 0·47a |
| H2O efflux (mmol m−2 s−1) | 6·25 ± 0·41b | 3·86 ± 0·76a |
| Temperature (°C) | 17·9 ± 0·3a | 18·4 ± 0·1a |
Student's t-tests were used to determine whether there were significant differences between the site under the geophyte leaves and the open sites (n = 5, P < 0·05).
Fig. 5.
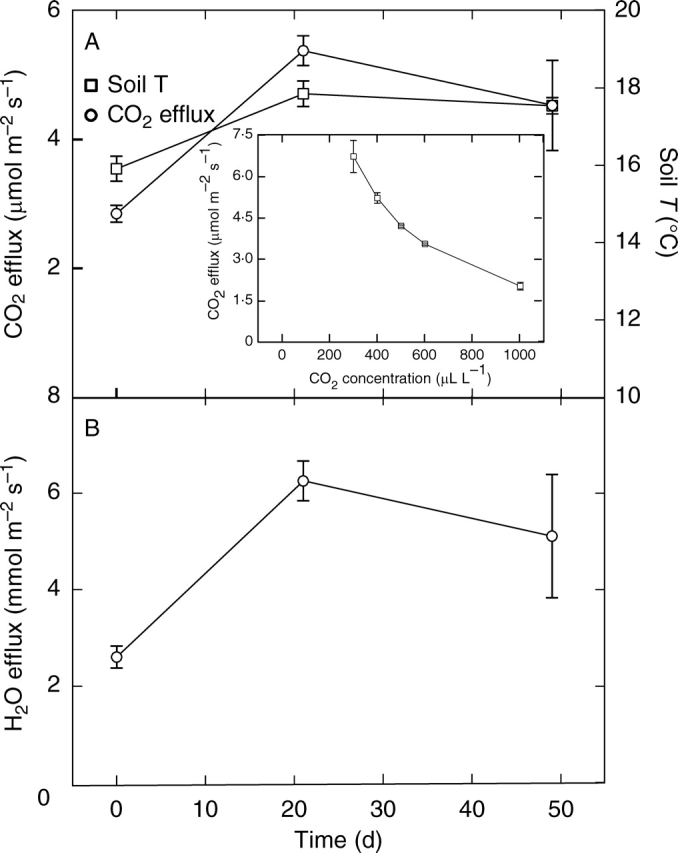
The rates of (A) CO2 efflux and soil temperature (averaged over 0–20 cm depth) and (B) H2O efflux from soil measured under the leaves of B. orientalis at three times starting on 2 September. Values are the means and bars indicate the s.e. (n = 5). Inset: the rate of CO2 efflux from soil at a range of CO2 concentrations in the atmosphere above the soil (i.e. in the cuvette, n = 5).
Elemental and isotopic analysis
The δ13C (‰) value of the soil air was −19·12 ± 0·15 (mean ± s.e., n = 4). Overall the tissue δ13C values measured for the ‘erect’ leaves were higher than those of the prostrate leaves, but this difference was not significant for the different portions of the leaves (Fig. 6). The δ13C values of the tips of the leaves were significantly more negative than those of the basal portions of the leaves. The δ13C values were not different between the upper and lower surfaces of the leaves (Table 3). Nitrogen concentrations were approx. three-fold higher for tissue in the upper than in the lower surfaces of both ‘erect’ and prostrate leaves (Table 3).
Fig. 6.

The δ13C (mean ± s.e., n = 4) for the upper and lower surfaces of the basal, middle and tip sections and the whole leaves of B. orientalis. Different letters above the columns indicate significant differences (P < 0·05) of the lower and upper surfaces (tested separately) between the portions of the leaves as determined by two-way ANOVA followed by post-hoc Tukey LSD tests. In the absence of significant interaction between growth habit (prostrate versus ‘erect’) and leaf portion (interaction P = 0·853), the comparison of the erect versus ‘prostrate’ main effect yielded P = 0·043 (primed letters, e.g. a′). Capital letters above the graph indicate significant differences between the portion of the leaves (P = 0·004). Numbers above the columns indicate the percentage contribution of soil atmosphere to leaf construction calculated from the soil air, atmosphere and leaf δ13C values.
Table 3.
Isotopic values for C (δ13C ‰) and the total N concentrations (mmol g−1 Md) and the C : N ratio of the mid-portions of leaves held ‘erect’ by surrounding vegetation and for prostrate leaves of B. orientalis
| Erect leaves |
Prostrate leaves |
|||
|---|---|---|---|---|
| Lower | Upper | Lower | Upper | |
| N (mmol g−1) | 0·58 ± 0·05a | 1·57 ± 0·05b | 0·52 ± 0·04a | 1·58 ± 0·09b |
| C : N ratio | 48·8 ± 3·7b | 19·2 ± 0·9a | 53·8 ± 5·4b | 19·2 ± 1·2a |
| δ13C (‰) | −24·9 ± 0·25a | −25 ± 0·17a | −25·1 ± 0·34a | −25·8 ± 0·29a |
The upper and lower surfaces of the leaves were cut apart through the air space and the leaf components analysed separately.
Values are mean ± s.e. and dissimilar letters indicate significant (P < 0·05) differences between leaf surfaces and orientations as determined by one-way ANOVA followed by post-hoc Tukey LSD tests (n = 5).
DISCUSSION
Evidence for the utilization of soil CO2 by the lower surface of the prostrate leaves was obtained from anatomical studies, leaf and soil gas exchange data and carbon isotopes. Approximately 75 % of the stomata were located on the upper surface of the leaves, indicating that the bulk of gas exchange was likely to occur through the upper surface (Fig. 7). The higher stomatal density at the leaf tip than other portions of the leaf could be related to the fact that the leaf tip is the oldest portion of the leaf which expands during the wet winter months. The significantly larger number of stomata on the prostrate than on the ‘erect’ leaves could result from the moist environment under the prostrate leaves.
Fig. 7.

Illustration of the likely gas diffusion pathways into the leaf of B. orientalis. CO2 is shown fluxing from the soil into an air space between the leaf and the soil where the CO2 concentration may be relatively high in the absence of leaf photosynthesis (determined by extrapolating soil CO2 efflux versus [CO2] concentration to 0 efflux; Fig. 5A). CO2 entering through stomata on the lower surface is shown to flux through the lysigenous canal to the upper palisade tissue. Flux rates of CO2 and H2O, measured at the 2nd sampling, are indicated in italics. Tissue δ13C and total N concentrations are indicated for the upper and lower surfaces.
Over the sampling period, the contribution of the lower surface to photosynthesis of the middle portion of the leaf was 22, 21 and 35 % for the 1st, 2nd and 3rd sampling times, respectively. Thus the contribution of the lower surface to total photosynthesis increased towards the end of the growing season. However, the overall photosynthetic rates dropped from 31·1 µmol m−2 s−1 to 4·7 µmol m−2 s−1 at the end of the growing season. For indigenous plants in the Cape region, Midgley et al. (1999) reported photosynthetic rates ranging from 5 to 15·2 µmol m−2 s−1 for Proteaceae while Herppich et al. (2002) reported rates ranging from 1·5 to 7 µmol m−2 s−1 for members of the Proteaceae, Ericaceae and Restionaceae. The high photosynthetic rates found in this study were at variance with those reported by Rossa and von Willert (1999) for prostrate-leaved geophytes, although this latter work was conducted on different species and in a more arid region (Namaqualand). The contribution of the lower surface to total CO2 flux was similar for both prostrate and ‘erect’ leaves (Fig. 3A). The proportion of the total photosynthesis through the lower surface was smaller than the proportion of total transpiration attributable to the lower surface (Fig. 3A, B). This may occur because the atmosphere, to which the lower surface of the leaf would normally be exposed, would have a high humidity (Table 2) or because of a slightly damp lower leaf surface, although, the lower surface when visibly wet was blotted before measurements were taken. The greater photosynthetic flux through the lower surface of the leaf at the tip than at the base (Fig. 3) might be due to the greater stomatal frequency (Fig. 2) at the tip than for other parts of the leaf.
Changes in soil H2O and CO2 flux over time were similar to changes in soil temperature (Fig. 6). Soil temperature and moisture are likely to have a significant impact on both plant root and microbial activities. It is reasonable to expect that the CO2 flux from the soil below the leaves would be higher than that of open sites due to the higher moisture in the soil, as postulated by Rossa and von Willert (1999). The greater loss of H2O from below the leaves (Table 2) is indicative of the fact that this environment was wet, as has been previously observed (Lovegrove, 1993). Higher CO2 flux from moist soil could possibly follow from greater plant and microbial activity in the moist soil beneath the leaves, as proposed by Rossa and von Willert (1999). However, in the present study there was no significant difference in CO2 flux from the surface of soil below the geophyte leaves compared with open sites. This was probably because the soils were sandy (low organic matter content) and even the drier open sites had many plants in the surroundings with roots below the surface capable of releasing CO2.
The rates of CO2 efflux from the soil were similar to the rates of CO2 consumption by the lower surface of the leaves. Both leaf photosynthesis and soil CO2 efflux were measured at a CO2 concentration of 400 µL L−1, which is similar to the CO2 concentration of the atmosphere. However, the rate of CO2 efflux from the soil is known to be strongly decreased by increased CO2 concentrations in the atmosphere above the soil (Fig. 5) and thus, CO2 flux from the soil below the leaves is likely to be reduced at night when leaves are respiring. Extrapolating from the data collected, it is likely that flux would be negligible at CO2 concentrations of approx. 1750 µL L−1. During the day, photosynthesis is likely to deplete the CO2 concentrations between the leaf and soil and thus increase the efflux of CO2 above that measured at a CO2 concentration of 400 µL L−1. The fact that CO2 assimilation through the lower surface occurs from a moisture-laden environment might provide significant advantages to the plants as a consequence of reduced H2O loss through the lower surface without compromise to CO2 acquisition.
The atmosphere has a δ13C value of approx. −10‰, while CO2 released from soils had an isotope ratio intermediate (−19·12‰) between that of the atmosphere and the characteristic δ13C value of C3 plants, as also found by Gillson et al. (2004). We therefore expected that the prostrate leaves would have more negative δ13C values than those of the erect leaves. The contribution of CO2 from the soil atmosphere to leaf carbon was estimated, from the δ13C values, to be 7 % (Fig. 6). This is surprisingly low since approx. 20–30 % of stomatal conductance was located on the lower surface. However, the air between the soil and leaf is essentially captive and thus isotope discrimination may be limited. Sections from leaf margin to leaf margin were also used for δ13C measurements in order to get a representative sample, but this may have underestimated the contribution by the central portion of the leaf with greater possible below-ground contribution. The upper and lower surfaces of both erect and prostrate leaves were measured independently, and no differences were detected in δ13C between the two surfaces, indicating that the lower surface does not especially accumulate soil-derived CO2.
The N concentrations in the upper surface tissue were 2- to 3-fold higher than those of a wide range of other plants in the Cape region from diverse habitats (Herppich et al., 2002), possibly explaining the high photosynthetic rates observed (Fig. 4). The lower surface of the leaf was much thinner than the upper (Table 1) and had much less total N (Table 3) than that of the upper surface, indicating limited photosynthetic capacity in the lower surface. The lower tissue N in the lower leaf surface and pale green colour probably reflects the fact that light transmission through to the lower leaf surface must be restricted. Thus, CO2 diffusing through the stomata on the lower surface was probably transmitted through the air spaces to the upper surface where assimilation occurred, resulting in a lack of difference in δ13C values between the upper and lower surfaces of the leaves.
The function of the air-filled spaces is intriguing. Could the lysigenous channels in the leaves serve the function of CO2 reservoirs, storing night-time respiratory CO2 for internal reassimilation without associated H2O loss? From calculation of the volume of air in the channels within the leaves and even assuming extremely high concentrations of CO2 (>10 000 µL L−1), it was estimated that the stored CO2 could not support photosynthesis. Could the channels serve to separate the upper and lower leaf surfaces, thereby protecting the lower surface from potentially high temperatures associated with prostrate leaves and consequent poor air-circulation below the leaves? Leaf air-channels were filled with H2O and it was found that, at thermal equilibrium in the sun, there were no differences in leaf temperature between the lower surface of leaves with water-filled (27·7 ± 0·03 °C, n = 3) versus air-filled (27·8 ± 0·06 °C, n = 3) channels (measured with a thermocouple). Furthermore, the main photosynthetic capacity seems to be located in the upper surface of the leaves, as judged by the N concentrations in this tissue, so there would be little benefit to protecting the lower surface of the leaves. Could the leaf structure provide strength in a longitudinal axis in the direction of growth allowing growth across the soil surface and over small surrounding vegetation (e.g. Fig. 1B)? A crude measure of the force that can be exerted by a section of leaf in the longitudinal direction (pushing leaf sections in the longitudinal axis onto the pan of a balance with a micro-manipulator tool) indicated that the channel structure might serve the function of making the leaf stiff. The intact structure was much stronger than the strength of the independent upper and lower surfaces combined. This strength accrues from the same structural properties that pertain for corrugated board and makes the leaves rigid in the direction of growth, possibly enabling it to compete with surrounding annual vegetation of small stature.
CONCLUDING REMARKS
Brunsvigia orientalis grows in the cool winter-rainfall season, in spring and early summer, with leaf senescence usually occurring before the summer drought. These plants therefore exploit a seasonal niche with adequate H2O from rainfall and relatively low daily temperatures to rapidly complete their growth by photosynthesizing at high rates to replenish the underground perennation organ. It is noteworthy that the leaves of B. orientalis are probably the largest of any plants in the Cape Mediterranean and Succulent Karoo biomes in which they occur. The large-leaved prostrate growth habit with little convective air movement below the leaf might be particularly susceptible to high irradiances and consequently high leaf temperatures, restricting their range/growing season to cool and wet areas and/or seasons. The prostrate leaves allow a small proportion of the total photosynthetic CO2 to be derived from soil CO2 with consequently reduced H2O loss (Fig. 7). The structure of the leaves makes them relatively stiff and the presence of air-filled spaces would not impede the flux of the abaxially absorbed soil-derived CO2 to the upper, and more photosynthetically active, palisade parenchyma. Other prostrate-leaved plants (e.g. geophytes, rosette-form herbs) probably also derive advantage from CO2 fluxing from the soil.
Supplementary Material
ACKNOWLEDGEMENTS
We thank Ian Newton (Archaeometry Department, UCT) for running the samples and for comments on the manuscript. We thank Karen Esler for stimulating our interest in this research and Anton Pauw and Piet Vorster for useful discussions. The staff of Rondevlei Nature Reserve is thanked for friendly facilitation of access to the study site.
LITERATURE CITED
- Bond P, Goldblatt P. Plants of the Cape flora: a descriptive catalogue. Journal of South African Botany. 1984;(Suppl. 13):1–455. [Google Scholar]
- Cramer MD. Inorganic carbon utilization by plant roots, 699–716. In: Waisel Y, Eschel A, Kafkafi U, editors. Plant roots: the hidden half. 3rd edn. New York, NY: Marcel Dekker; 2002. [Google Scholar]
- Dafni A, Cohen D, Noy-Meir I. Life-cycle variation in geophytes. Annals of the Missouri Botanical Gardens. 1981;68:652–660. [Google Scholar]
- Doutt RL. Cape bulbs. London: B. T. Batsford; 1994. [Google Scholar]
- Eller BM, Grobbelaar N. Geophylly: consequences for Ledebouria ovatifolia in its natural habitat. Journal of Experimental Botany. 1982;33:366–375. [Google Scholar]
- Esler KJ, Rundel PW, Vorster P. Biogeography of prostrate-leaved geophytes in semi-arid South Africa: hypotheses on functionality. Plant Ecology. 1999;142:105–120. [Google Scholar]
- Franzluebbers AJ, Hons FM, Zuberer DA. Tillage-induced seasonal changes in soil physical properties affecting soil CO2 evolution under intensive cropping. Soil Tillage Research. 1995;34:41–60. [Google Scholar]
- Gillson L, Waldron S, Willis KJ. Interpretation of soil δ13C as an indicator of vegetation change in African savannas. Journal of Vegetation Science. 2004;15:339–350. [Google Scholar]
- Herppich M, Herppich WB, von Willert DJ. Leaf nitrogen content and photosynthetic activity in relation to soil nutrient availability in coastal and mountain fynbos plants (South Africa) Basic and Applied Ecology. 2002;3:297–391. [Google Scholar]
- Johnson D, Geisinger D, Walker R, Newman J, Vose J, Elliot K, et al. Soil pCO2, soil respiration, and root activity in CO2-fumigated and nitrogen-fertilized ponderosa pine. Plant and Soil. 1994;165:129–138. [Google Scholar]
- Lovegrove B. The living deserts of Southern Africa. Vlaeberg, SA: Fernwood Press; 1993. [Google Scholar]
- Meerow AW, Snijman DA. Phylogeny of Amaryllidaceae tribe Amaryllideae based on nrDNA ITS sequences and morphology. American Journal of Botany. 2001;88:2321–2330. [PubMed] [Google Scholar]
- Midgley GF, Wand SJE, Pammenter NW. Nutrient and genotypic effects on CO2-responsiveness: photosynthetic regulation of Leucadendron species of a nutrient-poor environment. Journal of Experimental Botany. 1999;50:533–542. [Google Scholar]
- Procheş S, Cowling RM. Proceedings of the 10th MEDECOS Conference. Rotterdam: Millpress; 2004. Cape geophytes: putting the pieces together; pp. 1–10. [Google Scholar]
- Rossa B, von Willert DJ. Physiological characteristics of geophytes in a semi-arid Namaqualand, South Africa. Plant Ecology. 1999;142:121–132. [Google Scholar]
- Russel EJ. Soil conditions and plant growth. 8th edn. London: Longmans, Green and Co; 1950. pp. 339–344. [Google Scholar]
- Schleser GH, Jayasekera R. 13C-variations of leaves in forests as an indication of reassimilated CO2 from the soil. Oecologia. 1985;65:536–542. doi: 10.1007/BF00379669. [DOI] [PubMed] [Google Scholar]
- Tolivia D, Tolivia J. Fasga: a new polychromatic method for simultaneous and differential staining of plant tissues. Journal of Microscopy. 1987;148:113–117. [Google Scholar]
- Viladomat F, Almanza GR, Codina C, Bastida J, Campbell WE, Mathee S. Alkaloids from Brunsvigia orientalis. Phytochemistry. 1996;43:1379–1384. [Google Scholar]
- Vorster P, Spreeth AD. Leaf anatomy and generic delimitation in South African Amaryllidaceae. In: van der Maesen LJG, van der Burgt XM, van Medenbach de Rooy JM, editors. The biodiversity of African plants. Proceedings of the XIVth AETFAT Congress; 22–27 August 1994; Wageningen, The Netherlands. Kluwer Academic Publishers; 1996. pp. 513–516. [Google Scholar]
Associated Data
This section collects any data citations, data availability statements, or supplementary materials included in this article.