

Abstract
Background and Aims
It has been proposed that having too much DNA may carry physiological consequences for plants. The strong correlation between DNA content, cell size and cell division rate could lead to predictable morphological variation in plants, including a negative relationship with leaf mass per unit area (LMA). In addition, the possible increased demand for resources in species with high DNA content may have downstream effects on maximal metabolic efficiency, including decreased metabolic rates.
Methods
Tests were made for genome size-dependent variation in LMA and metabolic rates (mass-based photosynthetic rate and dark respiration rate) using our own measurements and data from a plant functional trait database (Glopnet). These associations were tested using two metrics of genome size: bulk DNA amount (2C DNA) and monoploid genome size (1Cx DNA). The data were analysed using an evolutionary framework that included a regression analysis and independent contrasts using a phylogenetic tree with estimates of molecular diversification times. A contribution index for the LMA data set was also calculated to determine which divergences have the greatest influence on the relationship between genome size and LMA.
Key Results and Conclusions
A significant negative association was found between bulk DNA amount and LMA in angiosperms. This was primarily a result of influential divergences that may represent early shifts in growth form. However, divergences in bulk DNA amount were positively associated with divergences in LMA, suggesting that the relationship may be indirect and mediated through other traits directly related to genome size. There was a significant negative association between genome size and metabolic rates that was driven by a basal divergence between angiosperms and gymnosperms; no significant independent contrast results were found. Therefore, it is concluded that genome size-dependent constraints acting on metabolic efficiency may not exist within seed plants.
Key words: Leaf mass per unit area, LMA, photosynthesis, Amass, dark respiration, Rmass, genome size, phylogeny, independent contrasts, contribution index
INTRODUCTION
There is considerable variation in nuclear DNA content between plant species. This variation spans four orders of magnitude, from 2C = 0·134 Gbp in Genlisea aurea (Greilhuber et al., 2006) to approx. 250 Gbp in Fritillaria assyriaca (Bennett and Leitch, 2005a). Increases in DNA content largely occur by polyploidy or the accumulation of transposable elements. For polyploidy, DNA content can double in a single generation and it is now recognized that most angiosperms have a history of polyploidy in their ancestry (Wendel, 2000; Adams and Wendel, 2005). However, re-diploidization of the polyploid genome may be accompanied by genome downsizing and loss of DNA (Leitch and Bennett, 2004). The amplification of transposable elements is considered to have played a major role in increasing plant genome size (Bennetzen, 2002; Kidwell, 2002; Bennetzen et al., 2005). Whereas transposable elements appear to be ubiquitous in plant genomes, the proportion of the genome that they occupy varies considerably. Mechanisms for DNA content reduction are still poorly understood (Bennetzen and Kellogg, 1997; Petrov et al., 2000). However, unequal and illegitimate recombination and mechanisms involved in the repair of double-stranded breaks in DNA may play a significant role (Leitch and Bennett, 2004).
Although it is now recognized that the majority of the DNA comprising the genome of a species is largely repetitive (e.g. satellite and transposon sequences), the functional significance of this non-coding DNA is still far from clear. However, it has long been proposed that the nuclear DNA content has measurable phenotypic consequences. Studies showing strong correlations between genome size and cellular parameters (e.g. nuclear volume, meiotic and mitotic duration, and chromosome size) led Bennett (1972) to propose the ‘nucleotype hypothesis’, which states that bulk DNA content may play a significant non-genic role in the functioning of an organism. Since then many correlations at the cellular, tissue and whole organism level have been reported (reviewed in Bennett and Leitch, 2005b; Gregory, 2005a, b; Knight et al., 2005).
Because cell size is correlated with genome size, it seems plausible that DNA content may be a driver of leaf structural traits such as leaf mass per unit area (LMA, a measure of the density of a leaf). A study of 29 Pinus species demonstrated correlated evolution between DNA content and specific leaf area (SLA), the inverse of LMA (Grotkopp et al., 2004). More recently, Morgan and Westoby (2005) tested a data set spanning both gymnosperms and angiosperms and reported a significant positive relationship between LMA and 2C DNA content. However, the relationship was not maintained when analysed within a phylogenetic framework. Here, a larger comparative analysis of genome size and LMA (274 species in our analysis vs. 80 species in Morgan and Westoby) is reported, using a phylogenetic tree with estimates of molecular diversification times.
Observations have shown that despite an extensive range in DNA content most species have small genomes (Leitch et al., 1998). This led Knight et al. (2005) to suggest that species with large genomes are constrained in some way and they proposed ‘the large genome constraint hypothesis’. Among the examples cited in support of this hypothesis, Knight et al. (2005) showed preliminary evidence for a negative correlation between 2C DNA content and maximum photosynthetic rate based on a data set comprising just 24 species. The preliminary study of Knight et al. (2005) has been extended herein to test whether there is a correlation between DNA content and mass-based photosynthetic rate (Amass) for 134 species across a broad phylogenetic spectrum. The first quantification of the relationship between dark respiration rates (Rmass) and genome size is also made. Both of these metabolic rates are examined across gymnosperms and angiosperms together, gymnosperms alone and angiosperms alone, using both least-squares regression and independent contrasts analysis (Felsenstein, 1985). Previous studies have shown a negative correlation between DNA content and oxygen consumption rate in birds (Vinogradov, 1997; Gregory, 2002) and mammals (Vinogradov, 1995). Demonstrating a similar relationship in plants may help to explain why plant species considered rare and endangered tend to have large genomes (Vinogradov, 2003).
Apart from the preliminary study by Knight et al. (2005) the only other study to compare metabolic rates across species with varying DNA content was that by Austin et al. (1982). They estimated maximum photosynthetic rates in ten Triticum and Aegilops species (Poaceae), ploidy levels of which ranged from diploid to hexaploid. Their results showed a negative correlation between ploidy and photosynthetic rate. A few other investigators have examined the effects of within-species ploidy variation on photosynthetic rate, and both positive (e.g. Randall et al., 1977; Joseph et al., 1981) and negative (e.g. Garrett, 1978; Setter et al., 1978; Wullschleger et al., 1996) correlations have been reported. However, the generality of these results is questionable considering the limited taxonomic scope (all but one study were based on comparisons within a single species of Poaceae). To our knowledge, no large cross-species tests of this hypothesis have been made, much less tested using independent contrasts.
Two different measures of genome size are also used here to test for associations. Recently it has been reconciled that the term genome size should refer either to the total DNA amount in the nucleus (2C value) or, in a more restricted sense, to the DNA content of the monoploid genome (1Cx value; Greilhuber et al., 2005). The 1Cx value (calculated by dividing the 2C value by the ploidy level) is predicted to be similar between a diploid and autopolyploid race of the same species whereas the 2C DNA content should show step increases. However, it appears that formation of polyploid species may be accompanied by genome downsizing, which results in a smaller 1Cx value compared with the diploid progenitor species (Leitch and Bennett, 2004). Both 1Cx and 2C DNA with LMA and metabolic rates are used here to test for associations.
MATERIALS AND METHODS
Genome size and species selection
Estimates of 2C DNA content were compiled from the Plant DNA C-values database (prime estimates; Bennett and Leitch, 2005a). Amass and LMA were measured for 47 species with known 2C DNA contents growing at the Royal Botanic Gardens, Kew. Additional species with estimates of 2C DNA content were matched with measurements of Amass and LMA from the Glopnet database compiled by Wright et al. (2004). In addition, 2C DNA estimates were also matched with Rmass measurements from Glopnet. There were 134, 40 and 274 species with known 2C DNA content and Amass, Rmass and LMA, respectively. For species of known ploidy, the monoploid genome size (1Cx) was calculated by dividing the 2C value by the level of ploidy (i.e. 2x, 4x, etc.). Because many species have been reported to show a range of ploidy, only species in which one ploidy level has been reported were chosen. Therefore, 1Cx values were calculated for 56, 22 and 68 species for Amass, Rmass and LMA, respectively.
LMA dataset
LMA (g m−2) was measured by cutting seven replicate 1 × 1-cm leaf sections from each of the 47 species for which Amass had also been measured (see Appendix). These leaf sections were dried at 60°C for 6 days before weighing using an analytical balance. LMA data for an additional 227 species were added from the Glopnet database, giving a total of 274 species with data for both LMA and 2C DNA amount.
Species used for the analysis of DNA content and LMA comprised 249 angiosperms and 25 gymnosperms. The 2C DNA amounts showed a nearly 300-fold range, from 0·314 to 90·2 Gbp. The angiosperm sample included species with the highest and lowest 2C values in the data set and provided an adequate representation of the full range of 2C values currently known for angiosperms (0·134–249·7 Gbp). The angiosperm sample was well distributed phylogenetically, comprising 72 families spread across the major angiosperm groups (i.e. 54 eudicot, 13 monocot and five basal grade families). The gymnosperms were less well represented with 19 of the 25 species belonging to Pinaceae and the remaining six to Cupressaceae and Podocarpaceae. The 2C DNA values for gymnosperms had a four-fold range, from 15·9 to 59·2 Gbp. This range encompassed the mean 2C value for 207 gymnosperms currently in the Plant DNA C-values database (36·2 Gbp; the full list covers a 15-fold range, from 4·6 to 70·6 Gbp).
Amass and Rmass datasets
Amass was measured with a LiCor 6400 portable gas exchange system (Lincoln, NE, USA) for mature, fully expanded leaves of 47 species (Appendix). Area-based photosynthetic rates (Aarea) were taken in the field on sunny days between 0900 and 1500 h to ensure that leaves were light saturated. Aarea was converted to Amass (nmol g−1 s−1) by dividing Aarea (μmol m−2 s−1) by LMA (g m−2). The LiCor standard leaf chamber was used with internal CO2 set to 360 ppm and an LED light source set at the maximum output. When a leaf had reached its maximum photosynthetic rate, seven measurements were taken at random intervals. These values were averaged for three separate individuals per species. Maximum Amass was calculated from the arithmetic mean of the three leaf averages. Amass data for an additional 87 species were compiled from the Glopnet database. Therefore, the current analysis had 134 species with known 2C DNA content and Amass.
The Amass dataset consisted of 112 angiosperms and 22 gymnosperms. The 2C DNA amounts ranged 230-fold from 0·39 to 90·2 Gbp. The angiosperm sample was also well distributed phylogenetically, encompassing 38 species spread across the major angiosperm groups (i.e. 27 eudicot, nine monocot and two basal grade families). The gymnosperms were less well represented with 20 of the 22 species belonging to Pinaceae and the remaining two to Cupressaceae. However, the range of 2C DNA values for gymnosperms was identical to that exhibited in the LMA sample (15·9–59·2 Gbp).
Although Rmass was not directly measured, it was possible to match 40 species from the Glopnet database with measurements of Rmass and 2C DNA content estimates. This data set comprised 29 angiosperms and 11 gymnosperms. The angiosperm sample spanned only 13 families with a 2C DNA range of 0·833–25·4 Gbp. Again, the gymnosperm sample only included representatives of Pinaceae and Cupressaceae, with all but one species occurring in the former, but the gymnosperm sample did encompass the same range in 2C DNA values as the Amass data set (see above).
Constructing the phylogenetic tree
Because LMA was the largest data set and data for both Amass and Rmass also had LMA measurements, a ‘mega-tree’ from the LMA species list was constructed using Phylomatic (tree version R20040402; Webb and Donoghue, 2005). This online software is a compilation of previously published phylogenies and is intended to give the best representation of familial relationships among higher plants (Fig. 1). To date, Phylomatic has complete familial representation. The program first matches a particular species by genus, then by family. If one genus is missing within a particular family, the entire set of genera for that family is returned as a polytomy. Currently, Phylomatic does not have the capability to output resolution within genera; therefore, species within a genus are always returned as a polytomy. However, many of these polytomies were resolved by consulting current literature (see below) and the Angiosperm Phylogeny Website (APweb; Stevens, 2005). Phylogenetic trees for the Amass and Rmass data sets were then pruned from the resolved LMA ‘mega-tree’ using a tree pruning function within Phylocom (Webb et al., 2006).
Fig. 1.
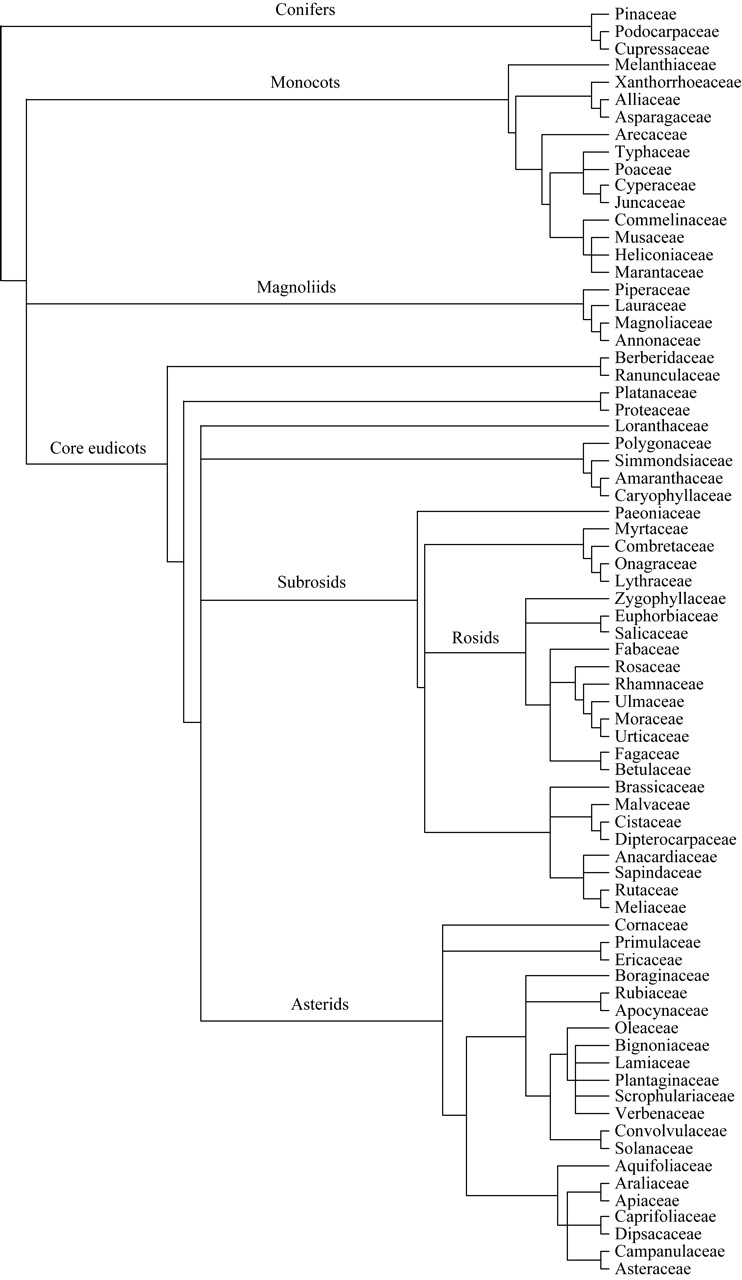
The LMA ‘mega-tree’ phylogeny from Phylomatic to the family level (Webb and Donoghue, 2005). Currently, Phylocom outputs relationships within families as polytomies; therefore, published systematic data were used to resolve many of them. Phylogenetic relationships for the Amass and Rmass data sets were pruned from the LMA ‘mega-tree’ using Phylocom (Webb et al., 2006; see Materials and Methods). Tree graphic created using TREEVIEW (Page, 1996).
The two largest polytomies occurred within Pinaceae and Poaceae. For familial resolution in Pinaceae the tree of Wang et al. (2000) was used, which was derived from combined plastid matK, mitochondrial nad5 and nuclear 4CL gene sequences. Another large polytomy was found within Pinus, for which the ‘super-tree’ published by Grotkopp et al. (2004) was used. For Poaceae, polytomies were corrected using a genus-level ‘super-tree’ constructed from both molecular and morphological data (Salamin et al., 2002). Other, much smaller polytomies (i.e. Malvaceae and Asteraceae) were corrected using the APweb where the position was based on the placement of the subfamily or tribe. However, not all polytomies could be resolved owing to incomplete phylogenetic information.
Branch length information for the ‘mega-tree’ was taken from age estimates published by Wikström et al. (2001). These authors applied a non-parametric rate-smoothing algorithm (which allows for different clades to evolve at different rates) to a three-gene dataset that spanned nearly 75% of angiosperm families. Estimates were then calibrated at a single point within the fossil record (the Fagales–Curcubitales divergence, 84 Mya), thus providing the most current hypothesis of angiosperm diversification times. Dated nodes from Wikström et al. (2001) matched 29 of 207 divergences in our LMA ‘mega-tree’. The branch length adjustment algorithm in Phylocom (BLADJ; Webb et al., 2006) was then used to estimate ages for undated nodes. BLADJ sets a root node at a specified age and dates undated nodes by distributing them evenly between nodes with known ages and terminal taxa, thereby minimizing variance in branch length (Webb et al., 2006). As a rule, these ages within our phylogeny should be treated as approximations.
Statistical analyses
The relationship between genome size (2C DNA and 1Cx DNA) and LMA, Amass and Rmass was analysed using regression and independent contrasts (see below). In addition, a contribution index was calculated to determine which divergences within the LMA ‘mega-tree’ influenced the regression results for 2C DNA and LMA. As the data set includes two distinct groups of seed plants, gymnosperms and angiosperms, the influence that each group had on the overall relationship was investigated. Both regression and independent contrasts analyses were carried out on each group separately. All variables violated the assumption of normality; therefore, the data for all traits were log transformed to achieve normality. Analysis of the data indicated that two points were outlying in respect of the rest of the data set in their respective class. The Amass calculations for Pseudotsuga menziesii and LMA calculations for Pinus monophylla, contributed by the Glopnet dataset, were clearly outliers. These values were assumed to be errors in the database and were thus omitted from the analyses.
Regression
To test for an association between genome size and Amass, Rmass and LMA least-squares regression was used. Cross-species analyses, such as least-squares regression, complement analyses that are corrected for phylogenetic independence (independent contrasts, see below). Relationships found across extant species represent trends that are occurring today, whereas independent contrasts determine the number of times each trend arose through evolutionary time. Thus, congruence and/or discrepancies in the results between the two methods tell a more complete story than if only regression or independent contrasts had been used. The use of a regression analysis afforded a direct comparison between slope estimates and coefficients of determination (R2) of analyses that are corrected for phylogenetic independence (see below). R (R Development Core Team, 2005) was used to perform the least-square regression analyses and to obtain slope estimates and R2.
Independent contrasts
The analysis of traits (AOT) module of Phylocom (developed by Ackerly, 2006) was used to calculate correlations between genome size, Amass and LMA (all treated as continuous traits) using independent contrasts. The AOT algorithm calculates divergences between extant species and internal node averages and standardizes them by incorporating branch length information (Felsenstein, 1985). For polytomies, AOT uses the method developed by Pagel (1992), in which species within a particular polytomy are ranked based on the value of x (here x is genome size). The median value is then used to create two groups, one containing the higher and the other the lower values. The mean is then calculated for each trait between the two groups and the difference between these means is treated as one contrast. This reduces the overall sample size, and consequently the number of independent contrasts, echoing the necessity for a maximally resolved phylogenetic tree.
AOT is useful in that it sets the sign of the contrast for the x variable (genome size) to always be positive and all other traits (Amass, Rmass and LMA) are then compared in the same direction across the node (Ackerly, 2006). This is important because it keeps the direction of subtraction consistent when performing independent contrasts. However, because the direction of subtraction is subjective, subtraction in the opposite direction will result in a contrast with a reversed sign. Thus, all contrasts inherently have a mean value of zero and regression analysis of independent contrasts must be forced through the origin to account for this property (Garland et al., 1992). The output of our standardized contrasts from AOT was utilized and R (R Development Core Team, 2005) was used to obtain slope estimates and coefficients of determination (R2) from a regression analysis forced through the origin.
Contribution index
The contribution index for the LMA ‘mega-tree’ was calculated. The contribution index is a measure of how much a divergence at a particular node in a ‘mega-tree’ influences the relationship between two traits across present-day species (Moles et al., 2005). The contribution index is the product of the amount of variation within a focal clade that is from a particular focal divergence and the amount of the total variation within that focal clade compared with the whole tree (for a detailed discussion, see Moles et al., 2005). Thus, large divergences leading to a large number of descendant species with a large spread in trait data typically result in a higher contribution index. Both components of a contribution index are derived from different partitioning of the sum of square deviations from internal node averages estimated by Phylocom. The decomposition of the sum of squares from AOT for trait divergences at each node was used to calculate each component and, subsequently, the contribution index.
RESULTS
Complete results for our regression and independent contrast analyses of the relationship between genome size (2C and 1Cx DNA content), LMA and metabolic rates (Amass and Rmass) are given in Table 1.
Table 1.
Results for the regression analyses across all species and for angiosperms and gymnosperms analysed separately for 2C and 1Cx DNA content with leaf mass per unit area (LMA), mass-based photosynthetic rate (Amass) and dark respiration rate (Rmass)
| (A) Regression | LMA (g m−2) | Amass (nmol g−1 s−1) | Rmass (nmol g−1 s−1) | ||||||
|---|---|---|---|---|---|---|---|---|---|
| n | R2 | Slope | n | R2 | Slope | n | R2 | Slope | |
| All 2C DNA | 274 | 0·029** | 0·093** | 134 | 0·136** | −0·288** | 40 | 0·062 | −0·133 |
| Angiosperms 2C DNA | 249 | 0·030** | −0·098** | 112 | <0·001 | −0·016 | 29 | 0·109 | 0·238 |
| Gymnosperms 2C DNA | 25 | 0·199* | 0·516* | 22 | 0·184* | −0·546* | 11 | 0·072 | 0·173 |
| All 1Cx DNA | 68 | 0·213** | 0·226** | 56 | 0·363** | −0·433** | 22 | 0·452** | −0·341** |
| Angiosperms 1Cx DNA | 51 | 0·034 | −0·086 | 39 | 0·004 | −0·050 | 12 | <0·001 | 0·018 |
| Gymnosperms 1Cx DNA | 17 | 0·374** | 0·882** | 17 | 0·319* | −0·961* | 10 | 0·122 | 0·374 |
| (B) Independent contrasts | Ncont | R2 | Slope | Ncont | R2 | Slope | Ncont | R2 | Slope |
| All 2C DNA | 206 | 0·055** | 0·169** | 115 | <0·001 | <0·001 | 34 | 0·018 | 0·065 |
| Angiosperms 2C DNA | 185 | 0·055** | 0·167** | 96 | <0·001 | 0·006 | 23 | 0·031 | 0·084 |
| Gymnosperms 2C DNA | 20 | 0·043 | 0·332 | 18 | 0·091 | −0·866 | 10 | 0·005 | −0·066 |
| All 1Cx DNA | 52 | 0·024 | −0·083 | 45 | 0·008 | 0·060 | 18 | 0·009 | 0·043 |
| Angiosperms 1Cx DNA | 37 | 0·036 | −0·100 | 30 | 0·027 | 0·095 | 8 | 0·071 | 0·114 |
| Gymnosperms 1Cx DNA | 14 | 0·084 | 0·445 | 14 | 0·149 | −1·211 | 9 | 0·004 | −0·076 |
R2 and the slope are shown for both the regression (analyses without independent contrasts) and the independent contrasts analyses. Regressions for the independent contrasts were forced through the origin. Ncont refers to the number of contrasts in the independent contrasts analyses.
*P < 0·05; **P < 0·01.
Genome size and LMA
Analysis across all species showed a significant positive relationship between 2C DNA content and LMA. This was retained in the analysis of gymnosperms alone; however, for angiosperms alone a significant negative relationship was found (Fig. 2A). The relationship across all species and gymnosperms alone when using 1Cx DNA content (monoploid genome size) showed a much greater magnitude for slope coefficients and these explained a greater proportion of the variation compared with results using 2C DNA content (Table 1; Fig. 2B). However, the negative relationship within angiosperms was no longer significant with 1Cx DNA content.
Fig. 2.

The relationship between genome size and (A, B) leaf mass per unit area (LMA) and (C, D) photosynthetic rate (Amass) without correcting for the influence of phylogeny. Data are split into gymnosperms (closed circles) and angiosperms (open circles). For 2C DNA content and LMA (A), angiosperms alone have a significant negative relationship, and gymnosperms alone have significant positive relationship. For 1Cx DNA content and LMA (B), the significant positive relationship within gymnosperms is retained; however, the relationship is no longer significant within angiosperms. For 2C DNA content and Amass (C), for gymnosperms alone the relationship is significantly negative, whereas for angiosperms alone the slope is nearly zero. Near identical results were found when testing for a relationship between 1Cx DNA content and Amass (D).
Independent contrasts showed a significant positive relationship between divergences in 2C DNA content and divergences in LMA across all species (Fig. 3A). This relationship was driven primarily by divergences within angiosperms; there was no significant trend for divergences within gymnosperms alone (Table 1). When using 1Cx rather than 2C DNA amount there was no evidence of correlated evolution (Fig. 3B).
Fig. 3.

Contrast plots depicting the relationship between divergences in genome size and (A, B) divergences in leaf mass per unit area (LMA) and (C, D) divergences in photosynthetic rate (Amass). The regression lines are forced through the origin. Divergences in 2C DNA are significant and positively correlated with divergences in LMA (A); this relationship is driven by divergences within angiosperms (divergences in gymnosperms were not significant). Divergences in 1Cx DNA content (B) are not correlated with divergences in LMA for all analyses. Divergences in 2C DNA content (C) and 1Cx DNA content (D) are not correlated with divergences in both Amass and Rmass (data not shown; see Table 2).
Contribution index scores for the LMA ‘mega-tree’ revealed that relatively few deep nodes explain the discrepancy between results of our regression and independent contrasts analyses for LMA (Table 2). The significant positive relationship across all species can be explained by the divergence between the low-LMA angiosperms (249 spp., mean LMA = 65·3 g m−2) and the high-LMA gymnosperms (25 spp., mean LMA = 213·6 g m−2). This node makes the largest contribution to present-day 2C DNA content variation (Table 2). The positive relationship found within gymnosperms appears to be driven by the divergence of the clade leading to Larix spp. and Pseudotsuga menziesii (three species, mean LMA = 93·3 g m−2) from the rest of Pinaceae (combined mean LMA = 213·6 g m−2), a node that ranks eighth overall in importance. Across all angiosperms, the negative regression relationship appears to be driven by four highly influential negative divergences (larger genome species having lower LMA; Table 2). One, in particular, corresponded to a polytomy at the base of the angiosperm sample representing the unknown sequence of divergences across the monocots (mean LMA = 53·7 g m−2), magnoliids (mean LMA = 72·4 g m−2) and eudicots (mean LMA = 69·2 g m−2). This node was the second most important for explaining present-day 2C DNA content variation (Table 2). Large contributions from positive contrasts (larger genome species having higher LMA) all occurred within relatively smaller genome clades and exhibited small contributions to present-day 2C DNA variation (Table 2). This observation may help to explain the large variation in LMA at the lower end of the 2C DNA distribution in angiosperms (Fig. 2A).
Table 2.
The top ten divergences making the largest contribution to present-day LMA variation (ranked 1–10). For these divergences, the rank of the contribution to 2C DNA variation explained by these nodes (2C DNA rank) was also determined. The contribution index for both LMA and 2C DNA is listed (for details on calculations see Materials and Methods). The sign of the contrast is set so that genome size is always positive and contrasts in LMA are then compared in the same direction across the node. Thus, a positive contrast refers to the larger genome species having higher LMA, and a negative contrast refers to the larger genome species having lower LMA.
| Rank | LMA contribution | Divergences making the largest contribution | 2C DNA rank | 2C DNA contribution | Sign of contrast |
|---|---|---|---|---|---|
| 1 | 0·574 | Angiosperms vs. gymnosperms | 1 | 0·465 | + |
| 2 | 0·041 | Polytomy at the base of the core eudicots | 11 | 0·006 | + |
| 3 | 0·037 | Polytomy at the base of Poales | 3 | 0·067 | – |
| 4 | 0·032 | Proteales vs. core eudicots | 41 | 0·001 | – |
| 5 | 0·029 | Polytomy across monocots, magnoliids and eudicots | 2 | 0·074 | – |
| 6 | 0·014 | Prosopis glandulosa vs. the rest of Fabaceae | 54 | <0·001 | + |
| 7 | 0·012 | Poales vs. the rest of the commelinids | 25 | 0·002 | – |
| 8 | 0·011 | Larix spp. and Pseudotsuga menziesii vs. the rest of Pinaceae | 52 | <0·001 | + |
| 9 | 0·011 | Divergence at the base of eurosid 2 | 12 | 0·006 | + |
| 10 | 0·010 | Polytomy at the base of the rosids | 81 | <0·001 | + |
Genome size and metabolic rate
Photosynthetic rate
The relationship across all species indicated a significant and negative association between 2C DNA content and Amass (Table 1). When analysed separately, gymnosperms retained a significant negative relationship, whereas angiosperms alone did not show a significant trend in either direction (Fig. 2C). Analyses using 1Cx DNA content mirrored the above results; however, the magnitudes for all significant slope coefficients were much greater (Table 1; Fig. 2D). Independent contrasts showed that the relationship between divergences in 2C DNA content and divergences in Amass across all species was not significant and the slope was nearly zero (Fig. 3C), as was that as for divergences within angiosperms or gymnosperms when analyzed separately (Table 1). When 1Cx rather than 2C values were analysed, no significant result was found (Fig. 3D).
Respiration rate
Across all species, angiosperms alone and gymnosperms alone the relationship between 2C DNA content and Rmass was not significant (Table 1). Analysis across all species using 1Cx revealed a strong significant and negative relationship with Rmass. However, no significant relationship was found when analysing both angiosperms alone and gymnosperms alone (Table 1). Independent contrast analysis revealed no significant relationship between divergences in genome size (2C or 1Cx DNA) and divergences in Rmass when all species, gymnosperms alone or angiosperms alone were analysed (Table 1).
DISCUSSION
Genome size and LMA
Tests for genome size-dependent variation in LMA were made using data from a published plant functional trait database (Wright et al., 2004) and from our own measurements. Across all present-day species, the regression analyses revealed a significant positive relationship between genome size and LMA, primarily driven by a basal divergence between angiosperms and gymnosperms. When analysed separately, gymnosperms exhibit a significant positive trend, whereas the relationship is significantly negative for angiosperms alone (Fig. 2A; Table 1). However, the contribution index results showed that these trends were also artefacts of deep divergences within each of the seed plant phylogenetic trees (Table 1). Further evolutionary analyses showed that divergences in 2C DNA content (but not 1Cx DNA; Fig. 3B) were significant and positively correlated with divergences in LMA (Fig. 3A), primarily driven by divergences within angiosperms (there was no correlated evolution within gymnosperms; Table 1). Thus, the results underline the importance of using independent contrasts when testing for correlated evolution between genome size and LMA.
Within angiosperms, the negative relationship between 2C DNA content (bulk nuclear DNA) and LMA was stronger when compared with testing the relationship using 1Cx DNA content (monoploid genome size; Fig. 2A and B). This suggests that the relationship between genome size and LMA may be driven purely by changes in bulk DNA amount rather than reductions to the monoploid genome through polyploidy. It is not surprising that there is a significant negative relationship between bulk DNA content and LMA. We hypothesized that the strong association between 2C DNA content and cell size might drive a genome size/LMA correlation (Rees et al., 1966; Edwards and Endrizzi, 1975; Bennett et al., 1983; Lawrence, 1985; Sugiyama, 2005). Species with large genomes, and concomitantly larger cells, have lower LMA and perhaps rely more on turgor pressure for biomechanical support of the leaf (Grime and Mowforth, 1982; Grime et al., 1997).
Relatively few nodes, however, drove the overall negative trend across all angiosperms. In particular, the negative divergence across the node representing the trichotomy of the monocots, magnoliids and eudicots contributed much of the variation in LMA and 2C DNA content (Table 2). This large divergence in LMA may represent a shift in growth form, such as being woody or herbaceous (as has been shown by Morgan and Westoby, 2005). Fossil evidence of leaf morphology for early monocots suggests they were largely herbaceous with rare occurrences of woody growth forms. Early monocots probably grew in shady, disturbed environments (Wing and Boucher, 1998; Feild et al., 2003). Extant herbaceous species are generally categorized as having low LMA (Wright et al., 2004; Morgan and Westoby, 2005). Conversely, the origin of the magnoliids and eudicots (according to our data set) was associated with an increase in LMA coupled with lower 2C DNA content. The fossil record indicates that early dicots were woody species with small, thick leaves. This shift in leaf morphology may have been associated with mechanical and environmental stress (including herbivory). By the late Cretaceous, there was a wide variety of growth forms within the dicots (Hickey and Doyle, 1977; Wing and Boucher, 1998).
Although the above discussion may help to explain highly influential divergences in the predicted direction, it does not elucidate why the direction of correlated evolution between 2C DNA amount and LMA has largely been positive across the angiosperms. The positive divergences might provide evidence that the relationship may actually be indirect, and 2C DNA content may be related to other variables that also influence LMA. Furthermore, the positive relationship might be driven by extrinsic environmental factors that co-select large genome size and large LMA without any functional inter-relationship (Grime and Mowforth, 1982; Knight and Ackerly, 2002).
By contrast, gymnosperms appear to have a different evolutionary trajectory. Regression analysis of genome size and LMA for gymnosperms alone was strongly significant in the positive direction; however, independent contrast results were not significant (Table 1). The discrepancy between the regression and independent contrasts results suggests that within gymnosperms, genome size and LMA exhibit a high degree of phylogenetic signal. The positive divergence between the Larix/Pseudotsuga clade and the rest of Pinaceae drove the regression result, and subsequent divergences have not been correlated; this is a pattern suggestive of trait similarity among closely related species. This contradicts previous studies showing significant correlated evolution between genome size and SLA (the inverse of LMA) within the genus Pinus (Grotkopp et al., 2004). However, the analysis had only 25 species of gymnosperms and 19 were from Pinaceae. Clearly, a more comprehensive phylogenetic sample of gymnosperms is needed to ascertain whether the results reveal fundamental evolutionary differences between angiosperms and gymnosperms.
Our independent contrast results for the relationship between genome size and LMA contradict Morgan and Westoby (2005). These authors reported no significant correlated evolution between 2C DNA content and LMA using a phylogenetic tree with branch lengths set equal. However, we found a significant independent contrast result using branch length information from Wikström et al. (2001). Although our test involved more species (274 vs. 80), the incongruity between our result and that of Morgan and Westoby is primarily due to our use of the Wikström branch lengths. If branch lengths are arbitrarily set to be equal, the results are no longer significant (R2 = 0·004, slope = 0·045, P = 0·341). Furthermore, the use of equal branch lengths reduces the variation explained by an order of magnitude (Requal2 = 0·004 vs. RWik2 = 0·054), and thus underestimates the slope coefficient. In light of these results, we caution against the indiscriminate use of equal branch lengths when testing for correlated evolution, especially for comparative studies involving deep basal divergences.
Genome size and metabolic rates
The significantly negative regression result across all species for genome size and both measures of metabolic rate (Amass and Rmass) appears to support the hypothesis that the accumulation of bulk DNA (2C DNA) may impose a constraint on metabolic rates. However, this relationship was influenced by inherent differences between angiosperms and gymnosperms (Fig. 2C) that may or may not involve genome size. In addition, variation in monoploid genome size (1Cx), not bulk DNA content (2C), was the stronger predictor of the regression relationship across the two lineages of seed plants (Table 1; Fig. 2D). Furthermore, independent contrast analysis showed that divergences in genome size (2C and 1Cx DNA) have not been associated with divergences in metabolic rates within either angiosperms or gymnosperms (Table 1). Therefore, there is insufficient evidence to support a universal genome size-dependent constraint on metabolic efficiency within seed plants, which has been proposed for birds (Vinogradov, 1997; Gregory, 2002) and mammals (Vinogradov, 1995).
In this study of gymnosperms, many of the slope estimates and R2 values were large but not significant. This is likely to be a result of the relatively small sample size. Angiosperms, by contrast, have a wide range of genome sizes, and therefore correlated trends should be easier to detect (however, for the traits in our analysis they were often not significant). Sampling more species with large genomes in both the gymnosperms and the angiosperms, as well as increasing the phylogenetic representation of gymnosperms should be a priority. Furthermore, there should be a continued effort to combine information from plant functional trait databases (Glopnet; Wright et al., 2004) with plant genome size estimates (Plant C-value database; Bennett and Leitch, 2005a). This effort is important for clarifying the evolutionary implications of plant genome size evolution.
ACKNOWLEDGEMENTS
We thank Professor Michael Bennett for hosting us at Kew Gardens and for discussions about the results, Lynda Hanson for making sure our stay at Kew was productive and pleasant, Richard Fryer for accommodation during our stay at Kew, and the MORPH Research Coordination Network for providing financial support for travel to Kew. We also thank Mike Fay and two anonymous reviewers whose comments greatly improved the manuscript.
APPENDIX
Forty-seven species with mass photosynthetic rate (Amass) and leaf mass per unit area (LMA) with known 2C DNA content measured for this study. All species were growing and measured at the Royal Botanic Gardens, Kew, in the summer of 2004.
| Family | Species | Amass (nmol g−1 s−1) | LMA (g m−2) |
|---|---|---|---|
| Alliaceae | Clivia miniata | 29·60 | 83·18 |
| Apocynaceae | Catharanthus roseus | 723·16 | 30·20 |
| Asparagaceae | Convallaria majalis | 20·14 | 40·74 |
| Betulaceae | Betula pubescens | 99·74 | 75·86 |
| Cistaceae | Cistus salviifolius | 192·79 | 112·20 |
| Cistaceae | Helianthemum nummularium | 278·30 | 87·10 |
| Commelinaceae | Commelina coelestis | 107·00 | 53·70 |
| Commelinaceae | Commelina dianthifolia | 232·25 | 37·15 |
| Fagaceae | Fagus sylvatica | 82·27 | 95·s50 |
| Fagaceae | Quercus cerris | 127·07 | 100·00 |
| Fagaceae | Quercus robur | 119·51 | 117·49 |
| Heliconiaceae | Heliconia rostrata | 456·38 | 30·20 |
| Lamiaceae | Salvia splendens | 329·93 | 56·23 |
| Lythraceae | Lawsonia inermis | 933·52 | 28·18 |
| Lythraceae | Punica granatum | 106·79 | 67·61 |
| Magnoliaceae | Liriodendron tulipifera | 193·16 | 60·26 |
| Malvaceae | Gossypium hirsutum | 446·91 | 25·70 |
| Malvaceae | Theobroma cacao | 146·08 | 35·48 |
| Malvaceae | Thespesia populnea | 368·95 | 32·36 |
| Marantaceae | Calathea bachemiana | 75·83 | 48·98 |
| Marantaceae | Maranta bicolor | 86·71 | 53·70 |
| Moraceae | Morus alba | 238·50 | 54·95 |
| Musaceae | Musa acuminata | 40·46 | 38·90 |
| Oleaceae | Fraxinus excelsior | 354·90 | 48·98 |
| Oleaceae | Ligustrum vulgare | 74·01 | 95·50 |
| Paeoniaceae | Paeonia clusii | 93·89 | 56·23 |
| Piperaceae | Peperomia fenzlei | 8·42 | 91·20 |
| Piperaceae | Peperomia glabella | 141·54 | 42·66 |
| Piperaceae | Peperomia obtusifolia | 32·72 | 131·83 |
| Piperaceae | Piper cernum | 71·41 | 81·28 |
| Platanaceae | Platanus orientalis | 170·92 | 75·86 |
| Poaceae | Alopecurus pratensis | 190·70 | 87·10 |
| Poaceae | Avena barbata | 286·01 | 66·07 |
| Poaceae | Brachypodium pinnatum | 156·82 | 50·12 |
| Poaceae | Briza maxima | 256·70 | 46·77 |
| Poaceae | Bromus inermis | 194·00 | 104·71 |
| Poaceae | Elymus caninus | 276·92 | 112·20 |
| Poaceae | Molinia caerulea | 95·15 | 87·10 |
| Poaceae | Phalaris aquatica | 373·97 | 57·54 |
| Poaceae | Secale montanum | 389·26 | 70·79 |
| Ranunculaceae | Helleborus lividus | 129·57 | 102·33 |
| Rosaceae | Prunus avium | 80·02 | 72·44 |
| Rosaceae | Sorbus alnifolia | 262·60 | 67·61 |
| Rubiaceae | Bouvardia ternifolia | 232·84 | 87·10 |
| Rubiaceae | Coffea arabica | 62·63 | 64·57 |
| Rubiaceae | Coffea canephora | 100·61 | 33·88 |
| Xanthorrhoeaceae | Aloe ciliaris | 2·70 | 104·71 |
LITERATURE CITED
- Ackerly DD. Analysis of Traits (AOT): a module of Phylocom. 2006 Version 3·1. http://www.phylodiversity.net/phylocom/ [Google Scholar]
- Adams KL, Wendel JF. Novel patterns of gene expression in polyploid plants. Trends in Genetics. 2005;21:539–543. doi: 10.1016/j.tig.2005.07.009. [DOI] [PubMed] [Google Scholar]
- Austin RB, Morgan CL, Ford MA, Bhagwat SG. Flag leaf photosynthesis in Triticum aestivum and related diploid and tetraploid species. Annals of Botany. 1982;49:177–189. [Google Scholar]
- Bennett MD. Nuclear DNA content and minimum generation time in herbaceous plants. Proceedings of the Royal Society of London B. 1972;181:109–135. doi: 10.1098/rspb.1972.0042. [DOI] [PubMed] [Google Scholar]
- Bennett MD, Leitch IJ. Plant DNA C-values database. 2005a doi: 10.1007/978-1-0716-3389-2_9. (release 4·0, October 2005). http://www.kew.org/cval/homepage.html . [DOI] [PubMed] [Google Scholar]
- Bennett MD, Leitch IJ. Genome size evolution in plants. In: Gregory TR, editor. The evolution of the genome. San Diego: Elsevier; 2005b. pp. 89–162. [Google Scholar]
- Bennett MD, Heslop-Harrison JS, Smith JB, Ward JP. DNA density in mitotic and meiotic metaphase chromosomes of plants and animals. Journal of Cell Science. 1983;63:173–179. doi: 10.1242/jcs.63.1.173. [DOI] [PubMed] [Google Scholar]
- Bennetzen JL. Mechanisms and rates of genome expression and contraction in flowering plants. Genetica. 2002;115:29–36. doi: 10.1023/a:1016015913350. [DOI] [PubMed] [Google Scholar]
- Bennetzen JL, Kellogg EA. Do plants have a one-way ticket to genomic obesity? Plant Cell. 1997;9:1509–1514. doi: 10.1105/tpc.9.9.1509. [DOI] [PMC free article] [PubMed] [Google Scholar]
- Bennetzen JL, Ma J, Devos KM. Mechanisms of recent genome size variation in flowering plants. Annals of Botany. 2005;95:127–132. doi: 10.1093/aob/mci008. [DOI] [PMC free article] [PubMed] [Google Scholar]
- Edwards GA, Endrizzi JL. Cell size nuclear size and DNA content relationships in. Gossypium. Canadian Journal of Genetics and Cytology. 1975;17:181–186. [Google Scholar]
- Feild TS, Arens NC, Dawson TE. The ancestral ecology of angiosperms: emerging perspectives from extant basal lineages. International Journal of Plant Sciences. 2003;164:S129–S142. [Google Scholar]
- Felsenstein J. Phylogenies and the comparative method. The American Naturalist. 1985;125:1–15. doi: 10.1086/703055. [DOI] [PubMed] [Google Scholar]
- Garland T, Harvey PH, Ives AR. Procedures for the analysis of comparative data using phylogenetically independent contrasts. Systematic Biology. 1992;41:18–32. [Google Scholar]
- Garrett MK. Control of photorespiration at RuBP carboxylase/oxygenase level in ryegrass cultivars. Nature. 1978;274:913–915. [Google Scholar]
- Gregory TR. A bird's eye view of the C-value enigma: genome size, cell size, and metabolic rate in the class Aves. Evolution. 2002;56:121–130. doi: 10.1111/j.0014-3820.2002.tb00854.x. [DOI] [PubMed] [Google Scholar]
- Gregory TR. The C-value enigma in plants and animals: a review of parallels and an appeal for partnership. Annals of Botany. 2005a;95:133–146. doi: 10.1093/aob/mci009. [DOI] [PMC free article] [PubMed] [Google Scholar]
- Gregory TR. Genome size evolution in animals. In: Gregory TR, editor. The evolution of the genome. San Diego: Elsevier; 2005b. pp. 3–87. [Google Scholar]
- Greilhuber J, Doležel J, Lysák MA, Bennett MD. The origin, evolution, and proposed stabilization of terms ‘genome size’ and ‘C-value’ to describe nuclear DNA contents. Annals of Botany. 2005;95:255–260. doi: 10.1093/aob/mci019. [DOI] [PMC free article] [PubMed] [Google Scholar]
- Greilhuber J, Borsch T, Müller K, Worberg A, Porembski S, Barthlott W. Smallest angiosperm genomes found in Lentibulariaceae with chromosomes of bacterial size. Plant Biology. 2006;8:1–8. doi: 10.1055/s-2006-924101. [DOI] [PubMed] [Google Scholar]
- Grime JP, Mowforth MA. Variation in genome size–and ecological interpretation. Nature. 1982;299:151–153. [Google Scholar]
- Grime JP, Thompson K, Hunt R, Hodgson JG, Cornelissen JHC, Rorison IH, et al. Integrated screening validates primary axes of specialization in plants. Oikos. 1997;79:259–281. [Google Scholar]
- Grotkopp E, Rejmanek M, Sanderson MJ, Rost TL. Evolution of genome size in pines (Pinus) and its life-history correlates: supertree analyses. Evolution. 2004;58:1705–1729. doi: 10.1111/j.0014-3820.2004.tb00456.x. [DOI] [PubMed] [Google Scholar]
- Hickey LJ, Doyle JA. Early Cretaceous fossil evidence for angiosperm evolution. The Botanical Review. 1977;43:3–104. [Google Scholar]
- Joseph MC, Randall DD, Nelson CJ. Photosynthesis in polyploid tall fescue. Plant Physiology. 1981;68:894–898. doi: 10.1104/pp.68.4.894. [DOI] [PMC free article] [PubMed] [Google Scholar]
- Kidwell MJ. Transposable elements and the evolution of genome size in eukaryotes. Genetica. 2002;115:49–63. doi: 10.1023/a:1016072014259. [DOI] [PubMed] [Google Scholar]
- Knight CA, Ackerly DD. Variation in nuclear DNA content across environmental gradients: a quantile regression analysis. Ecology Letters. 2002;5:66–76. [Google Scholar]
- Knight CA, Molinari NA, Petrov DA. The large genome constraint hypothesis: evolution, ecology, and phenotype. Annals of Botany. 2005;95:177–190. doi: 10.1093/aob/mci011. [DOI] [PMC free article] [PubMed] [Google Scholar]
- Lawrence ME. Senecio L. (Asteraceae) in Australia: nuclear DNA amounts. Australian Journal of Botany. 1985;33:221–232. [Google Scholar]
- Leitch IJ, Bennett MD. Genome downsizing in polyploid plants. Biological Journal of the Linnean Society. 2004;82:651–663. [Google Scholar]
- Leitch IJ, Chase MW, Bennett MD. Phylogenetic analysis of DNA C-values provides evidence for a small ancestral genome size in flowering plants. Annals of Botany. 1998;82(Suppl. A):85–94. [Google Scholar]
- Moles AT, Ackerly DD, Webb CO, Tweddle JC, Dickie JB, Westoby M. Brief history of seed size. Science. 2005;307:576–580. doi: 10.1126/science.1104863. [DOI] [PubMed] [Google Scholar]
- Morgan HD, Westoby M. The relationship between nuclear DNA content and leaf strategy in seed plants. Annals of Botany. 2005;96:1321–1330. doi: 10.1093/aob/mci284. [DOI] [PMC free article] [PubMed] [Google Scholar]
- Page RDM. TREEVIEW: an application to display phylogenetic trees on personal computers. Computer Applications in the Biosciences. 1996;12:357–358. doi: 10.1093/bioinformatics/12.4.357. [DOI] [PubMed] [Google Scholar]
- Pagel MD. A method for the analysis of comparative data. Journal of Theoretical Biology. 1992;156:431–442. [Google Scholar]
- Petrov DA, Sangster TA, Johnston JS, Hartl DL, Shaw KL. Evidence for DNA loss as a determinant of genome size. Science. 2000;287:1060–1062. doi: 10.1126/science.287.5455.1060. [DOI] [PubMed] [Google Scholar]
- R Development Core Team. R: a language and environment for statistical computing. Vienna: R Foundation for Statistical Computing, Austria; 2005. ISBN 3-900051-07-0, url http://www.R-project.org . [Google Scholar]
- Randall DD, Nelson CJ, Asay KH. Ribulose bisphosphate carboxylase: altered genetic expression in tall fescue. Plant Physiology. 1977;59:38–41. doi: 10.1104/pp.59.1.38. [DOI] [PMC free article] [PubMed] [Google Scholar]
- Rees H, Cameron FM, Hararika MH, Jones GH. Nuclear variation between diploid angiosperms. Nature. 1966;211:828–830. doi: 10.1038/211828a0. [DOI] [PubMed] [Google Scholar]
- Salamin N, Hodkinson TR, Savolainen V. Building supertrees: an empirical assessment using the grass family (Poaceae) Systematic Biology. 2002;51:136–150. doi: 10.1080/106351502753475916. [DOI] [PubMed] [Google Scholar]
- Setter TL, Schrader LE, Bingham ET. Carbon dioxide exchange rates, transpiration and leaf characteristics in genetically equivalent ploidy levels in alfalfa. Crop Science. 1978;18:327–332. [Google Scholar]
- Stevens PF. Angiosperm Phylogeny Website. 2005 Version 6, May 2005; www.mobot.org/MOBOT/research/APweb/ [Google Scholar]
- Sugiyama S. Developmental basis of interspecific differences in leaf size and specific leaf area among C3 grass species. Functional Ecology. 2005;19:916–924. [Google Scholar]
- Vinogradov AE. Nucleotypic effects in homeotherms: body-mass-corrected basal metabolic rate of mammals is related to genome size. Evolution. 1995;49:1249–1259. doi: 10.1111/j.1558-5646.1995.tb04451.x. [DOI] [PubMed] [Google Scholar]
- Vinogradov AE. Nucleotypic effects in homeotherms: body-mass-independent resting metabolic rate of passerine birds is related to genome size. Evolution. 1997;51:220–225. doi: 10.1111/j.1558-5646.1997.tb02403.x. [DOI] [PubMed] [Google Scholar]
- Vinogradov AE. Selfish DNA is maladaptive: evidence from the plant Red list. Trends in Genetics. 2003;19:609–614. doi: 10.1016/j.tig.2003.09.010. [DOI] [PubMed] [Google Scholar]
- Wang XQ, Tank DC, Sang T. Phylogeny and divergence times in Pinaceae: evidence from three genomes. Molecular Biology and Evolution. 2000;17:773–781. doi: 10.1093/oxfordjournals.molbev.a026356. [DOI] [PubMed] [Google Scholar]
- Webb CO, Donoghue M. Phylomatic: a database for applied phylogenetics. 2005 url: http://www.phylodiversity.net/phylomatic. [accessed: 5 September, 2005] [Google Scholar]
- Webb CO, Ackerly DD, Kembel SW. Phylocom: software for the analysis of community phylogenetic structure and character evolution. 2006 doi: 10.1093/bioinformatics/btn358. version 3·40. url: http://www.phylodiversity.net/phylocom . [DOI] [PubMed] [Google Scholar]
- Wendel J. Genome evolution in polyploids. Plant Molecular Biology. 2000;42:225–249. [PubMed] [Google Scholar]
- Wikström N, Savolainen V, Chase MW. Evolution of the angiosperms: calibrating the family tree. Proceedings of the Royal Society of London B. 2001;268:2211–2220. doi: 10.1098/rspb.2001.1782. [DOI] [PMC free article] [PubMed] [Google Scholar]
- Wing SL, Boucher LD. Ecological aspects of the Cretaceous flowering plant radiation. Annual Review of Earth and Planetary Science. 1998;26:379–421. [Google Scholar]
- Wright IJ, Reich PB, Westoby M, Ackerly DD, Baruch Z, Bongers F, et al. The world-wide leaf economics spectrum. Nature. 2004;428:821–827. doi: 10.1038/nature02403. [DOI] [PubMed] [Google Scholar]
- Wullschleger SD, Sanderson MA, McLaughlin SB, Biradar DP, Rayburn AL. Photosynthetic rates and ploidy levels among populations of switchgrass. Crop Science. 1996;36:306–312. [Google Scholar]