

Abstract
Backgrounds and Aims
Identification of physiological traits associated with leaf photosynthetic rate (Pn) is important for improving potential productivity of rice (Oryza sativa). The objectives of this study were to develop a model which can explain genotypic variation and ontogenetic change of Pn in rice under optimal conditions as a function of leaf nitrogen content per unit area (N) and stomatal conductance (gs), and to quantify the effects of interaction between N and gs on the variation of Pn.
Methods
Pn, N and gs were measured at different developmental stages for the topmost fully expanded leaves in ten rice genotypes with diverse backgrounds grown in pots (2002) and in the field (2001 and 2002). A model of Pn that accounts for carboxylation and CO2 diffusion processes, and assumes that the ratio of internal conductance to gs is constant, was constructed, and its goodness of fit was examined.
Key Results
Considerable genotypic differences in Pn were evident for rice throughout development in both the pot and field experiments. The genotypic variation of Pn was correlated with that of gs at a given stage, and the change of Pn with plant development was closely related to the change of N. The variation of gs among genotypes was independent of that of N. The model explained well the variation in Pn of the ten genotypes grown under different conditions at different developmental stages.
Conclusions
The response of Pn to increased N differs with gs, and the increase in Pn of genotypes with low gs is smaller than that of genotypes with high gs. Therefore, simultaneous improvements of these two traits are essential for an effective breeding of rice genotypes with increased Pn.
Key words: Model, leaf photosynthesis, genotypic and ontogenetic variation, rice (Oryza sativa), leaf nitrogen content, stomatal conductance, internal conductance
INTRODUCTION
Breeding of rice genotypes with higher yield potential is required to meet the increasing demand for this staple cereal caused by a rapid increase of the human population in Asia. In situations where useful genes for improved plant type have already been utilized in the existing high-yielding rice, identification of physiological traits associated with higher yield is necessary for breeding of genotypes that break through the current plateau of yield potential. Since recently bred high-yielding cultivars commonly possess effective plant structures and sufficient leaf area index (LAI) for light interception after panicle initiation, high yield potential of rice is associated with higher leaf photosynthetic rate (Pn) during the late reproductive period (Horie et al., 2003; Takai et al., 2006) and the grain filling (Arjunan et al., 1990; Kuroda and Kumura, 1990; Sasaki and Ishii, 1992). Therefore, identification of traits determining Pn is of primary importance for increased yield potential of rice.
Previous studies showed that a large genotypic variation exists in Pn of rice and its relatives (Cook and Evans, 1983; Yeo et al., 1994; Horie et al., 2003). Pn under current atmospheric CO2 concentration is limited by carboxylation capacity that is determined by the amount of Rubisco and its kinetics (Farquhar and Sharkey, 1982; Makino et al., 1985). While genotypic differences in Rubisco kinetic parameters are small in rice (Makino et al., 1987), large genotypic variation has been reported for leaf nitrogen content, which correlates with the amount of Rubisco (Cook and Evans, 1983; Horie et al., 2003). Thus, the genotypic variation of Pn in rice has been related to that of leaf nitrogen content per unit area (N) (Cook and Evans, 1983). However, N is not only a genetic trait but is also affected by plant ontogenetic development and nitrogen management (Hasegawa and Horie, 1996). Furthermore, a number of studies have indicated that stomatal conductance for CO2 diffusion (gs) limits Pn under ambient CO2 concentrations (Kuroda and Kumura, 1990; Miah et al., 1997). Although N and gs have been suggested to be major factors limiting Pn, the interactive effects of these traits on the variation of rice Pn have not been quantitatively evaluated yet.
The primary objective of this study was to develop a model which can explain genotypic and ontogenetic variation of Pn in rice, based on experimental data, i.e. N content and gaseous diffusive conductance. Pn, N and gs were measured at different developmental stages for ten rice genotypes grown in pots (2002) and in the field (2001 and 2002). By analysing the data thus obtained, a model was synthesized to explain genotypic and ontogenetic variation of Pn based on CO2 diffusion equations. There are two assumptions concerning the nature of internal conductance (gw) in the leaf. One was that gw was mainly determined by the surface area of the chloroplasts facing the cell walls (Sc) and that Sc was proportional to N (von Caemmerer and Evans, 1991; Evans et al. 1994). The other was that the variation of gw was proportional to that of gs (Loreto et al., 1992; Lauteri et al., 1997). An examination was carried out into which assumption for gw could better explain the genotypic and ontogenetic variation of Pn in rice grown under optimum conditions. Here, the results of the measurements, modelling and simulation of genotypic and ontogenetic variation in rice Pn are reported.
MATERIALS AND METHODS
Plant materials
Ten widely different rice cultivars were collected from diverse rice cultivating regions in the world. Four cultivars, ‘Takanari’, ‘IR72’, ‘Shanguichao’ and ‘Ch86’, are indica genotypes; three cultivars, ‘Nipponbare’, ‘Takenari’ and ‘Koshihikari’, are temperate japonica genotypes; the cultivar, ‘Banten’ is a tropical japonica genotype; IR65564-44-2-2 (‘NPT’) was bred by crossing tropical japonica and indica, and was named as a new plant type by the International Rice Research Institute (IRRI); WAB450-I-B-P-38-HB (‘WAB’) is an interspecific hybrid genotype between O. sativa ssp. japonica and O. glaberrima, and named NERICA (new rice for Africa) by the West Africa Rice Development Association (WARDA). ‘Takenari’, ‘Ch86’ and ‘Banten’ are traditional cultivars, and the others are improved ones. ‘Takanari’, ‘IR72’ and ‘Shanguichao’ are high-yielding cultivars among the improved cultivars (Horie et al., 2003).
Cultivation conditions
In the pot experiment in 2002, each cultivar was sown on 30 April and two seedlings transplanted on 24 May into 3·8 L pots with 12 replicates. Plants were grown outdoors and under flooding at Kyoto, Japan (35°2′N, 135°47′E, 65 m altitude) and received full sunlight until the gas exchange measurements. Nitrogen, phosphorus and potassium were applied at 0·3 g per pot as basal dressing, and 0·1 g of nitrogen was top-dressed biweekly to maintain high plant nitrogen status throughout the entire growth period.
Field experiments were done at Kyoto, Japan in 2001 and 2002. The soil was alluvial loam soil classified into Haplaquept. The rice genotypes with three replicates were sown in seed beds on 2 May and 30 April, and transplanted into the main fields on 23 May and 25 May in 2002 and 2001, respectively. The experiment was a randomized block design. Each plot was >20 m−2, and hill spacing was 0·15×0·3 m (density: 22·2 hill m−2) in both years. Each plot was fertilized with 4 g m−2 of nitrogen and 12 g m−2 of phosphorus and potassium as basal, and top-dressed with 2 g m−2 of nitrogen every 20 d until 10 d after heading. For tall cultivars of ‘Ch86’ and ‘Banten’, the amounts of basal and top-dressing nitrogen fertilizer were reduced to half that of the other cultivars to avoid lodging.
Measurements of leaf photosynthetic rate and stomatal conductance
Pot experiment
The exchange rates of CO2 and water vapour were measured in the topmost fully expanded leaves at panicle initiation (PI), heading and 3 weeks after heading (3 WAH) by an open gas exchange system devised in the authors' laboratory. From the afternoon of the day before gas exchange measurement, plants in the pots were kept in a black net (transmittance 60 %) to avoid high light and wind in order to maintain favourable leaf water status during gas exchange measurements. Four leaves from each cultivar were enclosed in four acrylic chambers (30×5·5×6·5 cm, length×width×height) in one measurement series. Two series of measurements were made for one cultivar, and thus eight leaves of one genotype were measured at one developmental stage. Concentrations of CO2 and water vapour at the inlet and outlet of the chamber were simultaneously monitored by an infrared gas analyser (LI-7000, LI-COR, Lincoln, NE, USA). Photosynthetic photon flux (PPF) at the leaf surface, measured with a quantum sensor (LI-190SH, LI-COR), was first set to zero to obtain the dark respiration rate. Then, the leaves were irradiated at 1000 µmol m−2 s−1 with halogen lamps (JD500W-M, IWASAKI, Tokyo, Japan) for 30 min and gas exchange rates measured at a PPF of 1500 µmol m−2 s−1. The air around each leaf was stirred by four fans (DC Fine Ace 20, SANYO DENKI, Tokyo, Japan) installed inside the chamber to maximize boundary layer conductance (1·07 mol CO2 m−2 s−1), which was measured with a wetted filter paper. Leaf temperature was 30±1·2 °C, measured with a copper–constantan thermocouple appressed to the lower leaf surface, vapour pressure deficit was 1·0±0·1 kPa and CO2 concentration was 349±0·1 µmol mol−1 at the leaf surface. Leaf and air temperatures were recorded with a data logger (DR232, YOKOGAWA, Tokyo, Japan). From these measurements, leaf gas exchange parameters were calculated according to von Caemmerer and Farquhar (1981).
Field experiment
Pn and gs in the topmost fully expanded leaves of each genotype were measured with apparatus for photosynthesis and transpiration measurements (LI-6400, LI-COR). The measurements were made from 1000 h to 1300 h under natural sunlit and light-saturated conditions (PPF >1200 µmol m−2 s−1) for ten genotypes on clear days during the period from PI to maturity (MT) in both years. Leaf temperature was 31±1·1 °C and the CO2 concentration at the leaf surface averaged 346±6·2 µmol mol−1 over measurements. The values measured at a relative humidity (RH) <70 % were discarded. Pn and gs were averaged for four developmental stages; from PI to 2 weeks before heading (2 WBH), from 2 WBH to full heading (FH), from FH to 2 weeks after full heading (2 WAH) and from 2 WAH to MT. At least 12 leaves were used to determine Pn and gs for each developmental stage for each genotype.
Measurement of leaf nitrogen concentration
In the pot experiment, the nitrogen concentration of the leaf used for gas exchange measurements was measured, and in the field experiment the nitrogen concentration of the whole canopy leaves of two plants harvested at PI, 2 WBH, FH, 2 WAH and MT of each plot was measured. After measurement of leaf area with a meter (LI-3000, LI-COR), they were oven-dried at 80 °C for at least 72 h, weighed and then the N concentration measured by the Kjeldahl method for both the experiments. Nitrogen concentrations in leaves at the four developmental stages in the field experiment are averaged values of the concentrations at the beginning and the end of each stage.
The model
Based on Fick's law, Pn was given by the product of gs and the difference between CO2 concentrations on the leaf surface (Ca) and in intercellular airspaces (Ci). Similarly, Pn can also be expressed by the product of gw and the difference between CO2 concentrations in intercellular airspaces and chloroplast stroma (Cc). Namely,
 |
1 |
 |
2 |
Photosynthetic response to change in CO2 concentration is generally presented as a Michaelis–Menten equation. However, the response from zero to atmospheric CO2 concentration can also be regarded as linear apparently, with the initial slope representing carboxylation capacity (Farquhar and Sharkey, 1982). Since Makino et al. (1987) showed that there is little variation in the amount of Rubisco per unit of leaf-soluble protein or its kinetics among diverse rice genotypes and their wild relatives, carboxylation capacity is, in this study, assumed proportional to N with an empirical proportionality constant k1:
| 3 |
where RL is the mitochondrial dark respiration rate in the light, N0 is N when the amounts of Rubisco reached zero, as reviewed by Evans (1989), and Γ* is the CO2 compensation point when Pn is zero in the absence of RL. Γ* was fixed considering the consistency of the Rubisco kinetic parameters among Oryza species (Makino et al., 1987) and set to be 43·8 µmol mol−1 for rice leaves at 30 °C, referring to Horie (1981).
The dark respiration rate in the dark (Rd) was about 5 % of Pn over all cultivars and developmental stages in this study (data not shown). High irradiance inhibited mitochondrial dark respiration (Brooks and Farquhar, 1985) and RL was much smaller than Rd at 30 °C (Atkin et al., 2000). On the basis of these results, it was assumed that RL has little effect on the absolute value of Pn and could be neglected.
Then, combining eqns (1)–(3) and assuming RL=0, the following equation was obtained:
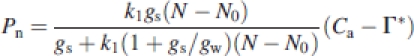 |
4 |
Since the internal conductance, gw, was not measured in this study, eqn (4) includes three unknown values: k1, N0 and gw. These were estimated by applying the measured data set of Pn, N, gs and Ca, and the constant, Γ*, to eqn (4). Thus, these estimates represent the average of the individual leaves. Two different assumptions on the nature of gw in the calculation were also made. The first was based on von Caemmerer and Evans (1991) and Evans et al. (1994) that gw was correlated with Sc, which in turn was proportional to N. In this case, gw was represented by
 |
5a |
where k2 was an empirical parameter. The second was based on Loreto et al. (1992) and Lauteri et al. (1997), and gw was proportional to gs with little variation in the similar proportionality constant among plant species. In this case,
 |
5b |
where k3 is another empirical constant. Using eqns (4) and (5a) or (5b), Pn of the ten genotypes at different developmental stages were regressed against their N, gs and Ca to obtain best estimates for the values of parameters k1, N0 and k2, or k3 on the assumption that these parameter values are independent of genotypes and developmental stages. A least-squares method for non-linear functions was applied for this regression to minimize the sum of squared errors between measured and estimated Pn values. The regression was determined separately for the data set of the pot experiment and that of the field experiment, because of the different sampling methods for N measurements. Pn measurements on 240 leaves (ten genotypes×eight leaves×three developmental stages) were analysed for the pot experiment and 40 measurements (ten genotypes×four developmental stages) for the field experiment in 2001. The 40-data set from the 2002 field experiment was used for validation of the model developed from the 2001 field experiment.
RESULTS
Pot-grown rice
Pn and N of pot-grown rice drastically declined by 3 WAH, but gs declined only slightly (Table 1). Pn differed significantly among the genotypes and ranged from 12·9 to 19·9, 14·4 to 23·4 and 5·8 to 13·9 µmol m−2 s−1 at PI, heading and 3 WAH, respectively. Pn was significantly higher in ‘Takanari’, ‘IR72’ and ‘WAB’ than in ‘Ch86’ at all developmental stages. There were also significant genotypic differences in N and gs at each developmental stage. ‘Ch86’ consistently had the lowest N throughout development, while ‘Takanari’, ‘IR72’ and ‘NPT’ had the highest N. ‘Takanari’ maintained significantly higher gs than ‘Ch86’, ‘Nipponbare’ and ‘Takenari’. Genotypes with higher Pn tended to have higher N and/or gs.
Table 1.
Genotypic differences in photosynthetic rate, stomatal conductance for CO2 and leaf nitrogen content per unit area for the ten rice genotypes grown in pots at panicle initiation (PI), heading and 3 weeks after heading (3 WAH)
| Cultivar | Photosynthetic rate (μmol m−2 s−1) |
Leaf nitrogen content per unit area (g m−2) |
Stomatal conductance for CO2 (mol m−2 s−1) |
||||||
|---|---|---|---|---|---|---|---|---|---|
| PI* | Heading | 3 WAH | PI | Heading | 3 WAH | PI | Heading | 3 WAH | |
| ‘Takanari’ | 18·7ab | 23·4a | 12·5a | 1·39ab | 1·57a | 0·95ab | 0·39a | 0·32a | 0·36a |
| ‘IR72’ | 18·7ab | 21·6abc | 13·9a | 1·43ab | 1·43abc | 0·95ab | 0·28abc | 0·34a | 0·36a |
| ‘Shanguichao’ | 15·3bcd | 22·6ab | 10·4ab | 1·24bc | 1·38abc | 0·76bc | 0·20bc | 0·32a | 0·25ab |
| ‘Ch86’ | 12·9d | 14·4d | 5·8c | 1·05c | 1·08d | 0·67c | 0·19c | 0·19b | 0·11c |
| ‘Nipponbare’ | 15·3bcd | 18·0c | 7·8bc | 1·24bc | 1·49ab | 0·92abc | 0·19c | 0·18b | 0·10c |
| ‘Takenari’ | 18abc | 17·5cd | 6·8bc | 1·42ab | 1·42abc | 0·91abc | 0·20bc | 0·20b | 0·10c |
| ‘Koshihikari’ | 16·9abc | 20·4abc | 10·1abc | 1·38ab | 1·22cd | 1·05a | 0·28abc | 0·19b | 0·20bc |
| ‘Banten’ | 14·3cd | 18·8c | 10·4ab | 1·24bc | 1·30bcd | 0·91abc | 0·23bc | 0·24ab | 0·19bc |
| ‘NPT’† | 15·3bcd | 19·6bc | 10·3ab | 1·56a | 1·43abc | 0·97ab | 0·18c | 0·24ab | 0·17bc |
| ‘WAB’† | 19·9a | 18·2c | 12·3a | 1·37ab | 1·38abc | 1·15a | 0·34ab | 0·19b | 0·23b |
*Values are shown as mean of eight leaves.
†‘NPT’ and ‘WAB’ indicate IR65564-44-2-2 and ‘WAB’450-I-B-P-38-HB, respectively.
Figures followed by a different letter are significantly different at the 5 % level among genotypes with the Tukey test.
Pn values of the ten rice genotypes were plotted against N (Fig. 1A) and against gs (Fig. 1B) for each developmental stage. The relationship between Pn and N in the ten genotypes was not significant at a given developmental stage, but was significant with a correlation coefficient, r, of 0·85 (P<0·001) when all the data at different stages were aggregated. In contrast, Pn of the ten genotypes was significantly correlated with gs at each stage, with an r of 0·77, 0·81 and 0·91 at PI, heading and 3 WAH, respectively (P<0·01), but the regression lines differed with developmental stages.
Fig. 1.

Relationships between photosynthetic rate and nitrogen content per unit area of leaves (A), and stomatal conductance for CO2 (B) of ten genotypes of rice grown in pots at panicle initiation (PI), heading and 3 weeks after heading (3 WAH). Each point means an average value of eight leaves for each genotype. * denotes significance at the 5 % level, and ** at the 1% level.
Field-grown rice
Figure 2 shows Pn, N and gs for the different developmental stages of the ten genotypes grown under field conditions in 2001 and 2002. Pn and N of all the genotypes changed markedly with stage of development. Plants grown in 2001 had greater Pn and N at the early reproductive stages than those in 2002. This might be related to the higher solar radiation before PI in 2001 than in 2002, which affects soil temperature and thus nitrogen mineralization. In contrast to Pn and N, the ontogenetic change of gs was small in all ten genotypes in both years, except for the late grain-filling stages (2 WAH to MT).
Fig. 2.
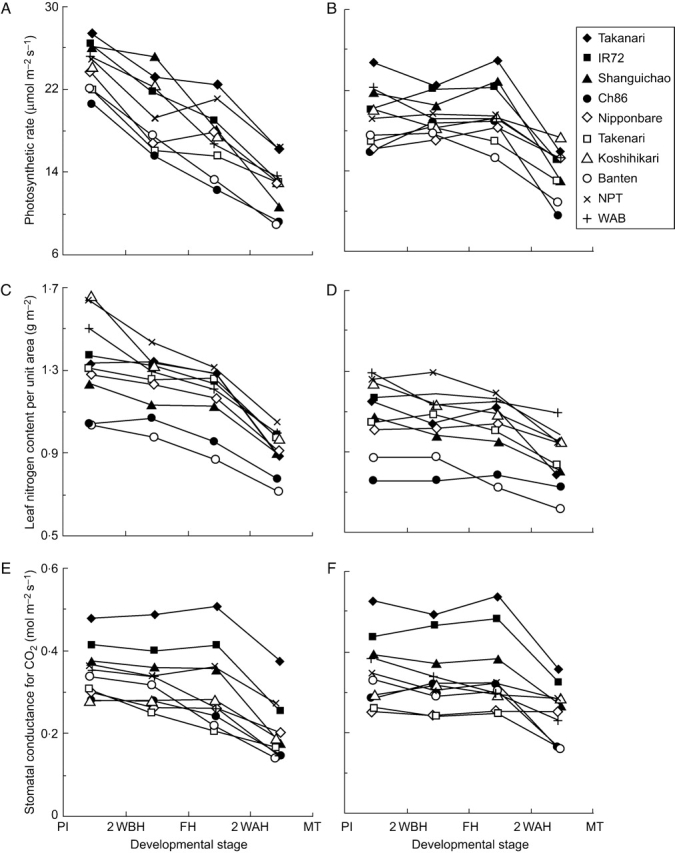
Changes of photosynthetic rate (A, B), leaf nitrogen content per unit area (C, D) and stomatal conductance for CO2 (E, F) with developmental stage of ten rice genotypes grown under field conditions in 2001 (A, C, E) and 2002 (B, D, F).
Considerable genotypic differences were observed in Pn, N and gs at each stage in both years. Pn and gs of ‘Takanari’, ‘IR72’ and ‘Shanguichao’ were greater than those of ‘Ch86’ and ‘Banten’ throughout development. While ‘NPT’ maintained high N, its Pn was intermediate among the cultivars. There were similarities in these genotypic differences in Pn, gs and N in the field experiment in the two years and also in the pot experiment. Genotypic differences in Pn, N and gs were >5·3 µmol m−2 s−1, 0·48 g m−2 and 0·20 mol CO2 m−2 s−1, respectively, at each developmental stage in the two years.
Three-way analysis of variance (ANOVA) was carried out to evaluate the effects of genotype (G), developmental stage (D) and year (Y) and their interactions on total variance of Pn, gs and N in the ten genotypes at three developmental stages up to 2 WAH in the two years (Table 2). G explained 44·9, 46·2 and 80·7 % of the total variance of Pn, N and gs, respectively. D and D×Y gave significant effects not only on the variance of Pn but also on that of N, while their effects on gs were very limited.
Table 2.
Contributions (% of sum of squares) of genotype (G), developmental stage (D), year (Y) and their interactions (G×D, D×Y, G×Y) to total variance in photosynthetic rate, leaf nitrogen content per unit area and stomatal conductance for CO2 for the ten rice genotypes during the developmental period from panicle initiation to 2 weeks after heading in the field experiment
| Factor | Photosynthetic rate | Leaf nitrogen content per unit area | Stomatal conductance for CO2 |
|---|---|---|---|
| Genotype (G) | 44·9** | 56·7** | 80·7** |
| Developmental stage (D) | 16·3** | 6·4** | 1·0* |
| Year (Y) | 1·8** | 23·3** | 0·8* |
| G×D | 4·6* | 4·0** | 3·5 |
| G×Y | 2·6* | 1·1* | 2·5* |
| D×Y | 18·8** | 1·3** | 1·0* |
| Total | 89·0 | 92·7 | 89·5 |
*Significant at P=0·05; **significant at P=0·01.
Pn of the ten genotypes grown in the field in 2001 and 2002 was plotted against N and gs for each developmental stage (Fig. 3). As in the pot-grown rice, N poorly explained genotypic difference of Pn at a given stage except at the late grain-filling stage, but gs explained the genotypic difference of Pn at all developmental stages in both years with the higher correlation coefficients. There was a significant linear relationship between Pn and N over all genotypes and developmental stages, with an r of 0·80 in 2001 and of 0·67 in 2002 (P<0·001). Since there was no association between gs and N of the ten diverse cultivars in any of the pot and the two field experiments, the genotypic variation of gs was thought to be independent of that of N.
Fig. 3.
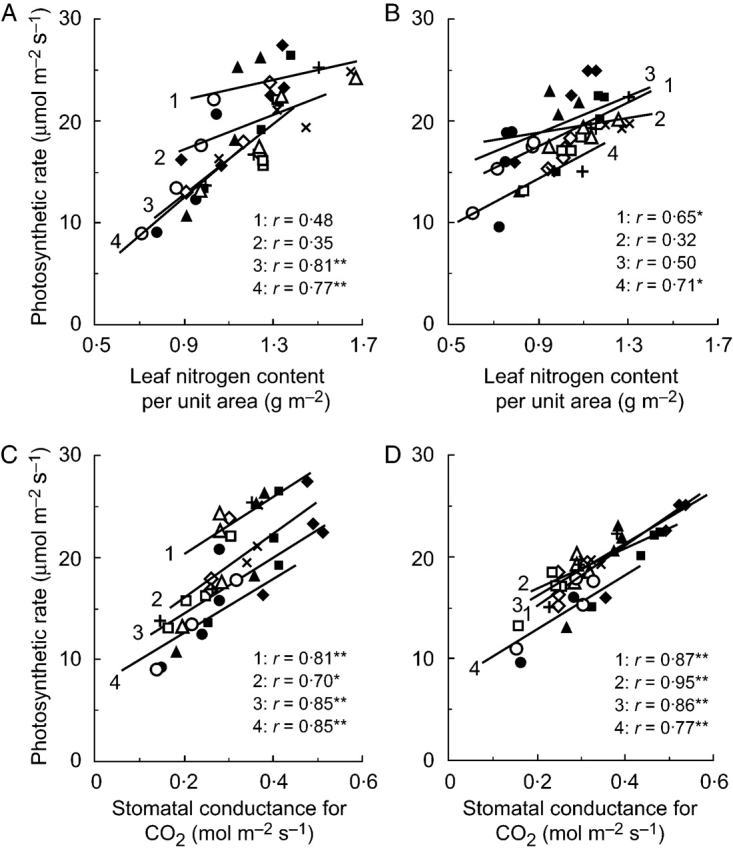
Relationships between photosynthetic rate and nitrogen content per unit area of leaves (A, B), and stomatal conductance for CO2 (C, D) of ten rice genotypes measured at four different developmental stages from field experiments in 2001 (A, C) and 2002 (B, D). The number on the lines show the developmental stage: 1, panicle initiation to 2 weeks before heading (2 WBH); 2, 2 WBH to heading; 3, heading to 2 weeks after heading (2 WAH); 4, 2 WAH to maturity. Symbols are the same as in Fig. 2. *denotes significance at the 5% level, and **at the 1% level.
Model application
Figure 4 shows the results of the application of Pn, gs and N data obtained for the ten genotypes at three developmental stages of pot-grown rice to the two models assuming that gw is proportional to N (eqn 5a, called the N-model hereafter) and that gw is proportional to gs (eqn 5b, called the gs-model hereafter). The gs-model accounted for the measured Pn of the ten rice genotypes at all developmental stages better than the N-model did (R2=0·85 and 0·79 for the former and the latter, respectively.). The N-model underestimated Pn of ‘IR72’ and ‘Banten’, but overestimated that of ‘Ch86’, ‘NPT’ and ‘Takenari’. On the other hand, the gs-model simulated the measured genotypic and ontogenetic variation of Pn well, with smaller biases for all the cultivars.
Fig. 4.

Relationships between measured and estimated leaf photosynthetic rate (Pn; μmol m−2 s−1) by the models (eqn 4) assuming that the internal conductance (gw) is proportional to leaf nitrogen content per unit area (A), and assuming that gw is proportional to stomatal conductance (B), using data from the pot experiment. Data points include those at panicle initiation, heading and 3 weeks after heading. Symbols are the same as in Fig. 2. Both the relationships are significant at the 1% level.
Similarly, the gs-model explained more of the variation in Pn of the ten genotypes grown under field conditions in 2001 than the N-model (Fig. 5, R2=0·80 and 0·53 for the former and the latter, respectively, P<0·001). For the model validation, the two models with the parameter values of k1, N0 and k2, or k3 estimated from the 2001 field experiment were applied to the measured data in 2002. The Pn measured in 2002 was also well explained by the gs-model with R2=0·66 (P<0·001), whereas the N-model could not explain the measured Pn better than N alone.
Fig. 5.

Relationships between measured and estimated leaf photosynthetic rate (Pn; μmol m−2 s−1) by the models (eqn 4) assuming that the internal conductance (gw) is proportional to leaf nitrogen content per unit area (A), and that gw is proportional to stomatal conductance (B), in 2001 (solid line) and 2002 (dashed line) field experiments. The parameter values estimated from the 2001 experiment were applied to the 2002 model analysis. Data points include those at four different developmental stages from panicle initiation to maturity. Symbols are the same as in Fig. 3. All the relationships are significant at the 1% level.
DISCUSSION
Considerable genotypic differences in Pn were evident for rice throughout development in both the pot and field experiments (Table 1, Fig. 2). Sasaki and Ishii (1992) reported that recent cultivars had higher Pn during grain filling as a result of the breeding of high-yielding japonica cultivars in Japan. In the present study, high-yielding indica genotypes such as ‘Takanari’, ‘IR72’ and ‘Shanguichao’ had higher Pn throughout development. The ten genotypes in the field had sufficient leaf area for full light interception with LAI >4·0 during the late reproductive stages in both years (data not shown). This suggests that the high biomass productivity of the three genotypes, as indicated earlier (Horie et al., 2003), would be attributable to their high Pn.
The present data show that gs was a stable and mainly genotypic trait with small ontogenetic change except for the late grain-filling stage (Table 2). Although N varied partly with developmental stage and year, the ranking of genotypes was very conservative. The genotypic difference in Pn at each developmental stage was better explained by gs than by N while the change of Pn with development was explained by that of N (Figs 1 and 3). These results confirmed that both gs and N are the major factors determining the variation of rice Pn among genotypes and developmental stages. It is noticeable that the genotypic variation in N was unrelated to that in gs among the rice genotypes used here.
There are many reports indicating strong correlations of Pn with N in rice, as reviewed by Sinclair and Horie (1989). A number of empirical models have been proposed to explain the variation of Pn solely by N for rice and other crops (Sinclair and Horie, 1989; Peng et al., 1995; Boote et al., 1998). However, N alone did not explain the genotypic difference of Pn of diverse Oryza species (Takano and Tsunoda, 1971; Cook and Evans, 1983). The model proposed here based on N and gs explained Pn measured for the ten genotypes grown under both pot and field conditions at different developmental stages very well (Figs 4 and 5). Therefore, a significant improvement of the model based on N in explaining the genotypic difference of Pn by incorporating gs was demonstrated.
Table 3 shows the parameter values estimated by the model for pot-grown and field-grown rice. The estimated N0 values of 0·35 for pot-grown rice and 0·27 for field-grown rice were similar to the value of 0·3 reported previously on rice (Sinclair and Horie, 1989). There were noticeable differences between the estimated values in the pot- and field-grown rice; the former had larger N0 and smaller k1 values than the latter. These differences probably reflected the differences in N measurements. While N was measured for the Pn-measured leaf in the pot experiment, it was an average for the whole leaf canopy in the field experiment and lower than that of the Pn-measured leaf since leaf nitrogen usually decreases from the top to the bottom of the canopy. The reason for the difference in the estimate for k3 between the pot and field experiments is not clear. Although boundary layer conductance is not involved in calculated gs, the different boundary layer conductance in the different measurement apparatus between pot and field experiments might have affected gs. Also, the different conditions for plant culture such as rhizosphere size might have affected gs relative to gw. However, the gw/gs ratios (k3) of 1·21 estimated for pot-grown and 0·89 for field-grown rice agree with the experimental reports that gw is comparable with gs (Loreto et al., 1992; Epron et al., 1995). A modified model that assumes gw to be infinitely large (k3=+∞) results in substantially lower goodness of fit (R2=0·79 and 0·53 for the pot and the 2001 field experiments, respectively) than the model proposed here (not shown). The similarities of the parameter values N0 and k3 from the model analysis to those from previous studies led to the presumption that the values were estimated reasonably, from a data set with large variations in Pn, N and gs and with differences between N and gs among the genotypes and developmental stages.
Table 3.
Parameter values estimated from the model application (eqns 4 and 5b) for the photosynthetic rates measured for the ten genotypes grown under pot (2002) and field (2001) conditions at different developmental stages, and their goodness of fit
| k1 (mol CO2 g N−1 s−1) | k3 (ratio) | N0 (g N m−2) | Bias | R2 | |
|---|---|---|---|---|---|
| Pot experiment | 0·10 | 1·21 | 0·35 | 1·00 | 0·84 |
| Field experiment | 0·13 | 0·89 | 0·27 | 1·00 | 0·80 |
Pn responses to N increase are curvilinear and can be simulated by applying the estimates from the pot-grown rice to Eqn 4 (Fig. 6). The model shows that Pn responses to N differ with gs values. The Pn increase of genotypes with low gs, such as japonica, is smaller than that of genotypes with high gs. This suggests that effective breeding of rice genotypes with higher Pn might be achieved through parallel efforts on improving both N and gs. Further, ‘Takanari’, which is regarded as one of the most high-yielding cultivars, exhibited the highest gs of 0·39 mol m−2 s−1 at PI (Table 1). The Pn response curve with gs of 0·4 mol m−2 s−1 corresponded closely with the function showing maximum Pn for the existing rice genotypes reported by Sinclair and Horie (1989) in a wide range of N. The model predicts that Pn would increase approx. 13 % at the N level of 1·5 g m−2 if gs is further improved from 0·4 to 0·6 mol m−2 s−1.
Fig. 6.

Response curves of photosynthetic rate to increased leaf nitrogen content per unit area with different stomatal conductance (gs). These curves are derived from the data for pot-grown rice (Table 3) applied to eqn (4). Symbols represent gs of 0·1, 0·2, 0·4 and 0·6 mol CO2 m−2 s−1 as indicated. The dashed line is the response curve reported by Sinclair and Horie (1989).
The model explained the variation of Pn better when it assumed a constant gw/gs ratio for both experiments. Co-ordinated variations in gw and gs have been reported for plant species with similar leaf morphology (Loreto et al., 1992; Lauteri et al., 1997; Hanba et al., 2003). This co-ordination may explain the high correlation between gs and Pn observed at a given developmental stage.
The strong correlations between Pn and gs are partly due to the greater variability of gs than N. In the pot experiment, the coefficient of variance in gs was 29, 26 and 47 % at PI, heading and 3 WAH, respectively, much larger than those in N, i.e. 11, 10 and 15 % at the respective developmental stages. Similar differences were also observed in the field experiments. gs is determined by complex traits such as stomatal density and stomatal size. Kawamitsu et al. (1987) reported a large genotypic difference in stomatal density between rice cultivars (600–1400 mm−2), but Maruyama and Tajima (1990) revealed that the genotypic difference in gs was mainly due to stomatal aperture. However, little is known about how gs as well as gw is quantitatively determined by morphological and physiological factors, and further information on their genetic variations would be needed for genetic improvement of Pn.
In conclusion, a model was constructed to explain genotypic and ontogenetic variation of Pn based on N and gs, using the experimental data from pot and field experiments. Assuming that variation of gw is proportional to that of gs, the model adequately explained the variation between genotypes, grown under different conditions. The model showed different curvilinear responses of Pn to an increase in N depending on gs, suggesting that simultaneous improvements of both N and gs are essential for an effective breeding of genotypes with higher Pn. Further, the model proposed here would contribute to construct the rice growth and yield simulation model as a basal photosynthesis sub-model.
ACKNOWLEDGEMENTS
We thank the staff of the Laboratory of Crop Science and the Graduate School of Agriculture, Kyoto University, for their advice and experimental support.
LITERATURE CITED
- Arjunan A, Natarajaratnam N, Nagarajan M, Sadasiram R, Balakrishnan K. Photosynthesis and productivity in rice cultivars. Photosynthetica. 1990;24:273–275. [Google Scholar]
- Atkin OK, Evans JR, Marilyn CB, Lambers H, Pons TL. Leaf respiration of snow gum in the light and dark, interactions between temperature and irradiance. Plant Physiology. 2000;122:915–923. doi: 10.1104/pp.122.3.915. [DOI] [PMC free article] [PubMed] [Google Scholar]
- Boote KJ, Jones JW, Hoogenboom G. Simulation of crop growth: CROPGRO model. In: Peart RM, Curry RB, editors. Agricultural systems, modeling and simulation. New York: Marcel Dekker; 1998. pp. 651–692. [Google Scholar]
- Brooks A, Farquhar GD. Effects of temperature on the CO2/O2 specificity of ribulose-1,5-bisphosphate carboxylase/oxygenase and the rate of respiration in the light. Planta. 1985;165:397–406. doi: 10.1007/BF00392238. [DOI] [PubMed] [Google Scholar]
- von Caemmerer S, Evans JR. Determination of the average partial pressure of CO2 in chloroplasts from leaves of several C3 plants. Australian Journal of Plant Physiology. 1991;18:287–305. [Google Scholar]
- von Caemmerer S, Farquhar GD. Some relationships between biochemistry and photosynthesis and the gas exchange of leaves. Planta. 1981;153:376–387. doi: 10.1007/BF00384257. [DOI] [PubMed] [Google Scholar]
- Cook MG, Evans LT. Some physiological aspects of the domestication and improvement of rice (Oryza spp.) Field Crops Research. 1983;6:205–218. [Google Scholar]
- Epron D, Godard D, Cornic G, Genty B. Limitation of net CO2 assimilation rate by internal resistances to CO2 transfer in the leaves of two tree species (Fagus sylvatica L. and Castanea sativa Mill.) Plant, Cell and Environment. 1995;18:43–51. [Google Scholar]
- Evans JR. Photosynthesis and nitrogen relationships in leaves of C3 plants. Oecologia. 1989;78:9–19. doi: 10.1007/BF00377192. [DOI] [PubMed] [Google Scholar]
- Evans JR, von Caemmemer S, Setchell BA, Hudson GS. The relationships between CO2 transfer conductance and leaf anatomy in transgenic tobacco with a reduced content of Rubisco. Australian Journal of Plant Physiology. 1994;21:475–495. [Google Scholar]
- Farquhar GD, Sharkey TD. Stomatal conductance and photosynthesis. Annual Review of Plant Physiology. 1982;33:317–345. [Google Scholar]
- Hanba YT, Kogami H, Terashima I. The effect of internal CO2 conductance on leaf carbon isotope ratio. Isotopes in Environmental and Health Studies. 2003;39:5–13. doi: 10.1080/1025601031000102233. [DOI] [PubMed] [Google Scholar]
- Hasegawa T, Horie T. Leaf nitrogen, plant age and crop dry matter production in rice. Field Crops Research. 1996;47:107–116. [Google Scholar]
- Horie T. System ecological studies on crop–weather relationships in photosynthesis, transpiration and growth. The Bulletin of the National Institute of Agricultural Sciences Series A. 1981;28:1–181. (in Japanese with English abstract) [Google Scholar]
- Horie T, Lubis I, Takai T, Ohsumi A, Kuwasaki K, Katsura K, Nii A. Physiological traits associated with high yield potential in rice. In: Mew TW, Brar DS, Peng S, Dawe D, Hardy B, editors. Rice science: innovations and impact for livelihood. Los Baños, The Philippines: IRRI; 2003. pp. 117–145. [Google Scholar]
- Kawamitsu Y, Agata W. Varietal differences in photosynthetic rate, transpiration rate and leaf conductance for leaves of rice plants. Japanese Journal of Crop Science. 1987;56:563–570. (in Japanese with English abstract) [Google Scholar]
- Kuroda E, Kumura A. Difference in single leaf photosynthesis between old and new rice varieties. I. Single-leaf photosynthesis and its dependence on stomatal conductance. Japanese Journal of Crop Science. 1990;59:283–292. (in Japanese with English abstract) [Google Scholar]
- Lauteri M, Scartazza A, Guido MC, Brugnoli E. Genetic variation in photosynthetic capacity, carbon isotope discrimination and mesophyll conductance in provenances of Castanea sativa adapted to different environments. Functional Ecology. 1997;11:675–683. [Google Scholar]
- Loreto F, Harley PC, Marco GDi, Sharkey TD. Estimation of mesophyll conductance to CO2 flux by three different methods. Plant Physiology. 1992;98:1437–1443. doi: 10.1104/pp.98.4.1437. [DOI] [PMC free article] [PubMed] [Google Scholar]
- Makino A, Mae T, Ohira K. Photosynthesis and ribulose-1,5-bisphosphate carboxylase/oxygenase in rice leaves from emergence through senescence. Quantative analysis by carboxylation/oxygenation and regeneration of ribulose 1,5-bisphosphate. Planta. 1985;166:414–420. doi: 10.1007/BF00401181. [DOI] [PubMed] [Google Scholar]
- Makino A, Mae T, Ohira K. Variations in the contents and kinetic properties of ribulose-1,5-bisphosphate carboxylases among rice species. Plant and Cell Physiology. 1987;28:799–804. [Google Scholar]
- Maruyama S, Tajima K. Leaf conductance in Japonica and Indica rice varieries. I. Size, frequency, and aperture of stomata. Japanese Journal Crop Science. 1990;59:801–808. [Google Scholar]
- Miah MNH, Yoshida T, Yamamoto Y. Effects of nitrogen application during ripening period on photosynthesis and dry matter production and its impact on yield and yield components of semidwarf indica rice varieties under water culture conditions. Soil Science and Plant Nutrition. 1997;43:205–217. [Google Scholar]
- Peng S, Cassman KG, Kropff J. Relationship between leaf photosynthesis and nitrogen content of field-grown rice in tropics. Crop Science. 1995;35:1627–1630. [Google Scholar]
- Sasaki H, Ishii R. Cultivar differences in leaf photosynthesis of rice bred in Japan. Photosynthesis Research. 1992;32:139–146. doi: 10.1007/BF00035948. [DOI] [PubMed] [Google Scholar]
- Sinclair TR, Horie T. Leaf nitrogen, photosynthesis and crop radiation use efficiency: a review. Crop Science. 1989;29:90–98. [Google Scholar]
- Takai T, Matsuura S, Nishio T, Ohsumi A, Shiraiwa T, Horie T. Rice yield potential is closely related to crop growth rate during the late reproductive period. Field Crops Research. 2006;96:328–335. [Google Scholar]
- Takano Y, Tsunoda S. Curvilinear regressions of the leaf photosynthetic rate on leaf nitrogen content among strains of Oryza species. Japanese Journal of Breeding. 1971;32:69–76. [Google Scholar]
- Yeo ME, Yeo AR, Flowers TJ. Photosynthesis and photorespiration in the genus Oryza. Journal of Experimental Botany. 1994;45:553–560. [Google Scholar]