

Abstract
We study the effects of EGFR inhibition in wild-type and mutant cell lines upon tyrosine kinase inhibitor TKI treatment through a systems level deterministic and spatially homogeneous model to help characterize the hypersensitive response of the cancer cell lines harboring constitutively active mutant kinases to inhibitor treatment. By introducing a molecularly resolved branched network systems model (the molecular resolution is introduced for EGFR reactions and interactions in order to distinguish differences in activation between wild-type and mutants), we are able to quantify differences in (1) short-term signaling in downstream ERK and Akt activation, (2) the changes in the cellular inhibition EC50 associated with receptor phosphorylation (i.e., 50% inhibition of receptor phosphorylation in the cellular context), and (3) EC50 for the inhibition of activated downstream markers ERK-(p) and Akt-(p), where (p) denotes phosphorylated, upon treatment with the inhibitors in cell lines carrying both wild-type and mutant forms of the receptor. Using the branched signaling model, we illustrate a possible mechanism for preferential Akt activation in the cell lines harboring the oncogenic mutants of EGFR implicated in non-small-cell lung cancer and the enhanced efficacy of the inhibitor erlotinib especially in ablating the cellular Akt-(p) response. Using a simple phenomenological model to describe the effect of Akt activation on cellular decisions, we discuss how this preferential Akt activation is conducive to cellular oncogene addiction and how its disruption can lead to dramatic apoptotic response and hence remarkable inhibitor efficacies. We also identify key network nodes of our branched signaling model through sensitivity analysis as those rendering the network hypersensitive to enhanced ERK-(p) and Akt-(p); intriguingly, the identified nodes have a strong correlation with species implicated in oncogenic transformations in human cancers as well as in drug resistance mechanisms identified for the inhibitors in non-small-cell lung cancer therapy.
1. Introduction
Members of the ERbB family of receptors, the epidermal growth factor receptor (EGFR/ErbB1/HER1), ErbB2 (HER2), ErbB3, and ErbB4, activate a multilayered signaling network mediating crucial pathways leading to cell proliferation and differentiation (1), in response to activation of the receptors by the epidermal growth factor (EGF), transforming growth factor-α, and several other related peptide growth factors (1). Over-expression of EGFR and ErbB2 has been correlated with a variety of clinical cancers, the latter with prognostic significance. Hence, small molecule tyrosine kinase inhibitors (TKIs) for EGFR tyrosine kinase (EGFRTK) and ErbB2 RTK, e.g., gefitinib, erlotinib, and lapatinib, which are ATP analogues, are of significant interest as cancer therapeutic drugs; gefitinib is in clinical use for non-small-cell lung cancer therapies. While the receptor tyrosine kinase (RTK) inhibition approach has shown promise in some clinical trials, results have been quite mixed. In particular, the occurrence of somatic mutations in the EGFR kinase domain (L834R, L837Q, G685S, del L723-P729 ins S; these clinical mutations in an alternative scheme are denoted by L858R, L861Q, G719S, del L747-P753 ins S) as seen in non-small-cell lung cancers (2, 3) renders the cell lines harboring such mutations more sensitive to TKI treatment. In vitro, these EGFR mutants showed enhanced tyrosine kinase activity compared to wild-type (WT) EGFR and increased sensitivity to inhibition (2), whereas the WT response has only been modest to unaffected.
The collective evidence from several experimental observations points to a constitutively active L834R and del724–729 mutant RTK systems (i.e., activated in both monomer and dimer states in the presence or absence of EGF ligand), in contrast to an exclusively dimer-mediated activation of WT RTK (i.e., activated only in the dimer state and only in the presence of the EGF ligand). Experimental observation of constitutive activation in the gefitinib-sensitive EGFR mutants has been recorded independently in several studies, which report significantly elevated basal phosphorylation (in the absence of the stimulating ligand) of the mutant systems in comparison to the WT (2, 4–7). However, the structural/molecular basis for such a constitutive activation is not completely clear. In particular, the mutations occur in distinct parts of the enzyme and it is not known whether they trigger constitutive activity via similar molecular mechanisms that are absent in the WT.
In addressing this question regarding a molecular/structural basis for differing activation mechanisms in WT and mutant EGFR, we have recently reported a structural study involving molecular dynamics (MD) simulations of the WT EGFRTK system in the active and the inactive conformations, respectively (8, 9). In this study we uncovered a network of stabilizing specific interactions (hydrogen bonds and salt-bridges) surrounding the activation loop and the αC-helix regions of the kinase that is more susceptible to destabilization (upon the formation of an EGFR dimer) in the inactive state relative to the active state. Energetically, this network of stabilizing interactions dominates the allosteric mechanism that induces the conformational switching (upon dimerization) from an inactive to an active kinase conformation. Our calculations also showed that the clinically relevant mutations del724–729, and L834R, though occurring in structurally distinct parts of the enzyme, both destabilize the network of stabilizing interactions in the inactive state, suggesting a molecular mechanism for constitutive activation that contributes to the experimentally observed enhanced activity (2, 4, 5, 10). Our delineated pattern of stabilizing interactions served as a platform for unifying the effects of these mutations on the kinase activation mechanism at a molecular level.
How such constitutive activation is precisely linked to increased sensitivity to inhibition and the efficacy of some TKIs remains an interesting question. Recently, Noro et al. (11) reported that the majority of inhibitor hypersensitive cell lines showed Akt phosphorylation without ligand stimulation while a small fraction of the resistant cell lines displayed this characteristic, on the basis of which they concluded that Akt phosphorylation without ligand stimulation may play a key signaling role in TKI hypersensitivity. Settleman et al. (12) proposed the concept of an “oncogenic shock” which attributes the hypersensitivity to inhibition in such cancer cell lines to differential attenuation rates of pro-survival (triggered by Akt phosphorylation) and pro-apoptotic signals emanating from EGFR following its inactivation upon inhibitor treatment. Their surmise, like the Noro et al. finding, is based on preferential Akt activation, and relies on the assumption that pro-survival signals such as Akt-(p) dissipate quickly upon oncoprotein inactivation, whereas pro-apoptotic signals linger sufficiently long to commit the cell to an apoptotic death. This differential effect may contribute to the rapid and dramatic clinical responses observed in some cancer patients treated with selective TKIs. Hendricks et al. (13) sought to provide a mechanistic basis for enhanced Akt signaling in gefitinib hypersensitive cell lines and suggested on the basis of experimental and computational results that the gefitinib sensitivity is a marker of a reliance on Akt signaling for cell survival that may be brought about by impaired EGFR internalization in the inhibitor-sensitive cell lines.
Here we describe another possible mechanism that leads to preferential Akt sinaling. Specifically, by introducing a molecularly resolved branched network systems model (the molecular resolution is introduced through a hierarchical multiscale computational strategy to transcribe the effects of molecular alterations in the receptor, e.g., mutant forms of the receptor, to differing downstream short-term signaling responses (14)), to study the effects of EGFR signaling and inhibition in WT and mutant cell lines, we are able to quantify (1) differences in short-term signaling in downstream ERK and Akt activation, (2) the changes in the cellular inhibition EC50 associated with receptor phosphorylation (i.e., 50% inhibition of receptor phosphorylation in the cellular context), and (3) EC50 for the inhibition of activated downstream markers ERK-(p) and Akt-(p), where (p) denotes phosphorylated, upon treatment with the TKI erlotinib in cell lines carrying both WT and mutant forms of the receptor. This model also suggests a possible mechanism for preferential Akt activation in the oncogenic mutants of EGFR implicated in non-small-cell lung cancer as well as an enhanced efficacy of the inhibitor erlotinib in ablating the Akt response. Using a simple phenomenological model to describe the effect of Akt activation on cellular decisions, we discuss how this preferential Akt activation is conducive to cellular oncogene addiction and how its disruption can lead to the observed hypersensitivity of the inhibitors. We also illustrate that key network nodes of our model, which were identified through our sensitivity analysis as those rendering the network hypersensitive to enhanced ERK-(p) and Akt-(p) levels, have a striking correlation with species implicated in oncogenic transformations in human cancers as well as identified in drug resistance mechanisms for the inhibitors gefitinib and erlotinib in non-small-cell lung cancer therapy.
2. Methods
2.1. Deterministic Systems Models for Wildtype (WT) and Mutant EGFR Signaling
Deterministic, ODE-based systems models were constructed as described previously (9). EGF stimulation in a cell results in the simultaneous activation of multiple pathways that are functionally interlinked (15–17). The major pathways we included in our model are (see schematic in Figure 1): (1) EGF-ERK pathway (18) via the Ras-Raf-MAP-kinase cascade (19–25) in which the activation of Ras initiates a multistep phosphorylation cascade that leads to the activation of MAPKs, ERK1, and ERK2. ERK1 and ERK2 regulate transcription of molecules that are linked to cell proliferation, survival, and transformation. (2) The PI3K-Akt pathway, which results in the activation of the downstream protein-serine/threonine kinase Akt. Prior studies have established that some growth factor-stimulated EGFRTK interact through Gab-1 adapter protein with phosphatidylinositol 3′-kinase (PI3K) (26–29) leading to Akt activation. Akt transduces signals that trigger a cascade of responses from cell growth and proliferation to survival and motility (18, 30–32) and has inhibitory effects on Raf-1 and the subsequent ERK activation and on several pro-apoptotic pathways (see Figure 9). The pathways we do not include in our model are phosphoinositol metabolism and signaling (33–37), activation and nuclear translocation of STATs (16, 38–41), clathrin-mediated endocytosis (42–44), and molecular cross-talk with other receptor systems (e.g., GPCR, integrins) (45–51).
Figure 1.
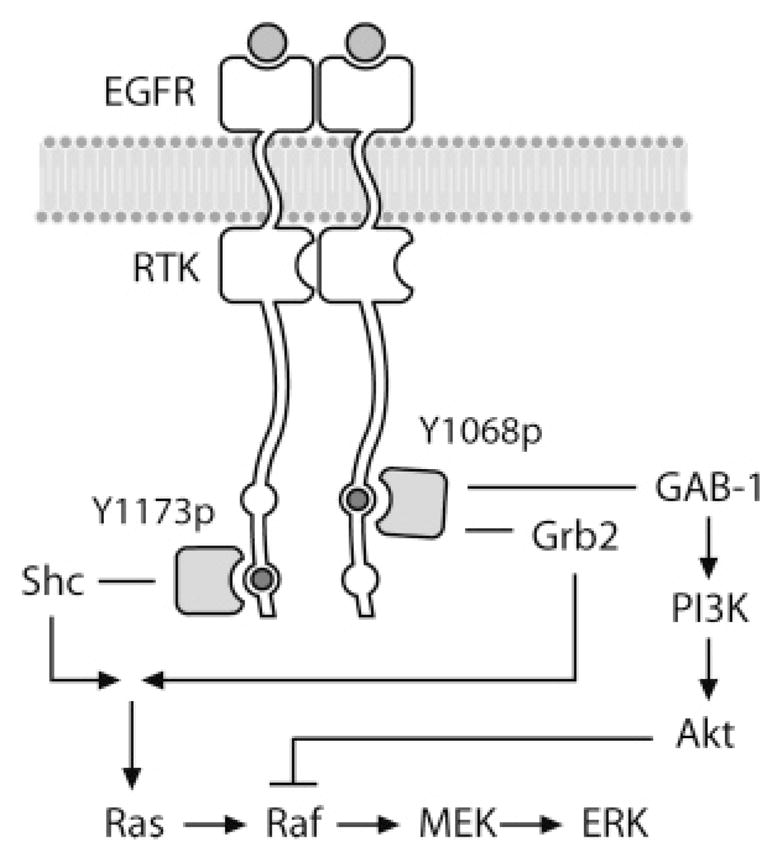
Branched signaling model of EGFR used in this study. Phosphorylation of the EGFR dimer occurs at either Y1068, which can bind GAB-1 or Grb2, or at Y1173, which binds Shc. Activation of downstream proteins Akt and ERK were used as indicators of preferential signaling.
Figure 9.

Phenomenological model to link preferential Akt activation to cellular decisions S versus D.
In the kinetic model employed here, signaling through the EGFR is modeled by combining three published models and augmented by our own set of reactions and calculations. Phosphorylation and docking reactions are modeled according to ref 21; the MAP kinase pathway reactions are modeled after ref 25; Akt and PI3K activation were incorporated into the model as described in ref 27. The similar parametrization and topology in these models allowed us to construct a consistent, stable, and comprehensive system with results in good agreement with published experimental data (52). Together, these represent a branched (see below) short-term signaling model of EGFR and connection to the downstream signaling components, ERK and Akt. To model competitive inhibition by an ATP analog, we employed the following reaction in our model: EGFR2 + 2 Inhibitor ↔ EGFR2·Inhibitor2. This choice reflects the fact that the kinase domain is active only as a dimer and the inhibitor (erlotinib) only binds to the active kinase domain.
2.2. Branched Signaling Model
Recently, the interaction profiles of the C-terminal phosphotyrosines of the ErbB family kinases with their cytosolic signaling substrates were summarized by Schulze et al. (53) (see Figure 2). The EGFR has multiple interaction partners and several binding sites for Grb2. ErbB2 has few interaction partners; of them Shc is the most common. ErbB3 interacts mainly with the PI3 kinase subunit p85, and ErbB4 shows a diversity of interaction partners, also with several binding sites for Grb2. In particular, the preferential binding characteristics of these different cytosolic substrates to different phosphotyrosine locations were also described. For EGFR phosphotyrosine sites, the (qualitative) specificities associated with these preferences are also consistent with earlier reports (2, 17) (see Figure 2). To reflect these preferential binding characteristics, we modeled the signaling through the EGFR through two parallel phosphorylation pathways, corresponding to tyrosine 1068 (Y1068) and tyrosine 1173 (Y1173). In this model, phosphorylated Y1068 (pY1068) binds only to Gab-1 and Grb2; phosphorylated Y1173 (pY1173) binds only to Shc. That is, the differential signaling is modeled by allowing only a subset of cytosolic substrate proteins to bind to each form of the phosphorylated receptor by partitioning these signaling proteins into two groups: Grb2 and Gab-1 binding only to pY1068, and Shc binding only to pY1173. Thus, our systems model introduces the concept of differential signaling, where phosphorylation events at the Y1068 and Y1173 sites transduce signals through different pathways. The remainder of the downstream phosphorylation cascades were left intact, as discussed in section 2.1 (see Figure 1).
Figure 2.
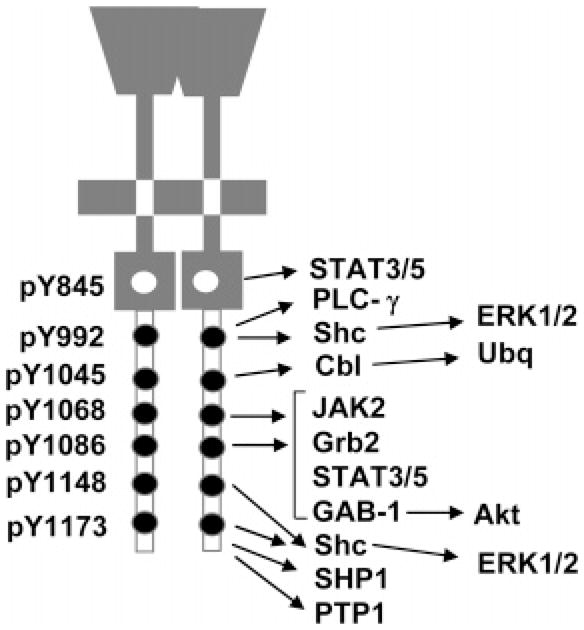
Signaling through pYs. Preferential docking of cytosolic substrates to phosphotyrosines of EGFR.
Differential Signaling through Y1068 and Y1173
Our molecular resolution to the systems model is enabled by the availability of key binding and rate constants associated with the identity-specific phosphor-tyrosine kinetics from the work of Mulloy et al. (54) (see Table 1). However, it is reasonable to assume that the specificities associated with differential recruitment of the cytosolic substrates to the phosphotyrosine sites are not perfect. We initially implemented this differential signaling effect by assuming perfect (or 100/0) specificities for the interactions of the Y-phosphorylated docking sites, i.e., the pY1068 binds only to Gab-1 and Grb2 and not Shc, and pY1173 binds only to Shc and not to Gab-1 and Grb2. We also considered other possibilities by continuously changing the ratio from 50/50 (this case represents no specificity, i.e., the two sites 1068 and 1173, when phosphorylated, serve as equivalent docking sites to all substrates in our model, namely, Gab-1, Grb2, and Shc and is effectively a single-site model, where the docking sites are not distinguished) to a specificity of 100/0. A realistic model for incorporating this differential effect lies in between these two limits. Therefore, in order to gauge the sensitivity of the downstream response ERK-(p) versus Akt-(p) activation on the degree of the specificity, we performed network simulations with varying specificities: 100/0 to 50/50 (see Figure 4).
Table 1.
Parametric Differences between WT and Mutant EGFR Systems Inferred from Experiments
Figure 4.

Effect of peptide specificity on activated ERK and Akt levels. The WT (A and B) and mutant (C and D) systems were simulated for 15 min under the conditions indicated. Accumulated (time-integrated) ERK-(p) (A and C) and Akt-(p) (B and D) levels were calculated as a function of peptide specificity; 0.5 denotes 50/50 or no specificity (peptide binds equally to either tyrosine); 1.0 denotes 100/0 or perfect specificity (peptide binds only to its cognate tyrosine as described in the text).
Altogether, our model comprised 74 reactions and 67 species. Seventeen of these reactions are novel to this work; they represent enhanced molecular resolution in the EGFR activation, phosphorylation, and docking reactions and enable separate parametrization for EGFR wild-type and mutant systems. System models for EGFR WT and mutant (L834R and del L723-P729 ins S) systems were assembled using the Systems Biology Markup Language (http://sbml.org). A complete model SBML file is available via email request to the corresponding author. Simulations were carried out using the CVODE solver from Sundials (http://www.llnl.gov/CASC/sundials) and the SBToolbox for MATLAB (http://www.sbtoolbox.org/); see results in Figures 5–7.
Figure 5.

Two-dimensional parameter scan of signal propagation through EGFR by varying the KM values for Y1068 (vertical axis) and Y1173 (horizontal axis) peptide binding. Erk (top panels) and Akt (bottom panels) responses were calculated for each of the conditions shown by simulating the model for 15 min with complete (100/0) specificity. The scale in each panel was normalized separately to maximize the gradient within each set of simulations. Colorbars indicate the peak concentrations (nM) of ERK-(p) or Akt-(p). Signaling by the constitutively active L834R and del mutants, both with and without EGF present, are represented in the panels with EGF stimulation.
Figure 7.

Inhibition of ERK and Akt activation in WT and L834R systems. Activation responses are plotted for a range of inhibitor concentrations relative to the same system without inhibitor. Peak ERK-p and Akt-p levels are shown after 15 min simulation with 50 ng/mL EGF. When not visible, open symbols are plotted beneath closed symbols.
2.3. Signaling Network for the L834R and del L723-P729 ins S (or del) Mutants
One important difference between the WT and the mutant networks is that the WT RTK initiates phosphorylation of C-terminal tail substrate tyrosines only as a dimer, whereas the mutants, owing to constitutive activation, can initiate phosphorylation as a monomer as well as a dimer (9, 55). To reflect this constitutive activation, we have added the following reactions for the mutant systems:
| (1) |
| (2) |
| (3) |
| (4) |
| (5) |
| (6) |
Equations 1 and 2 represent the monomeric mutant receptor binding ATP and inhibitor, respectively. Equations 3 and 4 represent different phosphorylation sites on the receptor cytoplasmic tail entering into proximity for phosphorylation. Equations 5 and 6 are irreversible phosphorylation reactions for tyrosine 1068 and 1173, respectively. For each reaction listed above, there is a corresponding reaction involving the activated form of the monomeric substrate (denoted EGFRa in the model specification). The availability of experimental data for WT and mutants with regard to inhibitor binding and identity-specific phosphotyrosine kinetics (see Table 1) made such an extension possible. Consistent with our computational studies (our molecular docking studies in ref 9 revealed that the ATP binding affinity of the RTK in the inactive state is 100-fold lower than that in the active state), the above reactions are implemented as multiple analogous reactions, such that an inhibitor molecule may bind to the activated receptor kinase only when the substrate tyrosines are unphosphorylated or already phosphorylated at either Y1068 or Y1173. To model the kinetic behavior in the presence of the TKI erlotinib, we used appropriate values for the inhibition constant (KI) of erlotinib, binding constant for ATP, and constants for describing the phosphorylation kinetics of Y1068 and Y1173 peptides for WT and mutant receptors, (see Table 1).
2.4. Parameter Estimation and Model Calibration
Ligand Binding and Dimerization
EGF binding to receptor was modeled as described by Kholodenko (21). Dimerization of activated monomers was also modeled according to this scheme, although two additional dimerization reactions were added to represent spontaneous association of unactivated monomers and activated–unactivated dimer pairs. For these two interactions, an off-rate of 1000 s−1 was used, which is 10,000-fold faster than the specific interaction between activated monomers. Thus, this baseline dimerization is essentially diffusion-controlled and accounts for basal-level receptor phosphorylation in the absence of ligand.
Receptor Phosphorylation
In our model, the phosphorylation of the receptor occurs in three steps: (1) ATP binds reversibly to the active site of EGFR. The wild-type KM = 5 μM reported in ref 56 is used for this reaction. (2) An unphosphorylated tyrosine site on the cytoplasmic tail diffuses and binds transiently to the active site. The forward rate (on-rate or kon) is diffusion-limited; see below. The reverse rate for these reactions was estimated by setting koff = (kon) e+ΔG/kT, where ΔG was calculated from the experimentally measured binding affinity KM for each peptide sequence surrounding the particular C-terminal tyrosine residue. (3) In the third step, a phosphate group from ATP is transferred to either Y1068 or Y1173. These parameters for the WT and the two mutants are summarized in Table 1. By undergoing two rounds of phosphorylation, a single receptor may be phosphorylated at both sites.
Intramolecular Diffusional and C-terminal Tail Tyrosine Auto/Trans-phosphorylation
Auto- as well as trans-phosphorylation of specific tyrosine sites in the C-terminal tail of the receptor involves diffusion of the particular tyrosine residue in the C-terminal tail to the active site of the EGFRTK. On the basis of the crystal structure of Stamos (60) and the dimer interface identified by Kuriyan (55), we specify the unstructured region of the C-terminal tail as constituted by residue 960 onward. The seven tyrosine residues present on each tail will then have a characteristic time of diffusion to the active site. We modeled the tail from residue 960 to the particular tyrosine residue of interest as a freely joined chain (FJC) consisting of Kuhn segments (61); a persistence length of 3.04 Å is used following the results of Zhou (62). According to the FJC model, the spatial distribution of one end of the FJC with coordinates x,y,z (where the tyrosine residue is located) with the other end (residue 960) fixed at origin was described by a Gaussian distribution at thermal equilibrium: P(x,y,z) = [3/(2πNKb2)]3/2 × exp[−3(x2 + y2 + z2)/(2NK b2)], where P(x,y,z) is the probability of finding the tyrosine residue at coordinates (x,y,z), NK is the number of Kuhn segments between the fixed end and the tyrosine residue, and b is the Kuhn length (twice the persistence length) of the protein (~6.08 Å). Using transition state theory, the rate of tyrosine binding to the active-site (kon) was calculated as kon = (D/a2) × P(x*,y*,z*), where D/a2 is the characteristic relaxation frequency of the tyrosine residue, D = (kBT)/(6πNμa), the diffusion coefficient of the C-terminal tail given by the reptation model (61), kB is the Boltzmann constant, T is the temperature (300 K), N is the number of residues in the C-terminal tail, μ is the viscosity (8.9 × 10⁻⁴ Ns/m2), a is the hydrodynamic radius of a single amino acid residue (1.9 Å), and (x*,y*,z*) represents the Cartesian coordinates of the active-site in the 3-dimensional structural model of the receptor tyrosine kinase. This procedure was repeated for all tyrosine residues on the C-terminal tails of both the head and the tail monomer RTK of the asymmetric RTK dimer; see ref 9. The timescales for diffusion were found to be in the microsecond range and not very different for the different tyrosine sites to bind to the active site prior to auto- (head) or trans- (tail) phosphorylation (9). For each case, the reciprocal of the corresponding time scale was taken as the on-rate (kon) of the tyrosine binding to the active site. The off-rate was calculated as koff = kon × exp(+ΔG/kBT) = kon/KM, where KM is provided in Table 1.
2.5. Parameter Optimization and Systems Model Calibration using a Genetic Algorithm
Model parameters were further refined by calibrating simulation output with data from published cell-based assays and time-resolved mass spectrometry (63). A genetic algorithm (GA) (64) was used to identify parameter sets that produced the closest fits to experimental measurements, using a linear least-squares distance measure between computed and measured time course data points as the objective function. Initial estimates of parameters (default values) were taken from published studies or computed by the above-mentioned protocols (14). In the GA, each parameter value was sampled from a log-normal distribution (μ = default value, σ = 1 log unit) to allow the parameters (rate constants or initial conditions, except those for [EGFR], [EGF], and [TKI]) to range continuously over several orders of magnitude but with strong central tendency for the default value. The GA was implemented with a constant-sized population of 100 parameter sets, mutation rate μ = 0.15, and crossover rate ρ = 0.15, for 1000 generations. Fitness scores for all individuals were evaluated at each generation by computing the objective function, i.e., sum of squares penalty function between model and experimental time-course data (see Figure 3), and the parameter sets with 10 best fitness-scores in 1000 generations were selected. An example time course trace from a high-scoring parameter set is shown in Figure 3, which depicts a typical time-course resulting from our network simulations (left) in comparison to experiment (right) for the kinetics of EGFR phosphorylation and those of downstream markers.
Figure 3.

(left) Example of time-course trace from a high-scoring parameter set. (right) Experimental time-course data used to calibrate the system parameters.
3. Results
3.1. Quantifying Differences in Short-Term Signaling in EGFR WT and Mutant Cell Lines
Differential Phosphorylation
On the basis of the different parameter values for WT, L834R, and del mutant systems, we first assessed the differential phosphorylation patterns of EGFR at Y1068 and Y1173 systems in our systems model, as a function of EGF stimulation and EGFR copy number. The parameters explored were as follows: normal receptor copy number (initial [EGFR] = 100 nM or 30,000 receptors per cell), and overexpressed EGFR copy number (initial [EGFR] = 1000 nM or 300,000 receptors per cell), no EGF stimulation and 8 nM (50 ng/mL) EGF stimulation. As expected from the altered KM and kcat values (Table 1), L834R had a stronger preference for Y1068 as well as Y1173 phosphorylation compared to the WT receptor, while the del mutant showed increased Y1068 and decreased Y1173 phosphorylation. These trends for identity-specific receptor tyrosine phosphorylation are consistent with the experiments of Mulloy et al. (54), Sordella et al. (2), and Chen et al. (4), thereby validating the calibration of our systems model for WT and mutants at the level for the receptor activity.
Differential Signaling
To examine the effects of signaling through pY1068 and pY1173 on the downstream response, we explored a series of cases with varying specificities (100/0 to 50/50; see section 2.2). Simulations were performed for WT and mutants for a time of 0–15 min (0–900 s) under different initial ([EGF] and [EGFR]) conditions and the resulting total ERK-(p) and Akt-(p) responses were calculated (Figure 4). For the WT, increased specificity lowered the downstream activation of ERK, except when no EGF was present under normal receptor expression (Figure 4A). Results were similar for WT Akt activation, which experienced a similar decline as specificity was increased (Figure 4B). Results were reversed for the mutant. That is, both activated ERK and Akt levels increased with increasing peptide specificity (Figures 4C,D). In both cases, the addition of 100 nM EGF had no effect on either downstream protein activation owing to the constitutive activation of the mutant receptors. Thus, the specific binding pattern for phosphotyrosines has the effect of lowering the activation of downstream proteins in the WT, while increasing the same in the mutant. Nevertheless, the absolute differences in ERK-(p) and Akt-(p) levels between WT and L834R (top vs bottom panels) were greater than the differences caused by varying specificities for each system. These observations collectively suggested that the differences in the downstream signaling between the WT and mutant receptors stem from changes in the efficiency of C-terminal tail phosphorylation (i.e., kcat/KM values for the substrate tyrosines) rather than the specificities of the docking proteins to phosphotyrosines. Therefore, the rest of our systems simulations were carried out with full (100/0) specificity, wherein we have calculated transient evolution of the EGF-mediated signaling under a variety of initial conditions and parameter values (Figure 5).
Since our molecularly resolved systems model is currently focused on differential signaling through Y1068 and Y1173 phosphorylation sites of EGFRTK, we track the response of ERK-(p) and Akt-(p) (phosphorylation levels) in our simulations in response to changes in the phosphotyrosine kinetics of Y1068 and Y1173 in order to gauge the sensitivity of these receptor associated kinetic parameters on downstream activation. Specifically, we perform a 2-dimensional scan over KM values associated with Y1068 and Y1173 phosphorylation in which the respective KM values are allowed to deviate from their default (WT) value over a logarithmic range of 5 log units. The result is a 2-dimensional matrix in which each element represents output, ERK-(p) and Akt-(p), from a single simulation involving a unique pair of parameters (see Figure 5); here each output state is quantified according to the peak level of phosphorylation over the simulated time of 900 s. Time-integrated phosphorylation levels gave qualitatively similar pattern of results (data not shown).
The results in Figure 5 illustrate how the alteration of affinities at the receptor level from the wild-type to mutant values translates into changes in the downstream response: the affinities for the WT are highlighted by the filled cyan circles at the origin of each of the panels. The affinities of the L834R and del mutants correspond to the filled green circle and filled yellow circle, respectively, which are located by calculating from Table 1 the log[(KM)mutant/(KM)WT] values for Y1073 and Y1068. Owing to the constitutively active characteristic of the L834R and del mutants, the signals relevant for the mutant systems (even in the absence of EGF) are analogous to those in the panels with EGF stimulation.
In the panels in Figure 5, a decrease in KM value translates into an increase in catalytic turn-over, i.e., kcat/KM. Therefore, moving along the diagonal with slope = 1, i.e., from regions (−2,−2) to (+2,+2), in (KM,Y1068,KM,Y1173) sub-space causes no variations in ERK and Akt activation characteristics as this direction does not preferentially choose between the pY1068 and pY1173 signaling routes depicted in Figure 1. However, moving along the other diagonal (i.e., with slope = −1) reveals several interesting attributes of differential or branched signaling. Under normal EGFR expression, the region (−2,+2) shows increased Akt as well as ERK activation. The former is an obvious consequence of increase Gab-1 recruitment to pY1068. The latter is a surprising result and can be rationalized by recognizing that while the Shc recruitment via pY1173 goes down, the Grb2 association with pY1068 increases, and the increase in ERK activation is perhaps a consequence of signal being limiting by Grb2 under these conditions. Under EGFR overexpression, this region shows similar ERK as well as Akt activation patterns relative to the origin due to signal saturation, (note that ERK responses are predominantly blue and Akt response, while showing a color gradation, the color bar illustrates a very narrow range); i.e., neither the production of pY1068/pY1173, nor the recruitment of cytosolic substrates Gab-1/Grb-2/Shc limit signaling. In the region (+2,−2), under normal EGFR expression, both ERK and Akt activation are down relative to the origin as a consequence of decrease production of pY1068 consequently affecting both Gab-1 as well as Grb2 recruitment. In this region, under EGFR overexpression, the Akt activation remains the same relative to origin due to signal saturation, while the ERK response is enhanced presumably because of enhanced Shc recruitment.
As indicated by the color maps in these scans, the effect of altered affinities of the Y1068 and Y1173 sites to the catalytic domain of the EGFR is that the L834R under normal EGFR expression exhibits differential downstream response, i.e., a pronounced decreased in ERK activation (~5-fold) and relatively much smaller decrease Akt activation (~15% decrease). As per these scans, the del mutant, however, shows sustained ERK as well as Akt activation relative to WT. For EGFR overexpressed cells, both ERK and Akt activation characteristics show relative insensitivity to parameter changes as a result of signal saturation. In addition to the trends reflected in Figure 5, the signaling in mutants differ from the wild-type due to two other factors: (1) mutants can continue to signal even in the absence of the growth factor, and (2) mutant signaling can be different due to changes in the ATP affinity. However, both these factors do not introduce any differential characteristics (in terms of preferring Y1068 to Y1173) and impact the overall activation levels of ERK and Akt uniformly. In particular, the second factor associated with ATP binding significantly impacts the deletion mutant as its ATP binding affinity is 10-fold lower than both wild-type and L834R.
Our calculated responses for ERK short-term signaling for normal EGFR expression agree with the qualitative experimental observations of Sordella et al. (2) and Tracy et al. (65), who have also reported decrease in the Erk stimulation levels for the L834R mutant. With respect to Akt levels, while our model predicts a small decrease, these levels appear to be sustained in the experiments for the L834R mutant cells relative to WT. In the case of the del mutant, the experiments find that lowering of Erk activation is not observed (this is consistent with our predictions), while the Akt activation is enhanced (we predict a slight increase of the Akt-(p) levels). Thus, the preferential activation of Akt in L834R and del mutant cell lines in the experiments is consistent with the systems level predictions from our simulations. This suggests that differential signaling could be one of the factors leading to enhanced Akt activation in non-small-cell lung cancer cell lines. Other effects such as differences in receptor internalization are also likely to be important (see section 4). In light of the overall consistency between simulations and experiment, we explore the origins of inhibitor sensitivity in the mutant cell lines using our model.
3.2. Inhibition Characteristics in the Cellular Context
EC50 for Inhibition of EGFR Phosphorylation in the Cell
We have examined the sensitivity of WT and mutant systems to inhibition in the cellular context by calculating receptor phosphorylation over a range of concentrations of the EGFR inhibitor, erlotinib. Simulations were performed for both normal ([EGFR] = 100 nM) and overexpressed ([EGFR] = 1000 nM) receptor numbers with (50 ng/mL or 8 nM) or without ligand (EGF) stimulation (see Figure 6). The EC50 is the inhibitor concentration at which 50% of the phosphorylation activity is suppressed in the cellular context; this is different from IC50 because the nonlinear and temporal effects due to signal-transduction, upstream of the competitive inhibitor binding. The EC50 for L834R was found to be 50-fold lower than that of the WT (100 vs 5000 nM) in the presence as well as absence of ligand (Figure 6a,b). There were also no prominent differences between the inhibition of phosphorylation at Y1068 and Y1173 sites. In overexpressed systems, there was no significant difference in EC50 among the four groups (Figure 6c,d); all had an EC50 values near 1000 nM.
Figure 6.

Relative inhibition of receptor phosphorylation. Tyr phosphorylation levels over a range of inhibitor concentrations are shown relative to the same system without inhibitor. Open symbols that are not visible are plotted beneath closed symbols. Simulations were performed with 50 ng/mL EGF for 15 min.
Inhibition of Downstream Activation (EC50)
We also examined the sensitivity of downstream signaling molecules ERK-(p) and Akt-(p) to inhibition for a range of erlotinib concentrations (see Figure 7a–d). In normal expression systems (Figure 7a,b), there was a nearly 7-fold decrease in EC50 for ERK-(p) inhibition for L834R (EC50 = 100 nM) compared to WT (EC50 = 700 nM) with and without ligand present. With respect to Akt activation, there was a 4-fold decrease in EC50 for L834R compared to WT (300 nM vs 1200 nM) with and without ligand present. For the case of overexpressed receptors (Figure 7c,d), inhibition of ERK-(p) is 4-fold more efficient for L834R compared to WT, while Akt-(p) inhibition is almost 10-fold more efficient for the L834R mutant, although significantly more erlotinib is required to achieve inhibition (EC50 = 40 μM). This result is consistent with the dramatically elevated Akt levels expected in systems that bear both the L834R mutation and a higher receptor count. These results are consistent with several experimental results that have reported the effect of gefitinib treatment on normal and non-small-cell lung cancer cells (2, 6, 54, 65). This agreement not only validates our prediction of downstream activation, but also provides a mechanistic basis for the inhibitor efficacy in mutant cell lines. In summary, we find that the mutant cell line L834R is more susceptible to inhibition by TKIs through curbing downstream (ERK and Akt) activation. Considering that the absolute pAkt levels are 5-fold higher than those for pERK in the WT and 20-fold higher in the mutant (Figure 2), the effect of the drug in non-small-cell lung cancer cell lines carrying the mutation can be attributed to the gain in efficacy especially with respect to Akt inhibition (see Discussion and Appendix for details).
3.3. Model Sensitivity Analysis
In order to obtain a quantitative measure of the global sensitivity and robustness of the signaling-network to rate-constants and initial concentrations, we employed a Monte Carlo protocol to perturb the default parameter sets. This was done by generating a random vector of elements ζi from a normal distribution with mean zero and variance (σ) 0.3, 1.0, and 3.0, then perturbing the default parameters Pi as Pi × exp(ζi). Network simulations were repeated 5000 times with new (perturbed) parameter-sets and the sets yielding top 250 values for ERK and Akt activation were stored. A principal component analysis in parameter-space (over the 250 stored sets) was carried out in order to determine the combinations of parameters (i.e., the constitution of the principal eigenvectors), whose perturbation are likely to render the signaling hyperactive to ERK and Akt phosphorylation, that is, phosphorylation of ERK/Akt in the perturbed system is greater that in the unperturbed system. These calculations were performed in two contexts: (1) by choosing the set of rate-constants as the parameters Pi, and (2) by choosing the set of initial concentrations as the parameters Pi. We perturbed the network using our Monte Carlo strategy and performed principal component analysis in the space of rate-constants as well as on initial concentrations. In both cases, the top three modes constituted 99% of the scatter in the parameter space. We then identified the components of the principal eigenvectors, (i.e., particular combination parameters which render the network hypersensitive according to our measure). The results are reported in Figure 8 and Table 2. The identified components were insensitive to the degree of perturbation (i.e., the same components resulted irrespective of the extent of perturbation, σ of 0.3, 1.0, and 3.0.
Figure 8.

Top four principal eigenvectors resulting from sensitivity analysis.
Table 2.
Parameter Variations Constituting the Top Three Principal Components for Network Hypersensitivity of the Model Depicted in Figure 1
| rate constantsa | initial concentrationsb |
|---|---|
| kf: Y1068 | [Raf·Ras·GTP] |
| kf: Y1173 | [Pase3] phosphatase for ERK-(p) |
| Ki: inhibitor | [Pase4] phosphatase for Akt-(p) |
| KM: ATP·RTK | [MEK-(p)] |
| KM: GAB-1·pEGFR | [PI3K inactive] |
| [MEK·Raf active] | |
| [EGFR·Shc·Grb2·SOS·RasGTP] | |
| [inhibitor] |
kf, turnover for phosphorylation.
Center dot (·) denotes bound complex.
4. Discussion and Conclusion
We have presented a branched signaling model for EGFR resolved on a molecular basis in order to interpret the effects of short-time signaling and inhibition by tyrosine kinase inhibitors on the downstream responses of ERK and Akt activation. In this model, the specificities of cytosolic docking proteins to the particular identity of the phosphotyrosine sites in the C-terminal tail of the receptor are considered with reference to ERK and Akt pathways transduced by EGFR. To this effect we introduced signal branching in the topology of EGF-ERK and EGF-Akt signaling cascades by resolving the Y1068 and Y1173 sites on the EGFR. That is, phosphorylated Y1068 binds only to Gab-1 and Grb2 and not Shc, and phosphorylated Y1173 binds only to Shc and not to Gab-1 and Grb2 (see Figure 1). We were then able to re-parametrize the model based on the identity-specific phosphotyrosine kinetics of Y1068 and Y1173 for cell lines carrying wild-type (WT) as well as mutant (L834R and del L723-P729 ins S) EGFR reported in the literature (see Table 1). Subsequently, we were able to extend this model for RTK inhibition upon treatment with small molecule inhibitor erlotinib in WT and mutants, again based on experimentally available inhibitor and ATP affinity data (see Table 1).
An important mechanism not considered in our model is the effect of receptor internalization following ligand binding, which has also been implicated as a contributor to oncogenic phenotypes (66). While we do not discount the role of ligand-induced internalization, we have focused our model around the immediate phosphorylation events following EGF stimulation in order to draw out the importance of differential signaling through multiple tyrosine-peptide binding reactions. As a comparison, phosphorylation of Y1068 reaches peak level within 10 s of addition of 50 ng/mL EGF in our model, whereas the calculated time scale for internalization of WT EGFR in human mammary epithelial cell lines under the same conditions has been reported as 3–4 min (13) and ~7 min for WT EGFT in A549 cell lines, whereas that for the L834R mutant in a non-small-cell lung cancer cell line is believed to be much larger (~25 min) (13). The internalization rate of the del mutant is not available from experimental studies. Once the context-specific internalization rates are firmly established experimentally for the mutants, the incorporation of detailed receptor phosphorylation and internalization events in a single model may provide a more complete depiction of signaling through the ErbB family of receptors.
Subject to the above limitation, based on the results presented here, we predict that the effect of altered affinities of the Y1068 and Y1173 sites to the catalytic domain of the EGFR in the WT and mutant is compounded by the preferential docking of cytosolic substrates (Figure 1) and consequently the L834R under normal EGFR expression exhibits differential downstream response, i.e., decreased ERK activation but relatively sustained Akt activation in comparison to WT cell lines. In contrast, the del mutant shows sustained ERK as well as Akt activation relative to WT. These calculated responses for ERK and Akt are generally consistent with experimental observations of Sordella et al. (2) and Tracy et al. (65), namely, that the Erk stimulation levels decrease and the Akt levels are sustained for the L834R mutant cells relative to WT and in the case of the del mutant, the lowering of Erk activation is not observed while the Akt activation is enhanced. The general agreement suggests that branched signaling could represent one factor leading to preferential downstream activation in the cell lines we have focused our model on. Additional experiments will be necessary to confirm the computational predictions presented in this work. One possible approach would be to mutate the residues neighboring the Y1068 and Y1173 binding sites, which we would expect to alter the Km and kcat values for substrate binding and lead to altered signaling for both WT and mutant receptors. Combining this approach with a time-resolved approach to monitor Akt and Erk phosphorylation kinetics will provide concrete avenues to test if branching due to differences in substrate specificities is indeed a possible mechanism of inducing differences in downstream activation. This approach can be further validated by modeling at multiple timescales dealing with the effect of mutations on substrate binding as we have illustrated elsewhere (9, 67).
We have also described how our model framework can be utilized to predict the efficacy of inhibition in cell lines harboring WT and mutant forms of the receptor. At the level of curbing receptor phosphorylation, the L834R mutant shows a 50-fold decrease in EC50 over the wild-type even though the Ki itself is only lower by 3-fold. There was no difference between the inhibition of phosphorylation at the Y1068 and Y1173 sites. We find that the inhibitor is more efficacious in inhibiting the ERK-(p) response in both WT and L834R in comparison to Akt-(p) and the inhibition of ERK-(p) and Akt-(p) in the mutant is more efficient than in the wild-type. Considering that the absolute Akt-(p) levels are 5-fold higher than those for ERK-(p) in the WT and 20-fold higher in the mutant (Figure 5), the inhibitory effect of erlotinib in the L834R mutant cell lines can be attributed to the gain in efficacy over the WT with respect to Akt inhibition. In an oncogene addicted cell line (68, 69), such a gain in efficacy over Akt inhibition has the potential (see Appendix for illustration through a simplified model) to shift the cellular homeostasis of the cell from a state dominated by pro-survival signals to one dominated by pro-apoptotic signals, thereby providing grounds for inhibitor hypersensitivity.
Correlation between Calculated Network Hypersensitivity and Observed Mechanisms of Drug Resistance
While oncogene addiction presents an Achilles heel for targeting cancer cells, owing to the dependence on one preferential pathway, the onset of drug resistance is also a natural consequence of therapies targeting the addicted pathways. We hypothesize that efficient drug resistance mechanisms attack points of network fragility in the oncogene addicted pathways. Since preferential Akt activation is a hallmark of the hypersensitive mutants and the efficacy of the inhibitors, we sought to determine the combinations of model parameter perturbations that drive enhanced Akt and ERK signaling. Table 2 reports the components (rate constants and initial concentrations) of the top 3 principal eigenvectors (from Figure 4) derived for the parameter variations that produced enhanced Akt and ERK signaling.
There is a striking correlation between the constituents of Table 2 and patterns of oncogenic mutations and mechanisms of drug resistance found in clinical studies. High frequency of mutations of PI3K, Ras, Gab-1, MEK, Raf have all been observed in several human cancers (70–74). Moreover, it has been established in screened breast and colorectal cancer patients that the GAB-1, MEK, and Ras mutations are nonrandom and likely arise from selective evolutionary pressures that give the cancer cells a survival advantage (74). With reference to the hypersensitive EGFR mutants found in non-small-cell lung cancer patients, the perturbation of the phosphotyrosine kinetics of Y1068 and Y1173 through mutations (L834R and del) is directly responsible for the differential signaling leading to preferential Akt activation, as we have shown here. Other constituent members of Table 2 also have direct relevance to hypersensitive signaling and drug resistance in the L834R and del mutant cell lines The inhibitor concentration is the most obvious and is depleted in the cells via multi-drug resistance mechanisms involving drug efflux pumps (75, 76). The restoration of signaling via reduction of KI of the inhibitor and the simultaneous enhancement of KM associated with ATP binding has also been reported through a double mutation of L834R/T766M (77, 78). This double mutant increases receptor phosphorylation (Y1068 and Y1173) kinetics 100-fold (54) while simultaneously decreasing inhibitor affinity (78). Another drug resistance mechanism related to Y1068 kinetics (i.e., by circumventing Y1068 involvement and restoring downstream signaling through an alternative branch) has been identified: in the presence of ErbB3 (or Her3), a branch of signaling analogous to that through Y1068 becomes available through Her1-Her3 heterodimerization directly resulting in PI3K recruitment on ErbB3 and subsequent Akt activation. Indeed phosphorylation of Her3 by Met receptor kinase due to overexpression of Met leads to drug (inhibitor) resistance to gefitinib/erlotinib treatment (79). A drug resistance mechanism involving the change in expression of the phosphatase associated with Akt has also been identified to restore Akt-(p) levels upon inhibitor treatment (12, 80). The roles of the phosphatase for ERK and the multimeric complex [EGFR·Shc·Grb2·SOS·RasGTP] in enhanced signaling and/or drug resistance have not yet been established. Although it is clear that the changes in expression levels for the ERK phosphatase will have a direct impact in shaping the nature of the ERK-(p) response which has a significant bearing on cellular decisions (81), future studies (perhaps structural in the case of the latter) are required to glean their precise roles (if any) in this context.
In conclusion, we have described the role of a systems-level model with molecular-resolution for short-time EGFR-mediated signal transduction before internalization, to help rationalize the collective information emerging from structural, biochemical, cell biology, and clinical studies. Our approach enables us to transcribe differences in molecular mechanisms as well as functional activity originating at the single molecule level into tangible differences in early signaling events. Therefore, subject to the well appreciated modeling limitations of deterministic systems modeling (i.e., uncertainty in network topology/parameters, neglect of molecular cross-talk with other signaling pathways, autocrine loops, internalization, feedback from nuclear signaling, spatial gradients, and stochastic effects), this predictive capability is useful in differentiating signaling characteristics of mutant cell lines from the native wild-type case and at untangling the differential nature of early signaling events triggered by receptor activation, their inhibition characteristics, and their consequences in shaping the signal transduction in altered cell lines derived from different pathologies. A complete model, which is currently being pursued, will not only require resolving the differential characteristics of all of the tyrosine phosphorylation sites in EGFRTK and their associated substrate recognition properties in EGFR, but also the extension to other Erb family members in the context of homo- and heterodimers. Transactivation of EGFR occurring through ligand-induced receptor heterodimerization (82) combined with a potential for differential signaling adds a palette of finer control elements in the ErbB-family signaling network. Indeed, in addition to the role of ErbB3 in drug resistance (as discussed above) recent studies have identified possible mutations in and overexpression of ErbB2, that may correlate with drug sensitivity in different cancers (83, 84). The correlation between the identified nodes of the network causing network hypersensitivity and clinically observed oncogenic transformations and mechanisms of drug resistance suggests that the computational tools described here are ideal for assessing the likely effect of novel EGFR and ErbB2 mutations and evaluating inhibitor efficacies. Even though we have focused primarily on mutations and inhibitors in non-small-cell lung cancer, further development of methods for constructing molecularly resolved models, describing network cooperativity, and performing global sensitivity analysis, and their applications to oncogenic signaling pathways will help evaluate and even forecast analogous drug-sensitizing mutations and drug resistance mechanisms other cancers. Thus, we believe that our model driven approach will benefit the optimization of future small molecule therapeutic inhibition strategies.
Acknowledgments
We acknowledge funding from the National Science Foundation through grant CBET-0730955 and from the Whitaker Foundation. Computational resources were available in part from the National Partnerships for Advanced Computational Infrastructure through grant MRAC MCB060006.
Appendix
Preferential Akt Activation and the Homeostasis of Cellular Survival/Death
The preferential activation of Akt in the predicted downstream response (between the wild-type and the mutant) accounted for by early signaling events described here, compounded by differences in trafficking reported by Hendricks et al. (13), can potentially lead to divergent long-term behavior in cellular decisions and responses between WT and L834R mutant cell lines. One such divergent property that has been invoked in the context of the L834R mutant cell line (which is absent in WT) is oncogene addiction (12, 68, 69). The term “oncogene addiction” was first coined to describe an intriguing phenomenon in which some tumor cells, despite the accumulation of multiple genetic alterations, seem to become dependent on a single oncogenic activity for their sustained proliferation and/or survival (68, 69). Oncogene addiction has been proposed as a likely explanation for the rapid regression of human tumors treated with imatinib and gefitinib, highlighting potentially important implications of this phenomenon in the treatment of cancer. Although the precise molecular mechanisms that describe the onset of such an addiction phenomenon in gefitinib-sensitive cells such as those harboring the L834R mutant remains elusive (and is clearly beyond the scope of our discussion), a simplistic model to discuss the preferential Akt activation in L834R cells in the context of this addiction phenomenon is presented here. With respect to cellular survival [S] and death [D], the condition for homeostasis is that d[S]/dt is balanced by d[D]/dt, where [S] and [D] are triggered (and balanced) by a variety of (interacting) intracellular pathways. The onset of oncogene addiction is analogous to a short-circuit, wherein following an oncogenic transformation, one of the pro-survival pathways triggering [S] dominates over the others (e.g., constitutive activation of growth factor receptor which signals even in the absence of any growth factor ligand), and the cell adapts by relying on this pathway for the generation of [S] (e.g, this could occur via the preferential activation of Akt). The activation of Akt is unique in the sense that Akt-(p), while triggering a variety of pro-survival factors that contribute to [S] (e.g., through NFκB, Bad-(p), Bcl-2 etc.), simultaneously, either directly or indirectly, also inhibits pro-death signals leading to [D] (e.g., through inhibiting p38, Bad, FKH etc.); see Figure 9a (85). This leads to an oversimplified phenomenological circuit for the balance of [S] and [D] through Akt activation given in Figure 9b, where the appearance of p38 is only suggestive, and which can be replaced by any of the pro-death triggering signals for the purpose of our argument.
The phenomenological model in Figure 9b to produce Akt-(p) can be summarized by Akt ⇋ Akt-(p) → S, with equilibrium constant K1 = [Akt-(p)]/[Akt] and rate constant k1; p38 → D, with rate constant k2; Akt-(p) + p38 ⇋ Akt-(p)·p38 with equilibrium constant K2 = [Akt-(p)·p38]/[Akt-(p)][p38] and can be solved analytically, as illustrated below. In this model, the cellular states S and D denote survival and death. The three reactions are suggestive of effect of Akt in Figure 9a, i.e., Akt activating survival pathways, and simultaneously, inhibiting apoptotic pathways. A mass balance at equilibrium yields
Here [Akt]0 and [p38]0 are the total concentrations of the species initially (at time t = 0). The above equations can be solved to obtain quasi-equilibrium concentrations of [Akt-(p)]
From this relationship we can obtain (1) the qualitative nature of [Akt-(p)] and [p38] responses for different conditions [Akt]0 and [p38]0 (note that only the positive branch of the above solution yields non-negative [Akt-(p)]), and (2) the relative strengths of the survival and death signals (i.e., λ = d[S]/dt −d[D]/dt). These qualitative characteristics are plotted in Figure 9c,d in arbitrary units (i.e., by assuming k1 = k2 = 1 S−1, K1 = 1, and K2 = 1 M−1) and are trends remain unchanged with respect to variations in these parameters.
The solution for λ = d[S]/dt − d[D]/dt for a range of initial conditions of the pro-survival factor [Akt]0 and pro-death factor [p38]0 is provided in Figure 9c,d. Irrespective of the parameter values, the qualitative trend in Figure 9 is unaltered (because only one branch of the solution yields physical non-negative concentrations for [Akt-(p)] and [p38]) i.e., with increasing [Akt-(p)], the [p38] decreases, and λ increases at a faster rate than the rate of increase in [Akt-(p)] itself. Both these properties are conducive for the cell to rely on (be addicted to) the most efficient [Akt-(p)] generating pathway for [S] leaving the generation of [D] for homeostasis on other pathways. Such a circumstance, following an oncogenic transformation, places the cell in the red state of Figure 9c with a positive value of λ. More importantly, the inhibition of the now exclusive pathway generating [Akt-(p)] and hence [S] produces a dramatic effect of throwing the cell from the state with a positive value of λ to one with negative value of λ, therefore driving apoptosis, which may be qualitatively linked to the underlying basis for the hypersensitive inhibition.
References and Notes
- 1.Citri A, Yarden Y. EGF-ERBB signalling: towards the systems level. Nat Rev Mol Cell Biol. 2006;7(7):505–516. doi: 10.1038/nrm1962. [DOI] [PubMed] [Google Scholar]
- 2.Sordella R, et al. Gefitinib-sensitizing EGFR mutations in lung cancer activate anti-apoptotic pathways. Science. 2004;305(5687):1163–1167. doi: 10.1126/science.1101637. [DOI] [PubMed] [Google Scholar]
- 3.Carey KD, et al. Kinetic analysis of epidermal growth factor receptor somatic mutant proteins shows increased sensitivity to the epidermal growth factor receptor tyrosine kinase inhibitor, erlotinib. Cancer Res. 2006;66(16):8163–8171. doi: 10.1158/0008-5472.CAN-06-0453. [DOI] [PubMed] [Google Scholar]
- 4.Chen YR, et al. Distinctive activation patterns in constitutively active and gefitinib-sensitive EGFR mutants. Oncogene. 2006;25(8):1205–1215. doi: 10.1038/sj.onc.1209159. [DOI] [PubMed] [Google Scholar]
- 5.Paez JG, et al. EGFR mutations in lung cancer: correlation with clinical response to gefitinib therapy. Science. 2004;304(5676):1497–1500. doi: 10.1126/science.1099314. [see comment] [DOI] [PubMed] [Google Scholar]
- 6.Lynch TJ, et al. Activating mutations in the epidermal growth factor receptor underlying responsiveness of non-small-cell lung cancer to gefitinib. N Engl J Med. 2004;350(21):2129–2139. doi: 10.1056/NEJMoa040938. [DOI] [PubMed] [Google Scholar]
- 7.Choi SH, Mendrola JM, Lemmon MA. EGF-independent activation of cell-surface EGF receptors harboring mutations found in gefitinib-sensitive lung cancer. Oncogene. 2006 doi: 10.1038/sj.onc.1209957. [DOI] [PubMed] [Google Scholar]
- 8.Shih A, et al. Network of stabilizing hydrogen bonds is integral to the dimer-mediated allosteric activation mechanism in the ErbB1 and ErbB4 kinase. 2008 Submitted for publication. [Google Scholar]
- 9.Liu Y, et al. A multiscale computational approach to dissect early events in the Erb family receptor mediated activation, differential signaling, and relevance to oncogenic transformations. Ann Biomed Eng. 2007;35(6):1012–1025. doi: 10.1007/s10439-006-9251-0. [DOI] [PMC free article] [PubMed] [Google Scholar]
- 10.Lynch TJ, et al. Activating mutations in the epidermal growth factor receptor underlying responsiveness of non-small-cell lung cancer to gefitinib. [see comment] N Engl J Med. 2004;350(21):2129–2139. doi: 10.1056/NEJMoa040938. [DOI] [PubMed] [Google Scholar]
- 11.Noro R, et al. Gefitinib (IRESSA) sensitive lung cancer cell lines show phosphorylation of Akt without ligand stimulation. BMC Cancer. 2006;6:277. doi: 10.1186/1471-2407-6-277. [DOI] [PMC free article] [PubMed] [Google Scholar]
- 12.Sharma SV, et al. A common signaling cascade may underlie “addiction” to the Src, BCR-ABL, and EGF receptor oncogenes. Cancer Cell. 2006;10(5):425–435. doi: 10.1016/j.ccr.2006.09.014. [DOI] [PMC free article] [PubMed] [Google Scholar]
- 13.Hendriks BS, et al. Decreased internalisation of ErbB1 mutants in lung cancer is linked with a mechanism conferring sensitivity to gefitinib. Systems Biology, IEE Proc. 2006;153(6):457–466. doi: 10.1049/ip-syb:20050108. [DOI] [PubMed] [Google Scholar]
- 14.Liu Y, et al. A multiscale computational approach to dissect early events in the erb family receptor mediated activation, differential signaling, and relevance to oncogenic transformations. Ann Biomed Eng. 2007;35:1012–1025. doi: 10.1007/s10439-006-9251-0. [DOI] [PMC free article] [PubMed] [Google Scholar]
- 15.Schlessinger J. Common and distinct elements in cellular signaling between EGF and FGF receptors. Science. 2004;306:1506–1507. doi: 10.1126/science.1105396. [DOI] [PubMed] [Google Scholar]
- 16.Schlessinger J. Cell signaling by receptor tyrosine kinases. Cell. 2000;103:211–225. doi: 10.1016/s0092-8674(00)00114-8. [DOI] [PubMed] [Google Scholar]
- 17.Jorrinssen RN. Epidermal growth factor receptor: mechanism of activation and signaling. Exp Cell Res. 2003;284:31–53. doi: 10.1016/s0014-4827(02)00098-8. [DOI] [PubMed] [Google Scholar]
- 18.Shawyer LK, Slamon D, Ullrich AA. Smart drugs: tyrosine kinase inhibitors in cancer therapy. Cell. 2002;1:117–123. doi: 10.1016/s1535-6108(02)00039-9. [DOI] [PubMed] [Google Scholar]
- 19.Chatterjee A, et al. Binomial distribution based tau-leap accelerated stochastic simulation. J Chem Phys. 2005;122:024112. doi: 10.1063/1.1833357. [DOI] [PubMed] [Google Scholar]
- 20.AC, et al. Binomial distribution based tau-leap accelerated stochastic simulation. J Chem Phys. 2005:024112. doi: 10.1063/1.1833357. [DOI] [PubMed] [Google Scholar]
- 21.Kholodenko BN, et al. Quantification of short term signaling by the epidermal growth factor receptor. J Biol Chem. 1999;274(42):30169–30181. doi: 10.1074/jbc.274.42.30169. [DOI] [PubMed] [Google Scholar]
- 22.Aksan I, Kurnaz ML. Computer-based model for the regulation of MAPK activation. J Recept Signal Transduction Res. 2003;23:197–209. doi: 10.1081/rrs-120025203. [DOI] [PubMed] [Google Scholar]
- 23.Asthagiri A, Lauffenburger DA. Cell signaling models in bioengineering. Annu Rev Biomed Eng. 2000;2:32–53. doi: 10.1146/annurev.bioeng.2.1.31. [DOI] [PubMed] [Google Scholar]
- 24.Miller JH, Zhang F. Large scale simulation of cellular signaling processes. Parallel Comput. 2004 [Google Scholar]
- 25.Schoeberl B, et al. Computational modeling of the dynamics of MAPKinase cascade activated by surface and internalized receptors. Nat Biotechnol. 2002;20:370–375. doi: 10.1038/nbt0402-370. [DOI] [PubMed] [Google Scholar]
- 26.Canteley LC. The PI3K pathway. Science. 2002;296:1655–1657. doi: 10.1126/science.296.5573.1655. [DOI] [PubMed] [Google Scholar]
- 27.Brown KS, et al. The statistical mechanics of complex signaling networks: nerve growth factor signaling. Phys Biol. 2004;1:184–195. doi: 10.1088/1478-3967/1/3/006. [DOI] [PubMed] [Google Scholar]
- 28.Hatakeyama M, et al. A computational model on the modulation of MAPK and Akt pathways in Heregulin-induced ERB signaling. Biochem J. 2003;373:451–463. doi: 10.1042/BJ20021824. [DOI] [PMC free article] [PubMed] [Google Scholar]
- 29.Rodrigues GA, et al. A Novel Positive Feedback Loop Mediated by the Docking Prote in Gab1 and Phosphatidylinositol 3-Kinase in Epidermal Growth Factor Receptor Signaling. Mol Cell Biol. 2000;20:1448–1459. doi: 10.1128/mcb.20.4.1448-1459.2000. [DOI] [PMC free article] [PubMed] [Google Scholar]
- 30.Sachsenmaler C. Targeting protein kinases for tumor therapy. Onkologie. 2001;24:346–355. doi: 10.1159/000055106. [DOI] [PubMed] [Google Scholar]
- 31.Mendelsohn J, Baselga J. Status of EGFR antagonists in biology and treatment of cancer. J Clin Oncol. 2003;21:2782–2799. doi: 10.1200/JCO.2003.01.504. [DOI] [PubMed] [Google Scholar]
- 32.Pulverer B. Nature insight: Cancer. Nature. 2003;411:335–395. [Google Scholar]
- 33.Uyemura T, et al. Single-molecule analysis of epidermal growth factor signaling that leads to ultrasensitive calcium response. Biophys J. 2005 doi: 10.1529/biophysj.104.053330. [DOI] [PMC free article] [PubMed] [Google Scholar]
- 34.Bhalla US, Ram PT, Iyengar R. MAPKinase phosphotase as a locus of flexibility in a mitogen activated protein kinase signaling network. Science. 2002;297:1018–1023. doi: 10.1126/science.1068873. [DOI] [PubMed] [Google Scholar]
- 35.Bhalla US, Iyengar R. Emergent properties of biological networks. Science. 1999;283:381–387. doi: 10.1126/science.283.5400.381. [DOI] [PubMed] [Google Scholar]
- 36.Weng G, Bhalla US, Iyengar R. Complexities in biological signaling systems. Science. 1999;284:92–96. doi: 10.1126/science.284.5411.92. [DOI] [PMC free article] [PubMed] [Google Scholar]
- 37.Haugh JM, Wells A, Lauffenburger DA. Mathematical modeling of epidermal growth factor receptor signaling through the phospholipase C pathway: mechanistic insights and predictions for molecular interventions. Biotechnol Bioeng. 2000;70(2):225–238. [PubMed] [Google Scholar]
- 38.Boerner JL, et al. Phosphorylation of Y845 on the epidermal growth factor receptor mediates binding to the mitochondrial protein cytochromec oxidase subunit II. Mol Cell Biol. 2004;24:7059–7071. doi: 10.1128/MCB.24.16.7059-7071.2004. [DOI] [PMC free article] [PubMed] [Google Scholar]
- 39.Kloth MT, et al. STAT5b, a mediator of synergism between c-Src and the epidermal growth factor receptor. J Biol Chem. 2003;278:1671–1679. doi: 10.1074/jbc.M207289200. [DOI] [PubMed] [Google Scholar]
- 40.Biscardi JS, et al. c-Src-Mediated phosphorylation of the epidermal growth factor receptor on Tyr845 and Tyr1101 is associated with modulation of receptor function. J Biol Chem. 1999;274(12):8335–8343. doi: 10.1074/jbc.274.12.8335. [DOI] [PubMed] [Google Scholar]
- 41.Wu W, et al. Src-dependent phosphorylation of the epidermal growth factor receptor on tyrosine 845 is required for zinc-induced Ras activation. J Biol Chem. 2002;277(27):24252–24257. doi: 10.1074/jbc.M200437200. [DOI] [PubMed] [Google Scholar]
- 42.Haugh JM, Lauffenburger DA. Analysis of receptor internalization as a mechanism for modulating signal transduction. J Theor Biol. 1998;195(2):187–218. doi: 10.1006/jtbi.1998.0791. [DOI] [PubMed] [Google Scholar]
- 43.Vieira AV, Lamaze C, Schmid SL. Control of EGF Receptor signaling by clathrim-mediated endocytosis. Science. 1996;274:2066–2089. doi: 10.1126/science.274.5295.2086. [DOI] [PubMed] [Google Scholar]
- 44.Dikic I. Mechanisms controlling EGF receptor endocytosis and degradation. Biochem Soc Trans. 2003;31:1178–1181. doi: 10.1042/bst0311178. [DOI] [PubMed] [Google Scholar]
- 45.Kim J, et al. Regulation of EGFR internalization by GPCR. Biochemistry. 2003;42:2887–2894. doi: 10.1021/bi026942t. [DOI] [PubMed] [Google Scholar]
- 46.Pierce KL, et al. Role of endocytosis in the activation of extracellular signal-regulated kinase cascade by sequestering and nonsequestering GPCR. Proc Natl Acad Sci US A. 2000;97:1489–1494. doi: 10.1073/pnas.97.4.1489. [DOI] [PMC free article] [PubMed] [Google Scholar]
- 47.Luttrell LM, Daaka Y, Lefkowitz RJ. Regulation of tyrosine kinase cascades by GPCR. Curr Opin Cell Biol. 1999;11:177–183. doi: 10.1016/s0955-0674(99)80023-4. [DOI] [PubMed] [Google Scholar]
- 48.Bookout AL, et al. Targeting G β γ signaling to inhibit prostate tumor formation and growth. J Biol Chem. 2003;278:37569–37573. doi: 10.1074/jbc.M306276200. [DOI] [PubMed] [Google Scholar]
- 49.Prenzel N, et al. Tyrosine kinase signalling in breast cancer epidermal growth factor receptor: convergence point for signal integration and diversification. Breast Cancer Res. 2000;2:184–190. doi: 10.1186/bcr52. [DOI] [PMC free article] [PubMed] [Google Scholar]
- 50.Cabodi S, et al. Integrin regulation of epidermal growth factor (EGF) receptor and of EGF-dependent responses. Biochem Soc Trans. 2004;32:438–442. doi: 10.1042/BST0320438. [DOI] [PubMed] [Google Scholar]
- 51.Fischer OM, et al. EGFR signal transactivation in cancer cells. Biochem Soc Trans. 2003;31:1203–1208. doi: 10.1042/bst0311203. [DOI] [PubMed] [Google Scholar]
- 52.Saso K, et al. Differential inhibition of epidermal growth factor signaling pathways in rat hepatocytes by long-term ethanol treatment. Gastroenterology. 1997;112(6):2073–2088. doi: 10.1053/gast.1997.v112.pm9178701. [DOI] [PubMed] [Google Scholar]
- 53.Schulze WX, Deng L, Mann M. Phosphotyrosine interactome of the ErbB-receptor kinase family. Mol Syst Biol. 2005:1. doi: 10.1038/msb4100012. [DOI] [PMC free article] [PubMed] [Google Scholar]
- 54.Mulloy R, et al. Epidermal growth factor receptor mutants from human lung cancers exhibit enhanced catalytic activity and increased sensitivity to gefitinib. Cancer Res. 2007;67(5):2325–2330. doi: 10.1158/0008-5472.CAN-06-4293. [DOI] [PubMed] [Google Scholar]
- 55.Zhang X, et al. An allosteric mechanism for activation of the kinase domain of epidermal growth factor receptor. Cell. 2006;125(6):1137–1149. doi: 10.1016/j.cell.2006.05.013. [DOI] [PubMed] [Google Scholar]
- 56.Brignola PS, et al. Comparison of the biochemical and kinetic properties of the type 1 receptor tyrosine kinase intracellular domains–Demonstration of differential sensitivity to kinase inhibitors. J Biol Chem. 2002;277(2):1576–1585. doi: 10.1074/jbc.M105907200. [DOI] [PubMed] [Google Scholar]
- 57.Fan YX, et al. Ligand regulates epidermal growth factor receptor kinase specificity–Activation increases preference for GAB1 and SHC versus autophosphorylation sites. J Biol Chem. 2004;279(37):38143–38150. doi: 10.1074/jbc.M405760200. [DOI] [PubMed] [Google Scholar]
- 58.Brignola PS, et al. Comparison of biochemical and kinetic properties of type 1 receptor tyrosine kinase intracellular domains. J Biol Chem. 2001;277:1576–1581. doi: 10.1074/jbc.M105907200. [DOI] [PubMed] [Google Scholar]
- 59.Zhang XW, et al. An allosteric mechanism for activation of the kinase domain of epidermal growth factor receptor. Cell. 2006;125(6):1137–1149. doi: 10.1016/j.cell.2006.05.013. [DOI] [PubMed] [Google Scholar]
- 60.Stamos J, Sliwkowski MX, Eigenbrot C. Structure of the epidermal growth factor receptor kinase domain alone and in complex with a 4-anilinoquinazoline inhibitor. J Biol Chem. 2002;277(48):46265–46272. doi: 10.1074/jbc.M207135200. [DOI] [PubMed] [Google Scholar]
- 61.Dill KA. Molecular Driving Forces. Garland Science; New York: 2003. [Google Scholar]
- 62.Zhou HX. Loops in proteins can be modeled as worm-like chains. J Phys Chem B. 2001;105(29):6763–6766. [Google Scholar]
- 63.Zhang Y, et al. Time-resolved mass spectrometry of tyrosine phosphorylation sites in the epidermal growth factor receptor signaling network reveals dynamic modules. Mol Cell Proteomics. 2005;4(9):1240–1250. doi: 10.1074/mcp.M500089-MCP200. [DOI] [PubMed] [Google Scholar]
- 64.Press WH, et al. Numerical Recipes, the Art of Scientific Computing. Cambridge Univ. Press; Cambridge, England: 1986. [Google Scholar]
- 65.Tracy S, et al. Gefitinib induces apoptosis in the EGFRL858R non-small-cell lung cancer cell line H3255. Cancer Res. 2004;64(20):7241–7244. doi: 10.1158/0008-5472.CAN-04-1905. [DOI] [PubMed] [Google Scholar]
- 66.Wells A, et al. Ligand-induced transformation by a noninternalizing epidermal growth factor receptor. Science. 1990;247(4945):962–964. doi: 10.1126/science.2305263. [DOI] [PubMed] [Google Scholar]
- 67.Radhakrishnan R. Molecular systems biology: bridging the gap through multiscale modeling and high-performance computing. Mol Biosyst. 2008 doi: 10.1039/b803806f. submitted for publication. [DOI] [PMC free article] [PubMed] [Google Scholar]
- 68.Weinstein IB, Joe AK. Mechanisms of disease: Oncogene addiction–a rationale for molecular targeting in cancer therapy. Nat Clin Pract Oncol. 2006;3(8):448–457. doi: 10.1038/ncponc0558. [DOI] [PubMed] [Google Scholar]
- 69.Weinstein IB. Cancer. Addiction to oncogenes–the Achilles heal of cancer. Science. 2002;297(5578):63–64. doi: 10.1126/science.1073096. [DOI] [PubMed] [Google Scholar]
- 70.Duesbery N, Vande Woude G. BRAF and MEK mutations make a late entrance. Sci STKE. 2006;2006(328):pe15. doi: 10.1126/stke.3282006pe15. [DOI] [PubMed] [Google Scholar]
- 71.Bentires-Alj M, et al. A role for the scaffolding adapter GAB2 in breast cancer. Nat Med. 2006;12(1):114–21. doi: 10.1038/nm1341. [DOI] [PubMed] [Google Scholar]
- 72.Mascaux C, et al. The role of RAS oncogene in survival of patients with lung cancer: a systematic review of the literature with meta-analysis. Br J Cancer. 2005;92(1):131–9. doi: 10.1038/sj.bjc.6602258. [DOI] [PMC free article] [PubMed] [Google Scholar]
- 73.Samuels Y, et al. High frequency of mutations of the PIK3CA gene in human cancers. Science. 2004;304(5670):554. doi: 10.1126/science.1096502. [DOI] [PubMed] [Google Scholar]
- 74.Sjoblom T, et al. The consensus coding sequences of human breast and colorectal cancers. Science. 2006;314(5797):268–274. doi: 10.1126/science.1133427. [DOI] [PubMed] [Google Scholar]
- 75.Janmaat ML, et al. Response to epidermal growth factor receptor inhibitors in non-small cell lung cancer cells: limited antiproliferative effects and absence of apoptosis associated with persistent activity of extracellular signal-regulated kinase or Akt kinase pathways. Clin Cancer Res. 2003;9(6):2316–2326. [PubMed] [Google Scholar]
- 76.Venter H, et al. An ABC transporter with a secondary-active multidrug translocator domain. Nature. 2003;426:866–870. doi: 10.1038/nature02173. [DOI] [PubMed] [Google Scholar]
- 77.Blencke S, Ullrich A, Daub H. Mutation of threonine 766 in the epidermal growth factor receptor reveals a hotspot for resistance formation against selective tyrosine kinase inhibitors. J Biol Chem. 2003;278(17):15435–15440. doi: 10.1074/jbc.M211158200. [DOI] [PubMed] [Google Scholar]
- 78.Bing Liu BBJHW. Impact of EGFR point mutations on the sensitivity to gefitinib: Insights from comparative structural analyses and molecular dynamics simulations. Proteins: Struct Funct Bioinformatics. 2006;65(2):331–346. doi: 10.1002/prot.21111. [DOI] [PubMed] [Google Scholar]
- 79.Engelman JA, et al. MET amplification leads to gefitinib resistance in lung cancer by activating ERBB3 signaling. Science. 2007;316(5827):1039–1043. doi: 10.1126/science.1141478. [DOI] [PubMed] [Google Scholar]
- 80.Sergina NV, et al. Escape from HER-family tyrosine kinase inhibitor therapy by the kinase-inactive HER3. Nature. 2007;445(7126):437–441. doi: 10.1038/nature05474. [DOI] [PMC free article] [PubMed] [Google Scholar]
- 81.Kholodenko BN. Cell-signalling dynamics in time and space. Nat Rev Mol Cell Biol. 2006;7(3):165–176. doi: 10.1038/nrm1838. [DOI] [PMC free article] [PubMed] [Google Scholar]
- 82.Waterman H, Yarden Y. Molecular mechanisms underlying endocytosis and sorting of Erb receptor tyrosine kinases. FEBS letters. 2001;490:142–152. doi: 10.1016/s0014-5793(01)02117-2. [DOI] [PubMed] [Google Scholar]
- 83.Lee JW, et al. ERBB2 kinase domain mutation in a gastric cancer metastasis. APMIS. 2005;113(10):683–687. doi: 10.1111/j.1600-0463.2005.apm_284.x. [DOI] [PubMed] [Google Scholar]
- 84.Lee JW, et al. Somatic mutations of ERBB2 kinase domain in gastric, colorectal, and breast carcinomas. Clin Cancer Res. 2006;12(1):57–61. doi: 10.1158/1078-0432.CCR-05-0976. [DOI] [PubMed] [Google Scholar]
- 85.Krauss G. Biochemistry of Signal Transduction and Regulation. 3. Weinheim: Wiley-VCH; 2003. [Google Scholar]