Abstract
We present a computational methodology for incorporating thermal effects and calculating relative free energies for elastic fluid membranes subject to spatially dependent intrinsic curvature fields using the method of thermodynamic integration. Based on a simple model for the intrinsic curvature imposed only in a localized region of the membrane, we employ thermodynamic integration to calculate the free-energy change as a function of increasing strength of the intrinsic curvature field and a thermodynamic cycle to compute free-energy changes for different sizes of the localized region. By explicitly computing the free-energy changes and by quantifying the loss of entropy accompanied with increasing membrane deformation, we show that the membrane stiffness increases with increasing intrinsic field, thereby, renormalizing the membrane bending rigidity. The second main conclusion of this work is that the entropy of the membrane decreases with increasing size of the localized region subject to the curvature field. Our results help to quantify the free-energy change when a planar membrane deforms under the influence of curvature-inducing proteins at a finite temperature.
I. INTRODUCTION
Cell-membrane deformations are often orchestrated by protein-membrane interactions [1,2], which mediate several intracellular trafficking events [3–5]. Accordingly, theoretical modeling and experimental study of membranes and protein-membrane interactions at multiple resolutions is a central objective in biophysics [6–13]. In this paper, we employ phenomenological theories based on generalized elasticity (see below) [14,15] in order to describe mesoscopic (at the ~μm resolution) behavior of membranes, membrane undulations, and curvature modulations [16–20]. These models have been extensively employed and specific choices of the governing equations (e.g., the form for membrane free energy) have been validated based on experimental studies. Hence, at the mesoscopic scales such models are considered reliable; however, a major challenge has been in tailoring them for the quantification of free energies.
In a classic article, Helfrich [21] described the elastic energy of a fluid membrane by the Hamiltonian,
| (1) |
where A is the total area of the membrane, dA is the differential area element, Aflat is the projected area of the membrane patch on a plane, and H and K are the mean curvature and the Gaussian curvature of the membrane, respectively. The membrane Hamiltonian depends on the frame tension σ, the bending rigidity κ, the splay modulus κ̄, and the intrinsic curvature field H0. Considering only those membrane shapes for which the overall membrane topology does not change, the contribution of Gaussian curvature to the Helfrich Hamiltonian is a constant. Within the Helfrich Hamiltonian, the effect of protein-induced curvature is treated through the H0 term [22] which, in general, is a spatially varying function. To make the analytical and numerical calculations tractable, we only consider small deformations of the membrane, in which case, the membrane shape can be represented in a Monge or a Cartesian gauge as z=z(x,y). The resulting Helfrich Hamiltonian obtained by simplifying the expressions for the mean curvature and the differential area element in Eq. (1) is given by [22]
| (2) |
In previous studies, the Hamiltonian described in Eq. (2) with H0 =0 has been employed to describe various membrane-related phenomena. Lin and Brown [16] performed dynamics simulations accounting for implicit hydrodynamic coupling between the membrane and the surrounding solvent in the presence of cytoskeletal interactions. Reister-Gottfried et al. [17] extended this methodology to account for the Brownian dynamics of the proteins on the fluctuating membrane. Veksler and Gov [23] analyzed the problem of membrane protrusions and protein phase separation by including additional terms in Eq. (2) to account for the protein concentration field. Seifert et al. [12] minimized Helfrich Hamiltonian given by Eq. (1) for nonzero values of H0 at zero temperature to calculate the phase diagram for vesicle shape transformations. Although these works have highlighted the applicability of Helfrich Hamiltonian in a variety of membrane-related processes, calculating the free-energy change associated with these processes has remained a challenge.
The calculation of the free energy of a freely fluctuating membrane with zero-spontaneous curvature within the Helfrich Hamiltonian can be accomplished analytically using a quasiharmonic analysis of the Fourier modes [16,18,24,25]. However, using the same approach, calculating the free energy when the membrane is subject to nonzero and spatially varying H0 becomes analytically intractable [25]. In such a case, a robust numerical method is desirable because the ability to compute free-energy changes enables the prediction of relative stabilities of different states using which several critical questions can be addressed; these include the quantification of the free-energy change when a planar membrane deforms under the influence of curvature-inducing proteins at a finite temperature, the role of membrane entropy in mediating interactions between curvature-inducing proteins [26], etc. It is our goal in this paper to present a simulation methodology capable of addressing these questions. Calculation of free-energy changes associated with reversible thermodynamic processes have been described extensively for molecular systems [27,28]. We employ the rigorous and popular method of thermodynamic integration (TI) [27] to calculate the free-energy change along a coupling parameter characterizing the Hamiltonian. Such a method has recently been applied within classical field-based simulations of polymer solutions [29].
We demonstrate the applicability in a model system of membrane deformations caused by a static (i.e., nondiffusing) heterogeneous curvature field. The model is characterized by a radially symmetric mean curvature field on the membrane over a localized region characterized by a linear extent r0 (Fig. 1). The value of H0 is taken to be zero in membrane regions falling outside the localized region. Thus, the induced curvature field is described by
FIG. 1.
(Color online) A depiction of membrane vesiculation in the presence of the clathrin-coat assembly. The lower panel depicts the form of spontaneous curvature function H0, corresponding to a region of induced curvature of linear extent r0.
| (3) |
where Γ(r0) is a function that it is unity within a circular domain (centered at zero) of radius r0 and zero, otherwise, and r0 is the linear extent (radius) of the curvature-field projected on the x-y plane. For the sake of illustration, we choose C0 =0.04 1/nm (magnitude of the intrinsic curvature employed in our recent work reporting the bioenergetics of clathrin-coated vesicular bud formation [30]). We calculate the free-energy change of the membrane as a function of the extent of the curvature field (r0) as well as the magnitude of the curvature field (C0). We also present a quasiharmonic analysis of a simplified (one-dimensional analog) membrane system with nonzero intrinsic curvature to validate the trends uncovered by our free-energy calculations.
II. METHODS
A. TI along C0
For a system whose energy depends on a coupling parameter λ, the partition function can be written as [27,29]
| (4) |
where, c is a constant. Since the Helmholtz free energy F=−kBT ln Q, the derivative of the free energy with respect to λ can be written as
| (5) |
yielding,
| (6) |
In Eqs. (2) and (3), when C0 is set to zero, we recover a planar membrane while for nonzero values of C0, we obtain the desired state of the curvilinear membrane. We also note that the energy functional [Eq. (2)] is differentiable with respect to C0 but not differentiable with respect to r0. Hence, to compute the free-energy changes, we choose C0 as the thermodynamic integration variable [i.e., as the coupling parameter λ in Eq. (6)] to obtain
| (7) |
Using the expression for E from Eq. (2), we obtain
| (8) |
Upon integration along C0, this yields
| (9) |
Here, F(C0, r0)−F(0,r0) is the free-energy change as derived from the partition function in Eq. (4), where the energy is defined in Eq. (2). However, we are interested in the deformation free energy F0, with reference to a state where H0 =0, which can be calculated from the relationship, (see Appendix A)
| (10) |
where E0 is defined as
| (11) |
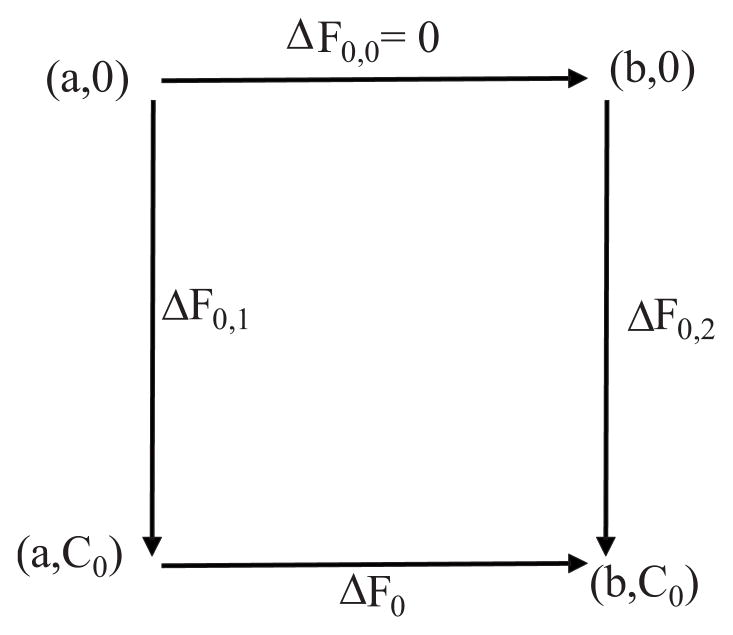
Thus, ΔF0 = F0(C0, r0)−F0(0,r0) gives the deformation free-energy change for a given extent of the localized region r0 (such as the size of the clathrin coat, see Fig. 1), when C0 is varied. To calculate the free energy as a function of r0 for a fixed C0, we employ a thermodynamic cycle defined in Fig. 2. In this cycle, ΔF0,1 and ΔF0,2 required to deform a planar membrane to H0 = C0Γ(r0 = a) and H0 = C0Γ(r0 = b), respectively, are calculated through Eqs. (9) and (10).
FIG. 2.
Thermodynamic cycle to calculate ΔF0: ΔF0 =−ΔF0,1 + ΔF0,0 + ΔF0,2. a and b are the extent of the curvature-induced regions (r0 values), while C0 is the magnitude of the curvature. ΔF0,1 and ΔF0,2 are computed using Eq. (9).
B. Simulation protocol
The equilibrium sampling of membrane conformations according to the Boltzmann distribution for a given value of C0 is performed using the time-dependent Ginzburg Landau (TDGL) simulations, using a protocol employed in our previous work [8,22]. In this protocol, we generate new membrane configurations from existing ones by numerically integrating the equation
| (12) |
where,
| (13) |
In Eq. (12), t represents a fictitious time, M is a scalar mobility term, and ξ is the thermal noise term, which is drawn randomly from a Gaussian distribution with zero mean and with variance depending on the temperature T, i.e., 〈ξ(r,t)〉 =0 and 〈ξ(r,t)ξ(r′,t′)〉 =2kBTM δ(t-t′) δ(r−r′). This ensures that membrane configurations generated by Eq. (12) are consistent with the canonical ensemble with probability ∝exp(−E/kBT).
Our simulations are performed for a system size of L × L in x,y dimensions, respectively, with periodic boundary conditions implemented in the xy plane. The length parameters (L values) for the different systems we have considered are summarized in Table I. For each system, the membrane is discretized using a 50×50 set of spatial grid points in the xy plane, each with a fixed grid length of h=L/50 nm. All the derivatives on the right-hand side of Eq. (13) are approximated using a second-order centered-difference scheme. TDGL equations are then integrated in time using an explicit Euler scheme [31]. The time step of integration δt is set to be 1 ps based on the linear stability analysis (see Appendix C). We choose a value of M(=2.5×10⁻⁶ m2 s/kg) such that the normalized membrane height autocorrelation 〈z(t)z(0)〉/〈z2〉 obtained in our simulations (when C0 =0, i.e., for system II in Table I) matches closely (see Appendix B and Fig. 8) with that obtained using the Oseen tensor formalism [33] (in which M is a spatially varying tensorial quantity). The latter incorporates hydrodynamic interactions and represents membrane dynamics in an infinite surrounding fluid in the Stokes regime [16]. Additionally, we note that our results for the equilibrium properties are independent of the value of mobility term M [22]. TDGL integration is performed for 200 million steps (i.e., 0.2 ms). The first 50 million steps are regarded as equilibration steps and are not included in computing the thermodynamic properties.
TABLE I.
Parameters employed in different systems.
Length L of the membrane is discretized into 50 grid points for all systems.
Temperature of 300 K is set for all systems.
FIG. 8.
Membrane height autocorrelation according to Eqs. (B6) and (B3). Here we have employed η= 3.475×10⁻³ kg/m-s (average viscosity of water (extracellular medium) and the cytoplasm [32]), κ=50kBT, and σ=0 N/m. The data are based on a discrete membrane patch of size 250×250 nm2 membrane patch with grids of 5×5 nm2.
By carrying out TDGL simulations with the parameters listed in Table I, the values of the integrand on the right-hand side of Eq. (9) for different values of C0 are computed (C0 is varied from 0 to 0.04 in increments of 0.005 1/nm). Hence, for each value of r0, in total, nine independent TDGL simulations are performed with different values of C0. The integral on the right-hand side of Eq. (9) is then computed from these nine values using the trapezoidal rule [31]. The process is repeated for r0 =10, 20, and 30 nm. For each value of r0, the mean energy of the membrane 〈E0〉 [defined in Eq. (11)] for C0 =0.04 1/nm is also computed from the TDGL sampling. Standard deviation (for the estimation of error bars) is computed by processing four separate blocks from two independent simulations, each block corresponding to 75 million steps of integration [28,34].
III. RESULTS
A. Calculation of membrane free energy
We report our numerical results for the free-energy changes obtained using thermodynamic integration. As evident from Fig. 3, increases with increasing value of C0 implying that the free energy of the membrane F increases with increasing magnitude of C0. Furthermore, for a larger extent r0, the increase in free energy is larger for a same change in C0. In Fig. 3, we also depict the calculated values of for different values of C0, r0. The quantity derived from these two plots yields the entropic contributions , which are plotted in the inset of Fig. 3. As evident from these figures, the entropy of the membrane decreases as C0 increases, with the decrease more prominent for larger values of r0.
FIG. 3.
(Color online) (solid lines) and (dotted lines) plotted for two values of r0 =20 nm and 30 nm for system II. The inset shows as a function of C0. Error bars, where not visible, are smaller than the symbols.
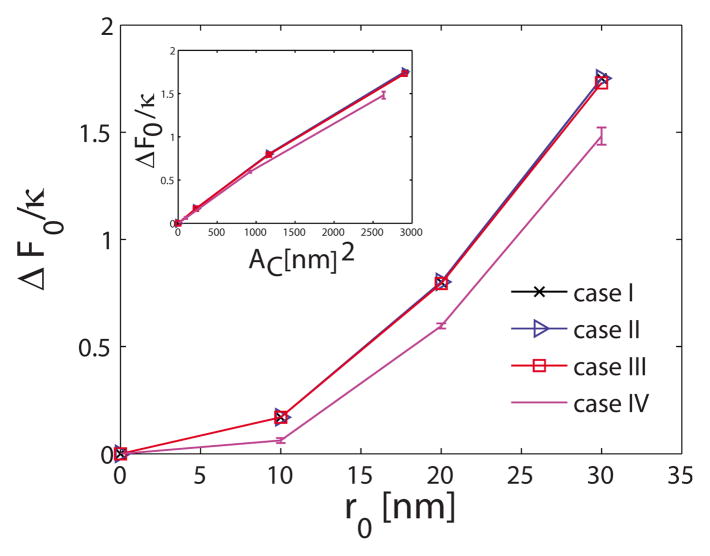
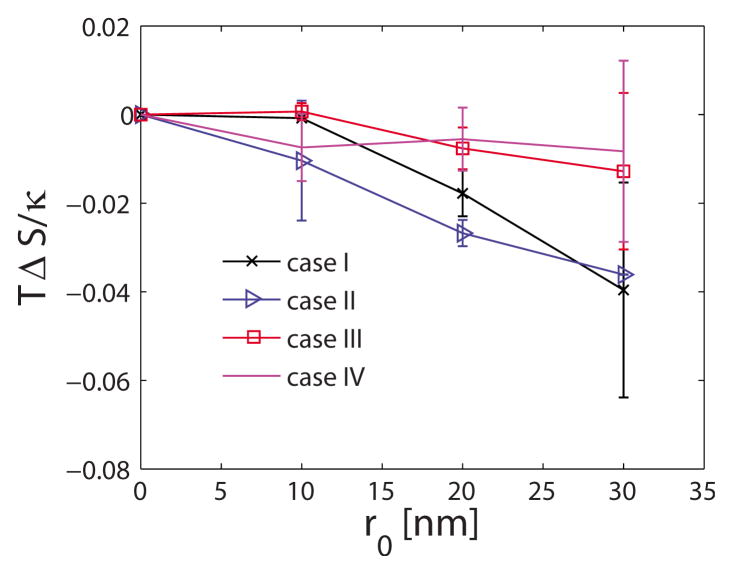
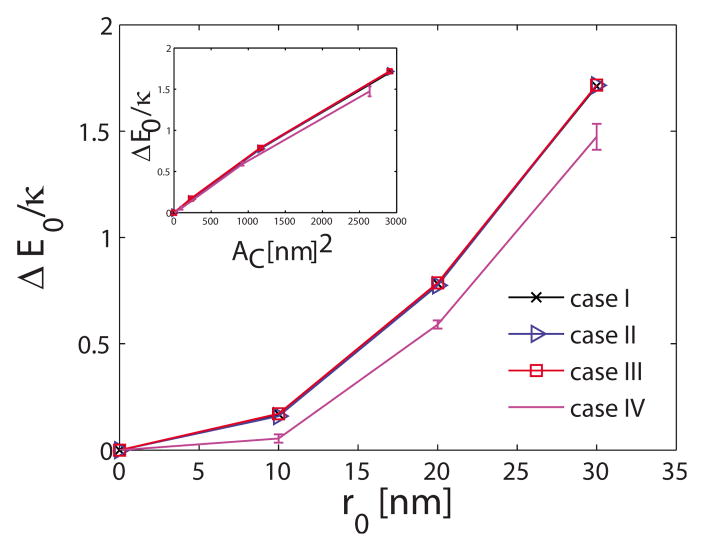
Using the thermodynamic cycle shown in Fig. 2, we also calculate the membrane deformation free-energy change as a function of the extent of r0. Since we are interested in computing the deformation free-energy change (Appendix A) with respect to a planar membrane (i.e., H0 =0), we compute the mean energy 〈E0〉 with respect to planar membrane, where E0 is defined in Eq. (11). The change in the deformation free energy (F0), the mean deformation energy (E0), and the entropy (TS) with respect to a planar membrane are plotted in Figs. 4–6, respectively, for the four different systems listed in Table I. The deformation free energy of the membrane increases as the extent of the curvature field r0 increases. Furthermore, changes in the nondimensional deformation free energy F0/κ and mean deformation energy E0/κ are similar for the first three systems in Table I. Thus, for the parameter values considered in this work, ΔF0/κ and ΔE0/κ depend only weakly on membrane bending rigidity κ and membrane frame tension σ. Insets in Figs. 4 and 5 depict the variation in ΔF0/κ and ΔE0/κ with the area of the localized region subject to the curvature field Ac defined as
FIG. 4.
(Color online) Membrane free-energy change as a function of r0. Error bars, where not visible, are smaller than the symbols.
FIG. 6.
(Color online) Membrane entropy change as a function of r0.
FIG. 5.
(Color online) Membrane energy change as a function of r0. Error bars, where not visible, are smaller than the symbols.
| (14) |
This trend is almost linear demonstrating that membrane free energy is a linear function of AC, for small deformations considered here. Interestingly, the increase in ΔF0/κ is smaller for the larger membrane size. Noting that the difference in the entropy change for different sizes of membrane is small, the changes in ΔF0/κ values are a reflection of the changes in ΔE0/κ.
To further dissect the calculated dependence of E0/κ on L, we note that the Eq. (11) can be written in discrete form as
| (15) |
where and ∇i are the Laplace and the gradient operator evaluated at grid point i. Between systems III and IV, the number of grid points remains the same, while the grid length h increases by a factor of 2. Since the total number of degrees of freedom remains the same, the total energy from equipartition is also the same. This implies that the terms (∇2z)2 and (∇z)2 are smaller in system IV relative to system III in order to compensate for increasing h. For ΔE0 =E0(C0 =0.04, r0 =30) − E0(0,0), the region of the membrane subject to the curvature contributes the most to the ΔE0 term. Hence, ΔE0 can be approximated in discrete form as
| (16) |
where the summation now is only over the grid points subject to the curvature field, which is smaller for the larger system size (i.e., system IV) resulting in a smaller value of ΔE0. The same conclusion can be reached if the step size h remains same, while the total number of grid points N change. Hence, we expect that a larger membrane would have a smaller increase in the free energy when subject to a fixed curvature region of size r0, rationalizing the trend in Fig. 4.
B. Quasiharmonic analysis for a model membrane with nonzero curvature
Fourier series has traditionally been the preferred basis set representing the modes of the thermally undulating membrane. In the absence of the H0 term, the Fourier modes decouple [16] and the Helfrich energy is simply the addition of harmonic contributions from the Fourier coefficients. However, the Fourier coefficients are not the natural basis when the membrane is subject to an intrinsic curvature field, as shown by several researchers [18,25]. In particular, Wallace et al. [18] and Divet et al. [25] solved the Helfrich Hamiltonian when the intrinsic curvature is proportional to the membrane concentration of curvature-inducing species. In such scenarios, the membrane Hamiltonian involves coupling between the membrane height and membrane composition. In the presence of a heterogeneous curvature field, it is also evident that the Hamiltonian in Eq. (2) with nonzero H0 is not diagonalized in Fourier space [35] due to cross terms (mode mixing). This feature is easily appreciated in a one-dimensional analog to the Helfrich model [choosing H0 =C0Γ(x0/2)] by expressing the membrane undulation of the form [35]
| (17) |
where q=2πm/L, m is an integer such that 0<m≤L/h, and aq and bq are the Fourier coefficients. Differentiating E twice with respect to aq, we obtain the stiffness (rigidity) associated with the qth sine mode [35]
| (18) |
In order to determine whether the dependence of the effective stiffness with x0, we evaluate
| (19) |
Since the right-hand side is always positive, the effective stiffness (κrenorm,q) of every sine mode q increases (or remains constant) with increasing x0. Differentiating Eq. (18) with respect to C0, we obtain
| (20) |
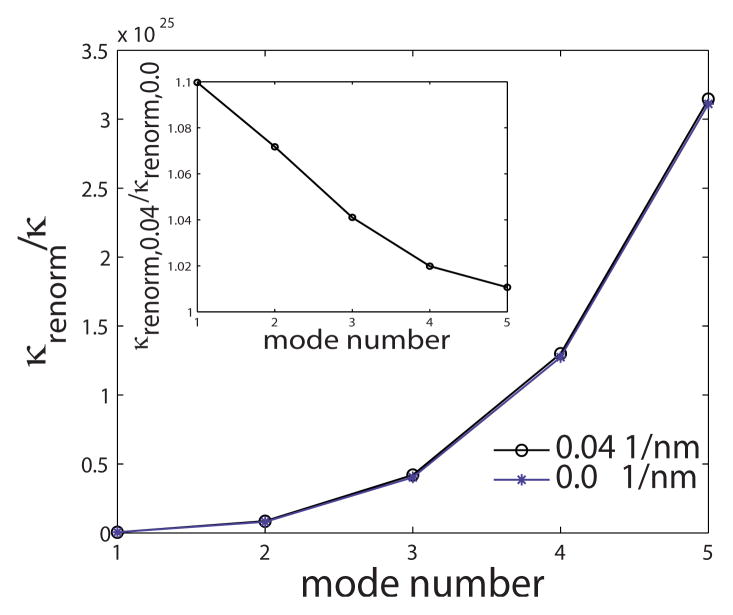
Since the function y − sin(y) is always positive for y >0, the right-hand side is always positive, which indicates that the effective stiffness of the sine mode q increases with increasing C0. These trends are illustrated in Fig. 7. Our results show that the membrane stiffness increases (and hence the fluctuations of the membrane and thereby the quasiharmonic entropy decreases) with increasing intrinsic membrane curvature H0. This provides the rationale for the similar trend quantifying the loss of entropy with increasing membrane deformation we have computed using the numerical TI calculations in Fig. 6.
FIG. 7.
(Color online) Renormalized stiffness associated with the eigenmodes of a one-dimensional model membrane for C0 =0.0 1/nm (asterisk) and C0 =0.04 1/nm (circle). We construct a stiffness matrix K associated with the cosine modes with wave number q ranging from 2π/L to 10π/L; i.e., we have restricted our analysis to first five cosine modes [35]. Eigenvalues of this matrix denote the renormalized stiffness κrenorm of the system. We plot the κrenorm as a function of the mode number for C0 =0 and C0(x0/2) =0.04 1/nm, where x0 =60 nm. The inset depicts the ratio of κrenorm when C0 =0.04 to κrenorm when C0 =0.0. In generating these plots, we have employed L=250 nm, x0 =60 nm, and σ=0 N/m.
As discussed by Kozlov [26], many previous analyses accounting only for the membrane energy have showed that in the biologically relevant cases, deformation related forces are repulsive and should in fact prevent—rather than promote—the formation of protein domains. Moreover, Kozlov postulates that the restriction of undulation (i.e., the reduction in quasiharmonic entropy) by curvature-inducing proteins could lead to attractive forces favoring the formation of protein domains. We note that for the systems we have explored, we have quantified the free-energy changes (and the entropic effects) and conclude that even though the contribution of the entropic effects |TΔS| to the overall change in the bending free energy is small (~5%), the entropic effects are comparable in magnitude to a few kBT. Hence, as postulated by Kozlov [26], such forces can indeed provide the basis for the formation of protein domains which are ubiquitous in intra-cellular signaling and trafficking mechanisms.
Acknowledgments
We acknowledge funding from the National Science Foundation through Grants No. CBET-0730955 and No. CBET-853389 and from the National Institutes of Health through Grant No. 1R01EB006818. Computational resources were provided in part by the National Partnership for Advanced Computational Infrastructure under Grant No. MCB060006.
APPENDIX A: CHANGE OF REFERENCE STATE
F is the free energy as defined by the partition function,
| (A1) |
where the energy is defined in Eq. (2). Hence, the system entropy can be written as
| (A2) |
Since we are interested in the deformation free energy with reference to H0 =0, we define the membrane deformation energy with this reference state as
| (A3) |
Hence, the ensemble average of the deformation energy is given by
| (A4) |
〈E0〉 accounts for the energy required to deform the membrane from a planar state to a curved state and the energy contribution due to thermal fluctuations around a reference state of nonzero H0. Adding the entropic contributions to 〈E0〉 gives the deformation free energy with respect to nonzero H0,
| (A5) |
Using Eq. (A2), we get
| (A6) |
APPENDIX B: MOBILITY TERM M
For a membrane fluctuating in an infinite surrounding fluid, the membrane dynamics can be expressed as [16]
| (B1) |
where Λ(r-r′) =1/8πη|r-r′|is the diagonal part of the Oseen tensor [33] and η is the viscosity of the surrounding fluid. Using the membrane Hamiltonian for a planar membrane (with zero-spontaneous curvature),
| (B2) |
Lin and Brown [16] showed that the normalized membrane height autocorrelation obeys
| (B3) |
where k=(m,n)2π/L is the wave vector and τk is the characteristic decay time of kth mode and is given by
| (B4) |
The values of wave vector are restricted by −N/2<m,n ≤ N/2, where N is the number of grids along each direction. For the membrane dynamics given by
| (B5) |
where M is the scalar mobility term, the normalized membrane height autocorrelation follows:
| (B6) |
Ωk is the characteristic decay time of kth mode and is given by
| (B7) |
We fit M such that the autocorrelation given by Eq. (B6) matches with that of Eq. (B3) (see Fig. 8). We find that M =2.5×10⁻⁶ m2 s/kg yields a good agreement between the membrane height autocorrelation predicted by Eqs. (B3) and (B6).
APPENDIX C: LINEAR STABILITY ANALYSIS
We integrate the TDGL equation numerically using the explicit Euler scheme. The upper bound on the time integration step is dictated by the problem and the spatial grid size so as to ensure numerical stability of the explicit scheme, i.e., boundedness of the numerical solution. We use the matrix method [31] to find a δt, which leads to bounded solution when membrane is discretized in spatial units of length h. We can write the discretized equation for each spatial grid point as
| (C1) |
where the subscript refers to the spatial grid and superscript refers to the temporal step. g(Hj) is the nonhomogeneous part of TDGL, which arises from the ∇2H term. We can write this equation in the matrix form as
| (C2) |
i.e.,
| (C3) |
The matrix A is dependent on h, δt, and the specific problem and is referred to as the amplification matrix. The eigenvalues of this matrix A dictate the numerical stability of the scheme as outlined in Ref. [31]. We note that the solution at (n+1)th step is
| (C4) |
Replacing in diagonal form using the eigenvector matrix v and eigenvalue matrix λ, i.e.,
| (C5) |
we get
| (C6) |
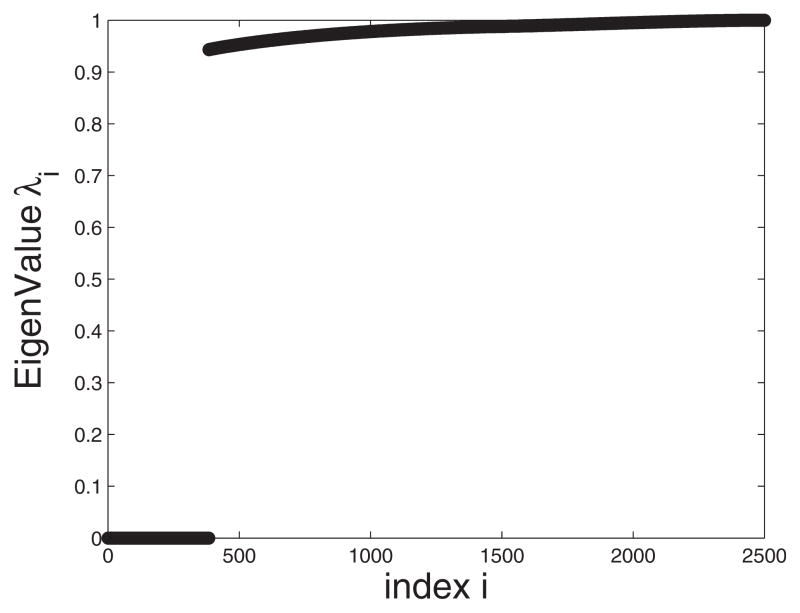
For numerical stability, each of the eigenvalue λi of the matrix A should be bounded by [−1,1]; more specifically, they should obey 0≤λi ≤1 for steady-bounded decay and −1 ≤λi ≤0 for oscillatory-bounded decay. For all other values of λi, the solution diverges. Decreasing the step size h reduces the allowed value of δt. In Fig. 9, we plot the eigenvalues for the integration time step δt=1 ps showing that all the eigenvalues are less than one.
FIG. 9.
Eigenvalue spectrum for system II. We have employed h=5 nm and δt=1×10⁻¹² s.
References
- 1.McMahon HT, Gallop JL. Nature (London) 2005;438:590. doi: 10.1038/nature04396. [DOI] [PubMed] [Google Scholar]
- 2.Zimmerberg J, Kozlov MM. Nat Rev Mol Cell Biol. 2006;7:9. doi: 10.1038/nrm1784. [DOI] [PubMed] [Google Scholar]
- 3.Oved S, Yarden Y. Nature (London) 2002;416:133. doi: 10.1038/416133a. [DOI] [PubMed] [Google Scholar]
- 4.Schmidt AA. Nature (London) 2002;419:347. doi: 10.1038/419347a. [DOI] [PubMed] [Google Scholar]
- 5.Kirchhausen T. Nat Rev Mol Cell Biol. 2000;1:187. doi: 10.1038/35043117. [DOI] [PubMed] [Google Scholar]
- 6.Chou T, Kim KS, Oster G. Biophys J. 2001;80:1075. doi: 10.1016/S0006-3495(01)76086-9. [DOI] [PMC free article] [PubMed] [Google Scholar]
- 7.Reynwar BJ, et al. Nature (London) 2007;447:461. doi: 10.1038/nature05840. [DOI] [PubMed] [Google Scholar]
- 8.Lee SJE, et al. Trends Immunol. 2002;23:500. doi: 10.1016/s1471-4906(02)02325-6. [DOI] [PubMed] [Google Scholar]
- 9.Marrink SJ, deVries AH, Mark AE. J Phys Chem B. 2004;108:750. [Google Scholar]
- 10.Groves JT. Annu Rev Phys Chem. 2007;58:697. doi: 10.1146/annurev.physchem.56.092503.141216. [DOI] [PubMed] [Google Scholar]
- 11.Neto JC, et al. Biophys J. 2006;91:1108. [Google Scholar]
- 12.Seifert U, Berndl K, Lipowsky R. Phys Rev A. 1991;44:1182. doi: 10.1103/physreva.44.1182. [DOI] [PubMed] [Google Scholar]
- 13.Blood PD, Voth GA. Proc Natl Acad Sci USA. 2006;103:15068. doi: 10.1073/pnas.0603917103. [DOI] [PMC free article] [PubMed] [Google Scholar]
- 14.Nelson DR, Piran T, Weinberg S. Statistical Mechanics of Membranes and Surfaces. World Scientific; River Edge, NJ: 2004. [Google Scholar]
- 15.Safran SA. Statistical Thermodynamics of Surfaces, Interfaces, and Membranes. Addison-Wesley; Reading, MA: 1994. [Google Scholar]
- 16.Lawrence C-L, Lin, Brown FLH. Phys Rev E. 2005;72:011910. doi: 10.1103/PhysRevE.72.011910. [DOI] [PubMed] [Google Scholar]
- 17.Reister-Gottfried E, Leitenberger SM, Seifert U. Phys Rev E. 2007;75:011908. doi: 10.1103/PhysRevE.75.011908. [DOI] [PubMed] [Google Scholar]
- 18.Wallace EJ, Hooper NM, Olmsted PD. Biophys J. 2005;88:4072. doi: 10.1529/biophysj.104.054288. [DOI] [PMC free article] [PubMed] [Google Scholar]
- 19.Dan N, et al. J Phys II. 1994;4:1713. [Google Scholar]
- 20.Weikl TR. Europhys Lett. 2001;54:547. [Google Scholar]
- 21.Helfrich W. Z Naturforsch C. 1973;28:693. doi: 10.1515/znc-1973-11-1209. [DOI] [PubMed] [Google Scholar]
- 22.Agrawal NJ, Weinstein J, Radhakrishnan R. Mol Phys. 2008;106:1913. doi: 10.1080/00268970802365990. [DOI] [PMC free article] [PubMed] [Google Scholar]
- 23.Veksler A, Gov NS. Biophys J. 2007;93:3798. doi: 10.1529/biophysj.107.113282. [DOI] [PMC free article] [PubMed] [Google Scholar]
- 24.Brochard F, Lennon JF. J Phys (France) 1975;36:1035. [Google Scholar]
- 25.Divet F, Danker G, Misbah C. Phys Rev E. 2005;72:041901. doi: 10.1103/PhysRevE.72.041901. [DOI] [PubMed] [Google Scholar]
- 26.Kozlov MM. Nature (London) 2007;447:387. doi: 10.1038/447387a. [DOI] [PubMed] [Google Scholar]
- 27.Frenkel D, Smit B. Understanding Molecular Simulations: From Algorithms to Applications. Academic Press; San Diego, CA: 1996. [Google Scholar]
- 28.Allen MP, Tildesley DJ. Computer Simulation of Liquids. Oxford Science; Oxford: 1987. [Google Scholar]
- 29.Lennon EM, Katsov K, Fredrickson GH. Phys Rev Lett. 2008;101:138302. doi: 10.1103/PhysRevLett.101.138302. [DOI] [PubMed] [Google Scholar]
- 30.Agrawal NJ, et al. (unpublished) [Google Scholar]
- 31.Hoffman JD. Numerical Methods for Engineers and Scientists. McGraw-Hill; New York: 1992. [Google Scholar]
- 32.Lawrence C-L, Lin, Brown FLH. J Chem Theory Comput. 2006;2:472. doi: 10.1021/ct050293s. [DOI] [PubMed] [Google Scholar]
- 33.Doi M. Introduction to Polymer Physics. Clarendon Press; Oxford: 1996. [Google Scholar]
- 34.Lawrenz M, Baron R, McCammon JA. J Chem Theory Comput. 2009;5:1106. doi: 10.1021/ct800559d. [DOI] [PMC free article] [PubMed] [Google Scholar]
- 35.See EPAPS Document No. E-PLEEE8-80-163907 for additional information on Sec. III B. For more information on EPAPS, see http://www.aip.org/pubservs/epaps.html.


