

Abstract
Background
The vasculature and neural system of the inner ear may be affected by diabetes.
Objective
To determine whether hearing impairment is more prevalent among U.S. adults with diabetes than among those without diabetes.
Design
Cross-sectional analysis of nationally representative data.
Setting
National Health and Nutrition Examination Survey, 1999–2004.
Participants
5140 non-institutionalized adults aged 20–69 years who underwent audiometric testing.
Measurements
Hearing impairment assessed from the pure tone average of thresholds over low/mid frequencies (500, 1000, 2000 Hz) and high frequencies (3000, 4000, 6000, 8000 Hz), and defined for mild or greater severity (pure tone average > 25 decibels hearing level (dB HL)) and moderate or greater severity (pure tone average > 40 dB HL).
Results
For low/mid frequency hearing impairment of mild or greater severity assessed in the worse ear, age-adjusted prevalence estimates (95% confidence limits) were 21.3% (15.0, 27.5) among 399 adults with diabetes and 9.4% (8.2, 10.5) among 4741 adults without diabetes. For high frequency hearing impairment of mild or greater severity assessed in the worse ear, age-adjusted prevalence estimates were 54.1% (45.9, 62.3) among those with diabetes and 32.0% (30.5, 33.5) among those without. Adjusted odds ratios (95% confidence limits) of 1.82 (1.27, 2.60) and 2.16 (1.47, 3.18) for the low/mid frequency and high frequency impairments, respectively, indicated that differences in socio-demographic characteristics, noise exposure, ototoxic medication use, and smoking did not account for the association between diabetes and hearing impairment.
Limitations
Diagnosed diabetes was based on self-report and does not distinguish between type 1 and type 2 diabetes. Noise exposure assessments were based on participant recall.
Conclusion
Adults with diabetes have a higher occurrence of hearing impairment than those without diabetes. Screening for this problem would allow for interventions to improve hearing.
Hearing loss, reported by over 17% of the United States adult population, is a major public health concern affecting over 36 million people (1). Risk of developing hearing impairment is associated with male sex, lower education, industrial or military occupation, and leisure time noise exposure (2–4), and prevalent hearing impairment has been correlated with smoking (5). Prevalence varies substantially by age, sex, and race, and estimates exceed 30% among those aged 65 and older (1). In one community-based study, 46% of the population aged 43–84 years was classified as hearing-impaired based on audiometric examination (6). These high prevalence estimates imply that a large number of people are at risk of functional and psychosocial limitations associated with hearing impairment (7, 8).
Diabetes mellitus affects an estimated 9.6% of the U.S. adult population (9, 10) and is associated with microvascular and neuropathic complications affecting the retina, kidney, peripheral arteries, and peripheral nerves (11). The pathologic changes that accompany diabetes could plausibly cause injury to the vasculature or the neural system of the inner ear resulting in sensorineural hearing impairment. Evidence of such pathology, including sclerosis of the internal auditory artery, thickened capillaries of the stria vascularis, atrophy of the spiral ganglion, and demyelination of the eighth cranial nerve, has been described among autopsied patients with diabetes (12, 13). Clinical evidence supporting an association between diabetes and hearing impairment has been limited to several small studies (14–18) or noise-exposed samples (19). Epidemiological evidence from one population-based cohort study suggested a modest association (20). The objective of the present study was to use recent national survey data to examine the relationship between diabetes and hearing impairment. Specifically, this analysis was designed to determine 1) whether hearing impairment is more prevalent among United States adults who report a diagnosis of diabetes than among those who report no diagnosis of diabetes, and 2) whether differences in prevalence by diabetes status occur predominantly in specific U.S. population subgroups.
Methods
Participants
Data for the study come from the National Health and Nutrition Examination Survey (NHANES) collected by the National Center for Health Statistics (NCHS) during 1999–2004 which used a complex, multi-stage, probability sample designed to be representative of the civilian, non-institutionalized U.S. population. One half of the 11,405 study participants aged 20–69 were randomly assigned to audiometric testing. Of the 5742 assigned, 5140 (89.5%) completed the audiometric examination and the diabetes questionnaire and are included in this analysis. Major reasons for not completing an exam included time limitation (n=128, 2.2%), physical limitation (n=60, 1.0%), communication problem (n=42, 0.7%), refusal (n=81, 1.4%), and equipment failure (n=47, 0.8%). Included among the 60 participants with a physical limitation are an unknown number who were not tested due to an inability to remove their hearing aids, seven of whom reported diabetes.
Measures
As part of the NHANES survey, pure tone air conduction hearing thresholds were obtained for each ear at frequencies of 500, 1000, 2000, 3000, 4000, 6000, and 8000 Hz. Higher frequencies are perceived as higher pitches. Audiologists usually consider tones ≤ 500 Hz to be low frequency, tones from 1000–2000 Hz to be of mid-range frequency and tones ≥ 3000 Hz to be high frequency. The measurements were collected by trained audiometric technicians using a calibrated audiometer that met accepted standards (see Technical Appendix).
We derived measures of hearing impairment for two categories of frequency (low/mid and high) and of severity (mild or greater, and moderate or greater). To produce low/mid frequency pure tone averages, we averaged pure tone thresholds (the signal intensities needed to perceive the tones) measured at 500, 1000, and 2000 Hz (21) for each individual and ear, and to produce high frequency pure tone averages, we averaged pure tone thresholds measured at 3000, 4000, 6000, and 8000 Hz (22, 23) for each individual and ear. For each frequency range, a pure tone average greater than 25 decibels hearing level (dB HL) defined hearing impairment of mild or greater severity, while a pure tone average greater than 40 dB HL defined hearing impairment of moderate or greater severity (24). For each combination of frequency range and severity, we defined hearing impairment in terms of the pure tone average in the worse ear, which designates persons with impairment in at least one ear. We also defined hearing impairment in terms of the better ear, which designates persons with impairment in both ears, who are a subset of the persons impaired in at least one ear. Functional descriptions of hearing impairment by frequency range and severity are presented in Table 1. In addition, we classified participants as having self-reported hearing impairment if they reported having a little trouble, a lot of trouble, or being deaf without a hearing aid (1).
Table 1.
Functional Description of Hearing Impairment by Severity of Impairment and Frequency Range.
| Severity of Impairment | ||
|---|---|---|
| Pure tone average >25–40 dB HL | Pure tone average > 40 dB HL | |
| Low/mid frequency | Slight difficulty with understanding speech in ideal listening conditions | Considerable difficulty with understanding speech in ideal listening conditions |
| High frequency | Slight difficulty with understanding speech in unfavorable listening conditions | Considerable difficulty with understanding speech in unfavorable listening conditions |
Among the 5140 participants, twenty-four participants were coded by NCHS with at least one audiometric non-response (i.e. participants did not perceive the pure tone at any level of intensity). We classified these cases as impaired for a frequency range if the audiometric non-response occurred within the range. An examination of these participants’ available pure tone thresholds corroborated their classification as impaired at both levels of severity.
Information on demographic characteristics, diagnosed diabetes, noise exposure, medication use, and smoking was obtained during in-home interviews. Education was assessed as the highest grade level or degree attained. Income-to-poverty ratio was defined as the ratio of reported total family income to the U.S. Census bureau poverty threshold which varies by family size and age of family members. Diagnosed diabetes was assessed with the question “other than during pregnancy (for women), have you ever been told by a doctor or health professional that you have diabetes or sugar diabetes?” Of the 5140 participants, 2259 received an additional random assignment to a fasting protocol and subsequent blood draw. Of the 2259 participants, 146 reported a diagnosis of diabetes. Of the remainder, 73 participants were classified as having undiagnosed diabetes (fasting plasma glucose ≥126 mg/dL) and 539 were classified as having impaired fasting glucose (fasting plasma glucose ≥100 mg/dL and <126 mg/dL). The remaining 1501 were defined as normoglycemic. Occupational noise exposure was defined as reporting a history of loud noise at work that required speaking in a loud voice to be heard. Leisure time noise exposure was based on participant recall of noise from firearms (outside of work) or other sources (such as loud music or power tools) for an average of at least once per month for a year. History of military service was determined from a question asking about ever having served in the Armed Forces of the United States. Use of ototoxic medications was assessed by a review of medication containers. Because the small proportion of adults reporting use of aminoglycoside antibiotics (0.03%), loop diuretics (1.5%), antineoplastic drugs (5.0%), and non-steroidal anti-inflammatory drugs (7.3%) precluded analysis of these medications individually, we defined use of ototoxic medication as use in the past 30 days of any of these four drug classes.
Statistical Analysis
Differences in the distribution of socio-demographic characteristics, military history, noise exposure (leisure time and occupational), ototoxic medication use, smoking, and diagnosed diabetes were tested with the t-test (for continuous characteristics) or chi-square test (for categorical characteristics). Unadjusted prevalence estimates (and 95% confidence limits) for the hearing impairment outcomes were assessed by diagnosed diabetes status. Prevalence estimates were additionally stratified by socio-demographic characteristics, military history, leisure time noise exposure, occupational noise exposure, ototoxic medication use, and smoking to identify population subgroups which may be particularly vulnerable to diabetes-related hearing impairment. Age-adjusted prevalence estimates were computed by direct standardization to the 2000 United States census population using age categories of 20–49, 50–59, and 60–69 years. Statistical significance of unadjusted estimates was determined from chi-square statistics for a general association, and that of age-adjusted estimates was determined from the Cochran-Mantel-Haenszel chi-square test. For the 2259 who had been randomized to the fasting protocol, age-adjusted prevalence estimates of high frequency hearing impairment were generated by glycemic status (diagnosed diabetes, undiagnosed diabetes, impaired fasting glucose, or normoglycemic). Odds ratios (with 95% confidence limits) for the independent association of diabetes with hearing impairment were estimated using multiple logistic regression models, adjusting for age, sex, race/ethnicity, education, income to poverty ratio, leisure time noise exposure, occupational noise exposure, history of military service, use of ototoxic medications, and smoking. Age was treated as a continuous variable in all regression models. Non-linear effects of age on the logit of each outcome were examined by testing the addition of an age squared term to each model but were not statistically significant. Predictive accuracy was assessed by the concordance index, which ranged from 80 to 90% for each of the 8 audiometrically-assessed outcomes and which was 72% for self-reported hearing impairment. Six of the nine models passed the Hosmer-Lemeshow goodness of fit tests. Finally, the frequency-specific pure tone thresholds were examined graphically, by averaging within-person thresholds over both ears, and plotting the age-adjusted and age-specific mean thresholds stratified by diagnosed diabetes status.
Analyses were performed using SAS version 9.1 (SAS Institute, Inc, Cary, NC) and SUDAAN version 9.0.1 (Research Triangle Institute, Research Triangle Park, NC) incorporating sample weights which were adjusted for 1) over-sampling of ethnic minorities, the elderly, and those of low income, 2) eligibility of half of the sample for audiometric testing, and 3) the non-response of eligible individuals who were not tested. Six-year audiometric sample weights were computed by assigning two-thirds of the four-year audiometric weight (WTSAU4YR) for persons sampled in 1999–2002 and one-third of the two-year audiometric weight (WTSAU2YR) for persons sampled in 2003–2004.
Role of the Funding Source
The U.S. Department of Health and Human Services is the funding source for NHANES and oversees the conduct and reporting of the NHANES surveys.
Results
Table 2 shows characteristics of the U.S. population stratified by low/mid frequency hearing impairment of mild or greater severity assessed in the worse ear. People with hearing impairment were older by an average of thirteen years, more likely to be non-Hispanic White and to have attained less than a high school level of education. People with hearing impairment were also more likely to report having served in the military, occupational noise exposure, and the use of ototoxic medications. The effects of military history and ototoxic medications were due to the older age of those with these characteristics. People with hearing impairment were not more likely to report an income to poverty ratio of ≤1, leisure time noise exposure or current smoking, although associations with income to poverty ratio and leisure time noise exposure are observed when correcting for age. Finally, people with hearing impairment were more likely to report diabetes, an effect not explained by age in preliminary analyses. All other characteristics were associated with diagnosed diabetes in preliminary analyses (data not shown), suggesting they should be treated as potential confounders when assessing the potential relationship between hearing impairment and diabetes.
Table 2.
Characteristics of the U.S. Population Age 20–69 Years by Low/Mid Frequency Hearing Impairment of Mild or Greater Severity Assessed in the Worse Ear* — NHANES 1999–2004 (n=5140).
| Hearing Impaired (n = 587) | Not Hearing Impaired (n = 4553) | p-value | |
|---|---|---|---|
| Age, years (mean (sd)) | 53.2 (1998) | 40.6 (2305) | <0.001 |
| Race/Ethnicity (%) | |||
| Non-Hispanic White | 75.8 | 69.7 | |
| Non-Hispanic Black | 7.6 | 12.0 | |
| Mexican American | 4.8 | 8.3 | |
| Other race including multiracial | 11.8 | 10.0 | <0.001 |
| Sex (%) | |||
| Male | 53.8 | 48.3 | |
| Female | 46.2 | 51.7 | 0.065 |
| Education (%) | |||
| < High school | 27.3 | 17.2 | |
| High school | 27.6 | 25.0 | |
| > High school | 45.1 | 57.8 | <0.001 |
| Income to Poverty Ratio (%) | |||
| ≤1.0 | 16.5 | 13.9 | |
| >1.0 | 83.5 | 86.1 | 0.23 |
| History of Military Service (%) | 20.4 | 11.5 | <0.001 |
| Leisure Time Noise Exposure (%) | 31.1 | 29.0 | 0.43 |
| Occupational Noise Exposure (%) | 39.7 | 33.8 | 0.033 |
| Ototoxic Drug Use (%) | 21.0 | 11.7 | 0.001 |
| Current smoker (%) | 27.8 | 28.3 | 0.81 |
| Diagnosed Diabetes (%) | 16.6 | 4.8 | <0.001 |
Hearing impairment defined as having a pure tone average >25 dB HL of thresholds averaged over 500, 1000, 2000 Hz.
Unadjusted and age-adjusted prevalence estimates of hearing impairment in the U.S. are presented by diagnosed diabetes status in Table 3. The unadjusted prevalence estimates for all nine outcomes were statistically higher among the individuals with diabetes compared to the individuals without diabetes. Differences in prevalence were attenuated but remained statistically significant after adjustment for age.
Table 3.
Prevalence of Hearing Impairment in U.S. Adults Age 20–69 years by Diagnosed Diabetes Status—NHANES 1999–2004 (n=5140).
| Prevalence, % (95% Confidence Limits) | Age-adjusted† Prevalence, % (95%Confidence Limits) | ||||||
|---|---|---|---|---|---|---|---|
| Hearing Impairment | n | Diabetes (n=399) |
No Diabetes (n=4741) |
p-value | Diabetes (n=399) |
No Diabetes (n= 4741) |
p-value |
| Worse ear | |||||||
| Mild or greater severity (PTA>25 dB HL) | |||||||
| Low/mid frequency | 587 | 28.0 (22.7, 33.3) | 9.0 (7.9, 10.1) | <0.001 | 21.3 (15.0, 27.5) | 9.4 (8.2, 10.5) | <0.001 |
| High frequency | 1787 | 67.8 (62.0, 73.5) | 31.1 (29.5, 32.8) | <0.001 | 54.1 (45.9, 62.3) | 32.0 (30.5, 33.5) | <0.001 |
| Moderate or greater severity (PTA >40 dB HL) | |||||||
| Low/mid frequency | 185 | 9.3 (6.0, 12.6) | 2.5 (1.9, 3.1) | <0.001 | 4.7 (2.9, 6.5) | 2.6 (2.0, 3.2) | 0.011 |
| High frequency | 953 | 45.6 (39.8, 51.4) | 15.8 (14.5, 17.2) | <0.001 | 37.0 (27.9, 46.2) | 16.5 (15.2, 17.7) | <0.001 |
| Better ear | |||||||
| Mild or greater severity (PTA> 25 dB HL) | |||||||
| Low/mid frequency | 252 | 12.6 (8.7, 16.5) | 3.4 (2.7, 4.0) | <0.001 | 8.4 (4.3, 12.6) | 3.5 (2.9, 4.2) | 0.006 |
| High frequency | 1194 | 54.0 (47.9, 60.2) | 19.4 (18.0, 20.7) | <0.001 | 41.1 (33.5, 48.6) | 20.1 (18.9, 21.3) | <0.001 |
| Moderate or greater severity (PTA >40 dB HL) | |||||||
| Low/mid frequency | 55 | 3.3 (1.4, 5.2) | 0.6 (0.3, 0.8) | 0.008 | 1.5 (0.6, 2.4) | 0.6 (0.3, 0.8) | 0.014 |
| High frequency | 561 | 27.1 (22.4, 31.8) | 8.7 (7.7, 9.8) | <0.001 | 18.3 (13.2, 23.4) | 9.2 (8.3, 10.1) | 0.002 |
| Self-reported | 1087 | 42.3 (36.5, 48.0) | 21.5 (20.0, 23.0) | <0.001 | 38.9 (30.1, 47.7) | 21.7 (20.2, 23.2) | <0.001 |
PTA=Pure tone average threshold
Age-adjusted to 2000 US Census
Age-adjusted mean pure tone thresholds (averaged first within participants over both ears) are presented by diagnosed diabetes status (Figure 1a). Persons with diabetes had higher thresholds at all frequencies than persons without diabetes, and the difference appeared to widen at frequencies greater than 2000 Hz. While these curves represent population-averages, two individuals with these profiles would have clinically significant differences in hearing impairment. Age-specific analyses (Figures 1b–1f) demonstrate the consistency of higher pure tone thresholds across the entire frequency range and across all age groups, for people with diabetes. The curve for people with diabetes aged 20–29 years (Figure 1b) should be interpreted with caution as it is based on only ten people (most of whom likely have type 1 diabetes), and because an examination of the age distribution within this age group suggests there is an age difference between those with diabetes and those without.
Figure 1.
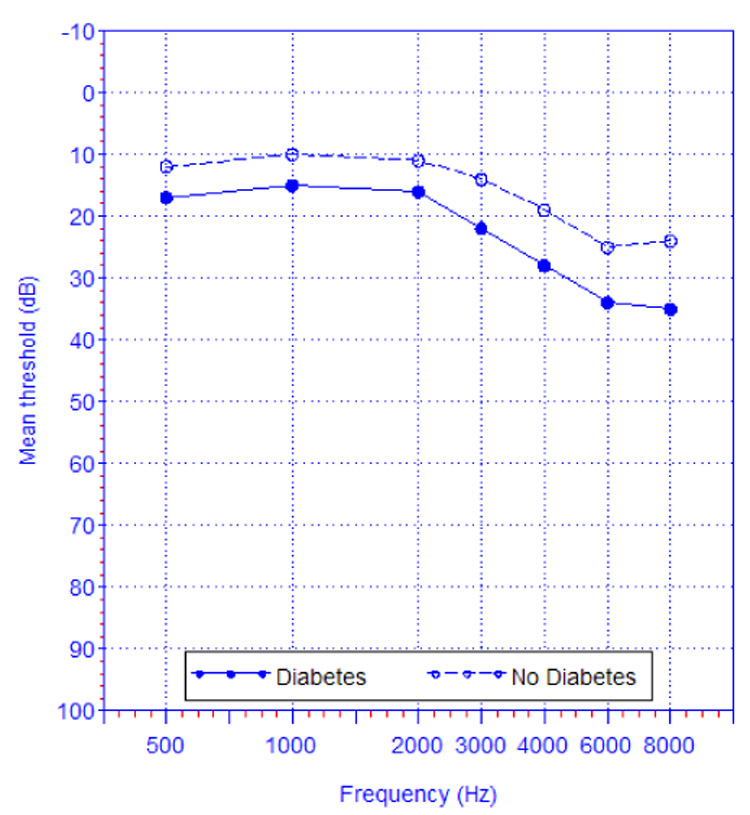


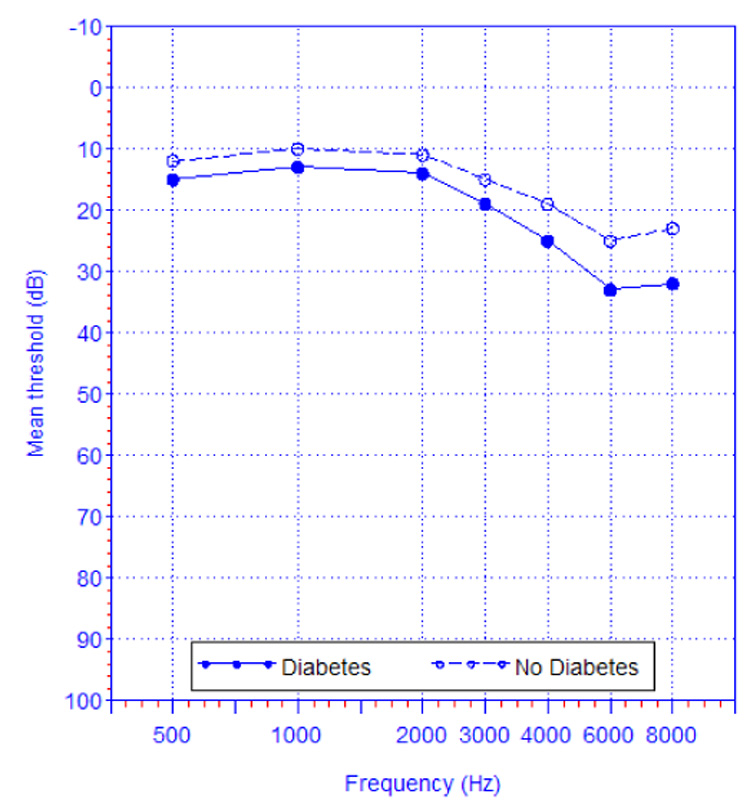

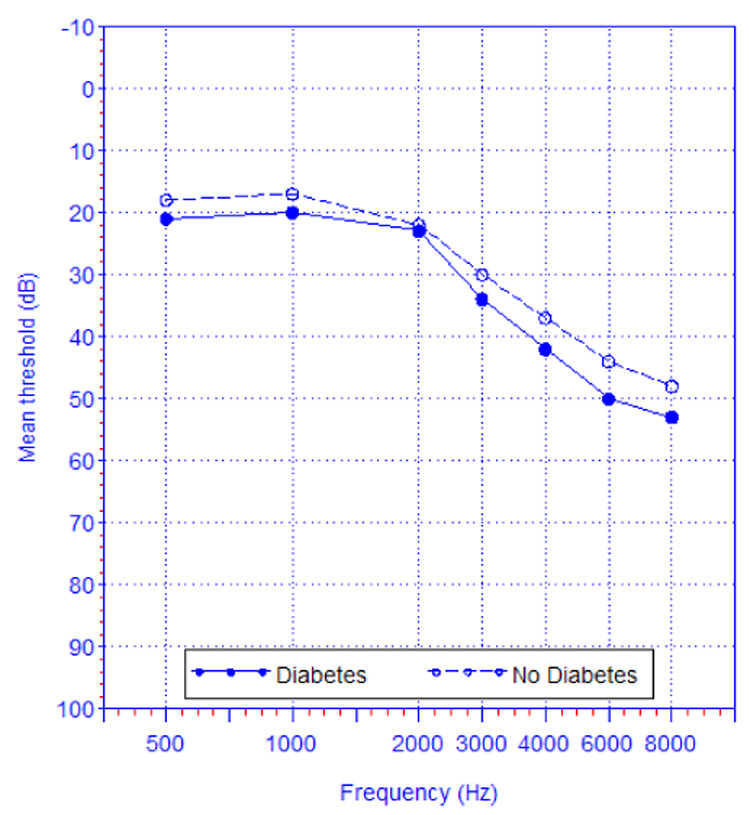
Figure 1a. Mean of the within-person pure tone thresholds (averaged over both ears) by diagnosed diabetes status, among U.S. adults age 20–69 years, age-adjusted to the 2000 US Census,—NHANES 1999–2004 (n=5140).
Figure 1b. Mean of the within-person pure tone thresholds (averaged over both ears) by diagnosed diabetes status, among U.S. adults age 20–29 years*,—NHANES 1999–2004 (n=1209).
* Curve representing persons with diabetes is based on n=10 and should be interpreted with caution.
Figure 1c. Mean of the within-person pure tone thresholds (averaged over both ears) by diagnosed diabetes status, among U.S. adults age 30–39 years, —NHANES 1999–2004 (n=1084).
Figure 1d. Mean of the within-person pure tone thresholds (averaged over both ears) by diagnosed diabetes status, among U.S. adults age 40–49 years, —NHANES 1999–2004 (n=1036).
Figure 1e. Mean of the within-person pure tone thresholds (averaged over both ears) by diagnosed diabetes status, among U.S. adults age 50–59 years, —NHANES 1999–2004 (n=838).
Figure 1f. Mean of the within-person pure tone thresholds (averaged over both ears) by diagnosed diabetes status, among U.S. adults age 60–69 years, —NHANES 1999–2004 (n=973).
The prevalence of low/mid frequency hearing impairment of mild or greater severity assessed in the worse ear in specific subgroups is presented in Table 4. The prevalence of hearing impairment among people with diagnosed diabetes statistically exceeded the prevalence among those without diabetes in all groups except those aged 60–69 years. Statistically significant differences by diabetes status remained after age adjustment within most subgroups. Appendix Table 4b–Appendix Table 4i show the results for the other audiometric outcomes and self-reported hearing impairment. Findings were similar for all four high frequency hearing impairment outcomes (Appendix Table 4b, Appendix Table 4d, Appendix Table 4f, and Appendix Table 4h). The low prevalence of low/mid frequency hearing impairment of moderate or greater severity assessed in the worse ear (Appendix Table 4c) or better ear (Appendix Table 4g) resulted in insufficient statistical power to detect statistically significant differences in subgroup-specific prevalence by diabetes status.
Table 4.
Prevalence of Low/mid Frequency Hearing Impairment of Mild or Greater Severity Assessed in the Worse Ear * in U.S. adults Age 20–69 Years by Diagnosed Diabetes Status and Socio-demographic Characteristics—NHANES 1999–2004 (n=5140)
| Prevalence | Age-Adjusted† Prevalence | |||||||
|---|---|---|---|---|---|---|---|---|
| Diabetes (n=399) |
No Diabetes (n=4741) |
Diabetes (n=399) |
No Diabetes (n=4741) |
|||||
| n‡ | Prevalence, % (95% CI) |
n‡ | Prevalence, % (95% CI) |
p-value | Prevalence, % (95% CI) |
Prevalence, % (95% CI) |
p-value | |
| Age, years | ||||||||
| 20–49 | 97 | 16.1 (7.7, 24.5) | 3232 | 4.7 (3.8, 5.6) | 0.019 | - | - | |
| 50–59 | 111 | 32.3 (21.5, 43.2) | 727 | 14.2 (10.8, 17.5) | 0.004 | - | - | |
| 60–69 | 191 | 36.0 (26.9, 45.1) | 782 | 30.4 (25.9, 34.8) | 0.30 | - | - | |
| Race/Ethnicity | ||||||||
| Non-Hispanic White | 139 | 27.8 (21.8, 33.7) | 2311 | 10.0 (8.6, 11.5) | <0.001 | 19.5 (10.3, 28.6) | 9.8 (8.5, 11.1) | 0.007 |
| Non-Hispanic Black | 97 | 18.1 (11.0, 25.2) | 956 | 5.8 (4.2, 7.5) | 0.010 | 10.7 (4.1, 17.4) | 6.8 (4.9, 8.8) | 0.158 |
| Mexican American | 118 | 17.2 (10.8, 23.6) | 1090 | 5.5 (4.3, 6.6) | 0.002 | 8.5 (5.8, 11.1) | 8.1 (6.6, 9.7) | 0.25 |
| Other | 45 | 42.6 (26.4, 58.7) | 384 | 8.4 (4.8, 12.0) | 0.002 | 40.3 (19.3, 61.3) | 9.6 (6.0, 13.2) | 0.007 |
| Sex | ||||||||
| Male | 192 | 27.2 (19.6, 34.8) | 2223 | 10.1 (8.5, 11.7) | <0.001 | 22.9 (13.7, 32.0) | 10.8 (9.2, 12.3) | 0.050 |
| Female | 207 | 28.9 (19.6, 38.2) | 2518 | 8.0 (6.6, 9.4) | <0.001 | 19.0 (9.7, 28.3) | 8.2 (6.8, 9.5) | 0.005 |
| Education | ||||||||
| < High school | 166 | 39.4 (28.3, 50.4) | 1323 | 12.8 (9.9, 15.6) | <0.001 | 31.9 (20.0, 43.9) | 12.1 (9.8, 14.4) | 0.020 |
| High school | 91 | 25.5 (13.5, 37.4) | 1090 | 10.2 (8.1, 12.2) | 0.026 | 18.5 (5.8, 31.1) | 10.5 (8.4, 12.6) | 0.22 |
| > High school | 142 | 22.6 (14.7, 30.5) | 2326 | 7.4 (6.1, 8.7) | 0.002 | 17.0 (8.2, 25.8) | 7.9 (6.5, 9.2) | 0.020 |
| Income to Poverty Ratio | ||||||||
| <=1 | 88 | 31.3 (20.1,42.5) | 796 | 9.7 (6.9, 12.5) | 0.003 | 24.6 (11.4, 37.8) | 12.7 (9.4, 15.9) | 0.08 |
| >1.0 | 273 | 25.2 (18.8, 31.5) | 3535 | 8.6 (7.3, 9.9) | <0.001 | 18.1 (10.5, 25.7) | 8.8 (7.6, 10.0) | 0.006 |
| Military History | ||||||||
| Yes | 68 | 36.2 (23.0, 49.4) | 517 | 14.4 (11.0, 17.8) | 0.005 | 30.1 (6.3, 54.0) | 9.9 (7.2, 12.6) | 0.073 |
| No | 330 | 25.7 (19.9, 31.5) | 4224 | 8.3 (7.2, 9.4) | <0.001 | 19.6 (13.7, 25.5) | 9.2 (8.1, 10.3) | <0.001 |
| Leisure time noise exposure | ||||||||
| Yes | 87 | 32.2 (23.0, 41.4) | 1227 | 9.6 (7.8, 11.4) | <0.001 | 25.3 (12.9, 37.6) | 11.5 (9.6, 13.4) | 0.020 |
| No | 312 | 26.5 (20.8, 32.2) | 3511 | 8.8 (7.3, 10.3) | <0.001 | 20.1 (13.5, 26.3) | 8.6 (7.2, 10.0) | 0.002 |
| Occupational noise exposure | ||||||||
| Yes | 117 | 29.7 (21.4, 37.9) | 1475 | 10.3 (8.6, 12.1) | 0.001 | 24.3 (15.1, 33.5) | 11.2 (9.6, 12.8) | 0.018 |
| No | 254 | 26.9(19.5, 34.3) | 3048 | 8.1 (6.7, 9.5) | <0.001 | 17.7 (9.7, 25.7) | 8.3 (7.0, 9.7) | 0.005 |
| Ototoxic medication use | ||||||||
| Yes | 101 | 38.1 (27.1, 49.1) | 514 | 14.0 (9.7, 18.2) | <0.001 | 17.3 (8.8, 25.7) | 11.1 (7.6, 14.5) | 0.001 |
| No | 298 | 24.6 (18.2, 30.9) | 4227 | 8.4 (7.3, 9.4) | <0.001 | 21.1 (13.5, 28.6) | 9.2 (8.1, 10.3) | 0.009 |
| Current smoker | ||||||||
| Yes | 94 | 32.2 (21.7, 42.8) | 1251 | 8.8 (7.3, 10.3) | <0.001 | 28.9 (17.3, 40.5) | 10.0 (8.3, 11.7) | 0.005 |
| No | 305 | 26.6 (19.9, 33.3) | 3485 | 9.1 (7.7, 10.5) | <0.001 | 17.7 (9.9, 25.4) | 9.0 (7.7, 10.3) | 0.013 |
CI=Confidence Interval
Hearing impairment defined as pure tone average >25 dB HL of thresholds assessed at 500, 1000, 2000 Hz.
Age-adjusted to 2000 US Census
Column totals may not add due to missing data on the covariates
Age-adjusted prevalence of high frequency hearing impairment is presented in Table 5 by glycemic status (normal, impaired fasting glucose, and diabetes). The prevalence of hearing impairment was statistically higher for those with impaired fasting glucose compared to those with normal fasting glucose for three of the four outcomes, and was statistically higher for all four outcomes among persons with diabetes compared to those with normal fasting glucose. No difference in prevalence occurred by whether diabetes was diagnosed or undiagnosed.
Table 5.
Age-Adjusted Prevalence of High Frequency Hearing Impairment* in U.S. Adults Age 20–69 Years By Glycemic Status, Severity, and Whether Evaluated in the Worse Ear or Better Ear (n=2259) — NHANES 1999–2004.
| Hearing Impairment | |||||||||
|---|---|---|---|---|---|---|---|---|---|
| Worse Ear | Better Ear | ||||||||
| Glycemic status | n | Mild severity or greater† (n=811) | p-value‡ | Moderate severity or greater§ (n=428) | p-value | Mild severity or greater (n=541) | p-value | Moderate severity or greater (n=265) | p-value |
| Normal | 1501 | 30.4 (28.2, 32.6) | - | 15.2 (12.8, 17.5) | - | 19.4 (17.1, 21.7) | - | 9.8 (7.9, 11.7) | - |
| Impaired Fasting Glucose | 539 | 40.5 (35.4, 45.5) | .001 | 22.7 (18.3, 27.0) | .004 | 25.0 (21.1, 28.9) | .034 | 10.7 (7.9, 13.4) | 0.59 |
| Diabetes (all) | 219 | 48.4 (37.1, 59.7) | .003 | 35.6 (24.4, 46.8) | <.001 | 36.1 (25.0, 47.1) | .006 | 19.8 (12.1, 27.6) | .023 |
| Diagnosed | 146 | 48.4 (34.6, 62.2) | .013 | 35.8 (22.6, 49.0) | .003 | 37.0 (23.6, 50.4) | .014 | 19.4 (10.6, 28.1) | .049 |
| Undiagnosed | 73 | 48.2 (29.8, 66.5) | .056 | 35.5 (17.2, 53.8) | .036 | 33.3 (16.2, 50.4) | .118 | 20.8 (6.0, 35.5) | .156 |
pure tone average over thresholds assessed at 3000, 4000, 6000, and 8000 Hz
pure tone average > 25 dB HL
p-values test the contrast with normal glycemic status
pure tone average > 40 dB HL
In multivariable analyses, people with diabetes had statistically significant increased odds of hearing impairment in worse and better ears at all levels of severity and frequency (Table 6). Estimates were generally comparable across frequencies except those for hearing impairment of moderate or greater severity assessed in the better ear, where the odds ratio estimate of low/mid frequency impairment was higher and that of high frequency impairment was lower than all the others. Additional adjustment for hypertension and cardiovascular disease did not substantively change the odds ratio estimates (data not shown).
Table 6.
Multivariable-Adjusted Odds Ratios* for the Association of Diagnosed Diabetes and Hearing Impairment in U.S. Adults Age 20–69 Years By Frequency Range and Severity—NHANES 1999–2004 (n=4471).
| Hearing Impairment | n | Odds Ratio (95% CI) |
|---|---|---|
| Worse Ear | ||
| Mild or greater severity (PTA >25 dB HL) | ||
| Low/mid frequency† | 491 | 1.82 (1.27, 2.60) |
| High frequency† | 1537 | 2.16 (1.47, 3.18) |
| Moderate or greater severity (PTA >40 dB HL) | ||
| Low/mid frequency | 154 | 1.81 (1.09, 3.02) |
| High frequency† | 815 | 2.29 (1.52, 3.44) |
| Better Ear | ||
| Mild or greater severity (PTA >25 dB HL) | ||
| Low/mid frequency | 203 | 1.80 (1.14, 2.85) |
| High frequency | 1025 | 2.44 (1.65, 3.61) |
| Moderate or greater severity (PTA >40 dB HL) | ||
| Low/mid frequency | 44 | 3.21 (1.63, 6.29) |
| High frequency | 475 | 1.64 (1.04, 2.57) |
| Self-reported hearing impairment | 949 | 1.76 (1.30, 2.38) |
PTA=Pure tone average threshold
Adjusted for age, sex, race/ethnicity, education, poverty to income ratio, leisure time noise exposure, occupational noise exposure, military history, use of ototoxic medications, and smoking.
Model did not pass the Hosmer-Lemeshow goodness of fit test, but examination of residuals and observed and expected values did not suggest an important departure from model fit.
Discussion
Our report evaluates the association between diabetes and audiometrically assessed hearing impairment in the U.S. non-institutionalized population using nationally representative data. We estimate a prevalence of low/mid frequency hearing impairment of mild or greater severity of 28.0% among people with diabetes. The prevalence of hearing impairment was higher among individuals with diabetes in both sexes, all groups of race/ethnicity, education, income-to-poverty-ratio, and all but the oldest age group. The higher prevalence was not limited to possibly pre-disposed subgroups such as those who smoke, those with occupational or leisure time noise exposure, or those taking potentially ototoxic medications. The association between diabetes and hearing impairment remained in analyses that adjusted for other factors that may contribute to impairment.
The strength of association of diabetes with hearing impairment that we observe is comparable to that of two previous population-based studies. We report an odds ratio of 1.82 (95% CI 1.27, 2.60) for low/mid frequency hearing impairment of mild or greater severity assessed in the worse ear, while Helzner et al. (21) and Dalton et al. (20) reported odds ratios of 1.41 (95% CI 1.05, 1.88) and 1.42 (95% CI 1.10, 1.83), although the outcome of the latter study was based on a pure tone average in the worse ear of >25 dB HL over frequencies of 500, 1000, 2000, and 4000 Hz. For the purposes of comparison, we replicated the definition of hearing impairment used by Dalton et al, and observed an odds ratio of 1.89 (95%CI 1.27, 2.81). Our definition of diabetes differed from the one used by Dalton et al., who included cases of undiagnosed diabetes and attempted to exclude individuals with type 1 diabetes. Our analysis focused on people reporting a diabetes diagnosis. Due to the self-reported nature of our assessment, we were unable to restrict to people with type 2 diabetes, although 90–95% of the diabetes in our nationally representative sample of adults with diabetes is likely to be type 2 in origin (9).
Differences in age composition might account for the modest differences in the strength of association among these population-based studies. The adults in the sample of Helzner et al. were age 73–84 years, and those studied by Dalton et al. were of target age 43–84 years. The relative contribution of diabetes to hearing impairment may be stronger among our substantially younger sample (aged 20–69 years) before the cumulative effects of aging, noise exposure, and other factors have made substantial contributions to hearing impairment. Indeed, our graphic analysis of mean pure tone thresholds suggested the separation in pure tone thresholds by diabetes status was smaller in those aged 60–69 years. In addition, the ratio of the age-specific prevalence estimates presented in Table 4 appeared to be smaller for older versus younger participants, suggesting the relative contribution of diabetes may be less as one ages. Evidence from another relatively young sample of Japanese men in the military demonstrated a 87% increased odds of hearing impairment (using the Dalton et al. definition) for those reporting diabetes, which is consistent with our findings (25).
Gates et al. did not find a statistically significant difference in pure tone average (over 250, 500, and 1000 Hz or over 4000, 6000, and 8000 Hz) by diabetes status, although, with a mean age of 73 years, this Framingham cohort may be sufficiently old whereby any effect of diabetes is less likely to be observed (26). Ma et al., examined mean pure tone thresholds at 500, 1000, 2000, and 4000 Hz using data from the Hispanic Health and Nutrition Examination Survey and observed a higher mean threshold for Mexican American adults with diabetes, but only at 500 Hz (27).
Diabetes-related hearing loss has only been described as progressive, bilateral, sensorineural impairment with gradual onset predominantly affecting the higher frequencies (15). We observed generally stronger associations between diabetes and high frequency hearing impairment than low/mid frequency hearing impairment. No consistently stronger associations were observed with hearing impairment assessed in the better ear (bilateral impairment) or when assessing greater severity levels. When we examined hearing thresholds at specific frequencies, we observed higher thresholds at every frequency for people with diabetes compared to people without diabetes. This pattern held across all age groups. These observations are consistent with a report of higher hearing thresholds across all frequencies among patients with diabetes aged 40 and younger compared to healthy age-matched controls, even though the thresholds in either group were not in the range to be considered hearing impaired (28).
Several biological mechanisms might explain an association between diabetes and hearing impairment. Well-established complications of diabetes, such as retinopathy, nephropathy, and peripheral neuropathy involve pathogenic changes to the microvasculature and sensory nerves (14, 29). These pathologic changes may plausibly include the capillaries and sensory neurons of the inner ear, but evidence from human studies is limited. Post-mortem observations of diabetic patients include thickening of capillaries within the stria vascularis (13, 30) and demyelination of the eighth cranial nerve, one branch of which transmits auditory signals from the cochlea to the brain stem (12). Pathologic changes specific to the cochlea also include thickened walls of the vessels of the basilar membrane and greater loss of outer hair cells in the lower basal turn (30). Compromised cochlear function has been measured using evoked otoacoustic emissions, a non-invasive method to assess damage to the outer hair cells of the cochlea, among patients with diabetes relative to healthy controls (31). Other vascular changes include narrowing of the internal auditory artery (32). A number of rare genetic syndromes such as Alström syndrome (33), Wolfram syndrome (34), and “maternally inherited diabetes and deafness”(35) feature diabetes and hearing impairment as characteristics. It is possible that more common, but yet to be identified, genetic factors predispose to both diabetes and hearing impairment.
Potential limitations of the analysis include recall-based assessments of leisure time and occupational noise exposure; self-reported noise exposure is subject to measurement error, so we cannot rule out residual confounding as contributing to some of the association we observe. This limitation may be more of a factor for high frequency impairment because this outcome incorporates pure tone thresholds observed across 3000–6000 Hz, where injury from excessive noise stimulus is most notable (36). Similarly, for most of our analyses, the assessment of diabetes was based on self-report, and persons with undiagnosed diabetes were considered to be nondiabetic. Given the greater prevalence of hearing impairment that we observed with greater dysregulation of glucose, we have likely under-estimated the overall measures of association. Also, we are unable to distinguish between type 1 and type 2 diabetes, however, almost all participants in this study have type 2 diabetes. In addition, our measure of ototoxic drug use does not incorporate information on dose or use in the past. Last, we are able to make inferences only to the U.S. non-institutionalized adult population. It is likely that the prevalence of both diabetes and hearing impairment is even greater among institutionalized adults.
In summary, these data suggest that hearing impairment may be an under-recognized complication of diabetes. Although this analysis does not focus on possible mechanisms for the association of diabetes and hearing impairment, we have identified an important public health problem that can be addressed. With the high prevalence of hearing impairment occurring among diabetic patients, screening for this condition may be justified (37–39).
Acknowledgement
We thank Danita Byrd-Holt, BBA, and Laura Fang, MS, from Social & Scientific Systems, Inc for statistical programming support, Keith Rust, PhD, from Westat for statistical expertise and helpful comments, and Christa Themann, MS, from the University of Cincinnati, for helpful comments on the manuscript and for her involvement in the design and management of the audiometric component of NHANES while affiliated with the National Institute for Occupational Safety and Health.
Grant support The work of Kathleen Bainbridge was supported by NIDDK contracts #N001-DK-1-2478 and HHSN267200700001G.
Technical Appendix
Pure tone audiometry is a method of measuring hearing sensitivity across a range of frequencies. For each frequency, a pure tone signal is presented to the ear and the intensity of the signal is varied until the level at which the participant is just able to perceive the tone is identified. This level is the pure tone threshold for a particular frequency. A higher threshold indicates a more intense signal was necessary to perceive the tone and signifies greater hearing impairment. Audiologists express the intensity level of thresholds on a decibel hearing level (dB HL) scale based on the common logarithm of the ratio of the signal’s intensity to a reference intensity of 10−12 watts/m2 (22). Zero dB HL represents the threshold of hearing at each frequency for young adults. An average threshold of 25–39 dB HL is considered to be mild impairment, 40–55 dB HL is considered to be moderate impairment, 56–70 dB HL is considered to be moderately severe impairment, and 71–90 dB HL is considered to be severe impairment.
Hearing measurements in the study were collected by trained audiometric technicians using a calibrated Interacoustics Model AD226 audiometer with study participants in a sound-treated booth which met the American National Standard Maximum Permissible Ambient Noise Levels for Audiometric Test Rooms [ANSI S3.1-1991]. Daily confirmation was made of the audiometer calibration using a Quest Model BA-201-25 bioacoustic simulator to verify the stability of the audiometric signal over time. Audiometers met the specifications of ANSI S3.6-1996 for Type 3 audiometers. Standard audiometric headphones were used unless a potential for collapsing ear canals was noted on the otoscopic exam, in which case insert earphones were used.
App Table 4b
Prevalence of High Frequency Hearing Impairment of Mild or Greater Severity* Assessed in The Worse Ear in U.S. Adults Age 20–69 Years by Diabetes Status and Socio-demographic Characteristics—NHANES 1999–2004 (n=5140)
| Prevalence | Age-Adjusted† Prevalence | |||||||
|---|---|---|---|---|---|---|---|---|
| Diabetes (n=399) |
No Diabetes (n=4741) |
Diabetes (n=399) |
No Diabetes (n=4741) |
|||||
| n‡ | Prevalence, % (95% CI) |
n‡ | Prevalence, % (95% CI) |
p-value | Prevalence, % (95% CI) |
Prevalence, % (95% CI) |
p-value | |
| Age, years | ||||||||
| 20–49 | 97 | 44.2 (32.8, 55.6) | 3232 | 18.6 (16.8, 20.3) | <0.001 | - | - | |
| 50–59 | 111 | 70.5 (61.1, 79.9) | 727 | 55.7 (57.7, 59.7) | 0.003 | - | - | |
| 60–69 | 191 | 89.9 (84.3, 95.5) | 782 | 77.7 (74.2, 81.1) | 0.003 | - | - | |
| Race/Ethnicity | ||||||||
| Non-Hispanic White | 139 | 72.8 (64.8, 80.7) | 2311 | 34.8 (32.8, 36.8) | <0.001 | 58.1 (44.2, 71.9) | 34.2 (32.4, 35.9) | <0.001 |
| Non-Hispanic Black | 97 | 46.9 (36.9, 57.0) | 956 | 19.7 (17.5, 21.9) | <0.001 | 36.2 (19.5, 52.9) | 23.2 (21.0, 25.3) | 0.115 |
| Mexican American | 118 | 53.3 (40.9, 65.6) | 1090 | 22.3 (19.9, 24.7) | <0.001 | 39.3 (24.5, 54.1) | 30.0 (27.2, 21.7) | 0.170 |
| Other | 45 | 74.5 (61.8, 87.1) | 384 | 25.0 (19.9, 30.0) | <0.001 | 63.5 (43.3, 83.7) | 28.8 (24.2, 33.4) | 0.007 |
| Sex | ||||||||
| Male | 192 | 81.2 (73.8, 88.5) | 2223 | 42.7 (39.7, 45.6) | <0.001 | 69.0 (57.8, 80.2) | 44.1 (41.6, 46.7) | <0.001 |
| Female | 207 | 53.1 (43.7, 62.5) | 2518 | 20.3 (22.4, 18.1) | <0.001 | 35.8 (24.7, 46.8) | 20.6 (18.8, 22.5) | 0.002 |
| Education | ||||||||
| < High school | 166 | 76.4 (68.1, 84.6) | 1323 | 37.4 (33.6, 41.1) | <0.001 | 63.6 (47.9, 79.3) | 36.6 (33.3, 39.8) | 0.002 |
| High school | 91 | 66.9 (55.6, 71.2) | 1090 | 35.3 (32.6, 38.0) | <0.001 | 54.7 (36.1, 73.3) | 36.1 (33.5, 38.8) | 0.063 |
| > High school | 142 | 63.2 (53.9, 72.4) | 2326 | 27.4 (, 25.5, 29.4) | <0.001 | 49.5 (37.7, 61.3) | 28.7 (27.0, 30.4) | <0.001 |
| Income to Poverty Ratio | ||||||||
| <=1.0 | 88 | 67.9 (55.0, 80.7) | 796 | 26.1 (22.4, 29.8) | <0.001 | 56.8 (40.6, 72.9) | 31.6 (28.2, 35.1) | 0.002 |
| >1.0 | 273 | 67.9 (60.7, 75.0) | 3535 | 31.6 (29.7, 33.4) | <0.001 | 53.8 (44.2, 63.4) | 31.9 (30.3, 33.5) | <0.001 |
| Military History | ||||||||
| Yes | 68 | 89.8 (78.2, 101.4) | 517 | 56.0 (51.7, 60.3) | <0.001 | 80.3 (56.3, 104.3) | 42.1 (38.2, 45.9) | 0.004 |
| No | 330 | 61.6 (55.4, 67.7) | 4224 | 27.8 (26.3, 29.4) | <0.001 | 48.7 (40.1, 57.3) | 30.1 (28.6, 31.5) | <0.001 |
| Leisure time noise exposure |
||||||||
| Yes | 87 | 74.5 (63.2, 85.8) | 1227 | 34.0 (30.9, 37.1) | <0.001 | 64.2 (47.0, 81.5) | 38.6 (36.1, 41.1) | 0.005 |
| No | 312 | 65.4 (58.7, 72.2) | 3511 | 30.0 (28.2, 31.7) | <0.001 | 50.2 (41.4, 59.0) | 29.4 (27.8, 31.0) | <0.001 |
| Occupational noise exposure |
||||||||
| Yes | 117 | 76.2 (66.4, 86.1) | 1475 | 40.8 (37.6, 44.1) | <0.001 | 66.1 (52.4, 79.9) | 42.3(39.6, 45.1) | 0.001 |
| No | 254 | 62.3 (54.2, 70.4) | 3048 | 26.3 (24.5, 28.1) | <0.001 | 44.1 (34.2, 54.0) | 26.9 (25.2, 28.5) | <0.001 |
| Ototoxic medication use | ||||||||
| Yes | 101 | 71.2 (59.8, 82.5) | 514 | 39.4 (34.3, 44.6) | <0.001 | 53.7 (30.6, 76.8) | 30.9 (26.1, 35.7) | 0.025 |
| No | 298 | 66.6 (59.2, 74.1) | 4227 | 30.0 (28.5, 31.6) | <0.001 | 54.4 (44.7, 64.1) | 32.2 (30.7, 33.6) | <0.001 |
| Current Smoker | ||||||||
| Yes | 94 | 66.1 (53.8, 78.4) | 1251 | 32.8 (29.6, 36.1) | <0.001 | 59.8 (46.0, 73.6) | 36.4 (33.6, 39.3) | 0.012 |
| No | 305 | 68.3 (61.4, 75.2) | 3485 | 30.5 (28.6, 32.4) | <0.001 | 51.1 (40.8, 61.5) | 30.2 (28.5, 31.8) | <0.001 |
CI=Confidence Interval
Hearing impairment defined as pure tone average >25 dB of thresholds assessed at 3000, 4000, 6000, 8000 Hz.
Age-adjusted to 2000 US Census
Column totals may not add due to missing data on the covariates
App Table 4c
Prevalence of Low/mid Frequency Hearing Impairment of Moderate or Greater Severity* Assessed In the Worse Ear in U.S. Adults Age 20–69 Years by Diabetes Status and Socio-demographic Characteristics—NHANES 1999–2004 (n=5140)
| Prevalence | Age-Adjusted† Prevalence | |||||||
|---|---|---|---|---|---|---|---|---|
| Diabetes (n=399) |
No Diabetes (n=4741) |
Diabetes (n=399) |
No Diabetes (n=4741) |
|||||
| n‡ | Prevalence, % (95% CI) |
n‡ | Prevalence, % (95% CI) |
p-value | Prevalence, % (95% CI) |
Prevalence, % (95% CI) |
p-value | |
| Age, years | ||||||||
| 20–49 | 97 | 0.8 (0.0, 2.4) | 3232 | 1.1 (0.6, 1.5) | 0.78 | - | - | |
| 50–59 | 111 | 15.8 (8.0, 23.6) | 727 | 4.2 (2.3, 6.1) | 0.013 | - | - | |
| 60–69 | 191 | 11.4 (5.4, 17.5) | 782 | 9.4 (7.1, 11.7) | 0.52 | - | - | |
| Race/Ethnicity | ||||||||
| Non-Hispanic White | 139 | 10.1 (5.3, 15.0) | 2311 | 2.6 (1.9, 3.3) | 0.008 | 5.5 (2.6, 8.3) | 2.5 (1.8, 3.2) | 0.052 |
| Non-Hispanic Black | 97 | 6.2 (1.2, 11.2) | 956 | 1.5 (1.0, 2.0) | 0.091 | 2.7 (0.6, 4.8) | 1.8 (1.1, 2.4) | 0.26 |
| Mexican American | 118 | 9.5 (2.2, 16.7) | 1090 | 2.0 (1.2, 2.7) | 0.066 | 4.7 (1.3, 8.2) | 2.9 (1.7, 4.1) | 0.24 |
| Other | 45 | 8.9 (0.5, 17.3) | 384 | 3.2 (1.7, 4.8) | 0.172 | 4.1 (0.6, 7.6) | 3.8 (2.0, 5.7) | 0.51 |
| Sex | ||||||||
| Male | 192 | 9.0 (3.7, 14.2) | 2223 | 2.8 (1.9, 3.6) | 0.032 | 4.4 (1.7, 7.0) | 3.0 (2.1, 3.8) | 0.156 |
| Female | 207 | 9.7 (4.8, 14.5) | 2518 | 2.2 (1.5, 2.9) | 0.005 | 5.2 (1.9, 8.5) | 2.2 (1.5, 3.0) | 0.038 |
| Education | ||||||||
| < High school | 166 | 12.3 (4.7, 20.0) | 1323 | 3.9 (2.7, 5.2) | 0.036 | 5.6 (2.4, 8.9) | 3.7 (2.6, 4.7) | 0.20 |
| High school | 91 | 11.5 (4.1, 18.9) | 1090 | 2.6 (1.5, 3.7) | 0.024 | 6.8 (0.6, 13.0) | 2.7 (1.6, 3.8) | 0.151 |
| > High school | 142 | 6.2 (2.0, 10.5) | 2326 | 2.0 (1.3, 2.7) | 0.060 | 3.0 (1.0, 5.0) | 2.1 (1.4, 2.8) | 0.186 |
| Income to Poverty Ratio | ||||||||
| <=1.0 | 88 | 11.3 (3.6, 19.0) | 796 | 4.0 (2.4, 5.6) | 0.062 | 7.7 (1.6, 13.9) | 5.1 (3.4, 6.7) | 0.28 |
| >1.0 | 273 | 8.6 (4.3, 12.8) | 3535 | 2.2 (1.6, 2.8) | 0.009 | 3.9 (2.1, 5.6) | 2.3 (1.7, 2.8) | 0.066 |
| Military History | ||||||||
| Yes | 68 | 10.9 (0.0, 22.2) | 517 | 3.4 (1.6, 5.2) | 0.196 | 5.0 (0.0, 10.4) | 2.2 (1.1, 3.4) | 0.30 |
| No | 330 | 8.9 (5.2, 12.5) | 4224 | 2.4 (1.8, 2.9) | 0.001 | 4.6 (2.5, 6.7) | 2.7 (2.1, 3.3) | 0.028 |
| Leisure time noise exposure | ||||||||
| Yes | 87 | 9.4 (3.3, 15.5) | 1227 | 2.7 (1.5, 3.9) | 0.036 | 4.6 (1.6, 7.7) | 3.3 (1.9, 4.7) | 0.26 |
| No | 312 | 9.3 (5.4, 13.2) | 3511 | 2.4 (1.7, 3.0) | 0.002 | 4.8 (2.4, 7.1) | 2.3 (1.7, 2.9) | 0.024 |
| Occupational noise exposure | ||||||||
| Yes | 117 | 10.4 (3.2, 17.6) | 1475 | 2.8 (1.7, 3.8) | 0.057 | 6.3 (2.1, 10.5) | 3.1 (2.0, 4.1) | 0.132 |
| No | 254 | 8.7 (4.4, 13.0) | 3048 | 2.3 (1.6, 2.9) | 0.005 | 3.7 (1.8, 5.5) | 2.3 (1.7, 3.0) | 0.065 |
| Ototoxic medication use | ||||||||
| Yes | 101 | 9.0 (2.8, 15.3) | 514 | 4.5 (2.6, 6.3) | 0.183 | 7.1 (−0.9, 15.1) | 3.2 (1.7, 4.6) | 0.545 |
| No | 298 | 9.4 (4.9, 13.9) | 4227 | 2.2 (1.6, 2.8) | 0.003 | 4.5 (2.6, 6.5) | 2.5 (1.9, 3.1) | 0.025 |
| Current Smoker | ||||||||
| Yes | 94 | 8.9 (1.7, 16.1) | 1251 | 2.5 (1.4, 3.5) | 0.084 | 6.2 (1.2, 11.1) | 3.0 (1.9, 4.2) | 0.203 |
| No | 305 | 9.4 (5.6, 13.2) | 3485 | 2.5 (1.9, 3.0) | <0.001 | 4.0 (2.3, 5.7) | 2.4 (1.9. 3.0) | 0.023 |
CI=Confidence Interval
Hearing impairment defined as pure tone average >40 dB of thresholds assessed at 500, 1000, 2000 Hz.
Age-adjusted to 2000 US Census
Column totals may not add due to missing data on the covariates
App Table 4d
Prevalence of High Frequency Hearing Impairment of Moderate or Greater Severity* Assessed in the Worse Ear in U.S. Adults Age 20–69 Years by Diabetes Status and Socio-demographic Characteristics—NHANES 1999–2004 (n=5140)
| Prevalence | Age-Adjusted† Prevalence | |||||||
|---|---|---|---|---|---|---|---|---|
| Diabetes (n=399) |
No Diabetes (n=4741) |
Diabetes (n=399) |
No Diabetes (n=4741) |
|||||
| n‡ | Prevalence, % (95% CI) |
n‡ | Prevalence, % (95% CI) |
p-value | Prevalence, % (95% CI) |
Prevalence, % (95% CI) |
p-value | |
| Age, years | ||||||||
| 20–49 | 97 | 31.1 (18.1, 44.1) | 3232 | 7.3 (6.3, 8.2) | 0.004 | - | - | |
| 50–59 | 111 | 43.5 (33.3, 53.7) | 727 | 31.2 (26.4, 36.0) | 0.036 | - | - | |
| 60–69 | 191 | 63.2 (54.0, 72.4) | 782 | 50.0 (46.2, 53.8) | 0.016 | - | - | |
| Race/Ethnicity | ||||||||
| Non-Hispanic White | 139 | 53.4 (45.8, 60.9) | 2311 | 18.6 (16.9, 20.3) | <0.001 | 42.0 (27.1, 56.8) | 18.1 (16.7, 19.6) | <0.001 |
| Non-Hispanic Black | 97 | 20.4 (13.6, 27.2) | 956 | 6.7 (5.3, 8.2) | 0.003 | 13.5 (5.8, 21.2) | 8.2 (6.6, 9.7) | 0.163 |
| Mexican American | 118 | 23.3 (15.2, 31.5) | 1090 | 10.9 (9.0, 12.8) | 0.010 | 14.0 (8.3, 19.7) | 15.7 (13.5, 17.9) | 0.76 |
| Other | 45 | 49.6 (34.0, 65.1) | 384 | 10.3 (6.8, 13.9) | 0.003 | 49.1 (28.8, 69.4) | 12.4 (8.9, 15.8) | 0.016 |
| Sex | ||||||||
| Male | 192 | 58.8 (49.3, 68.3) | 2223 | 24.5 (22.2, 26.7) | <0.001 | 48.7 (35.9, 61.4) | 25.8 (23.9, 27.8) | 0.007 |
| Female | 207 | 31.2 (22.4, 39.9) | 2518 | 7.7 (6.3, 9.1) | <0.001 | 23.1 (12.5, 33.8) | 7.9 (6.6, 9.2) | 0.003 |
| Education | ||||||||
| < High school | 166 | 54.0 (41.9, 66.1) | 1323 | 21.4 (18.2, 24.6) | <0.001 | 48.9 (31.5, 66.4) | 20.7 (18.0, 23.4) | 0.017 |
| High school | 91 | 47.5 (33.9, 61.2) | 1090 | 19.1 (16.8, 21.3) | 0.002 | 38.6 (18.3, 58.8) | 19.8 (17.6, 22.1) | 0.100 |
| > High school | 142 | 39.5 (29.7, 49.3) | 2326 | 12.7 (11.3, 14.1) | <0.001 | 30.8 (18.4, 43.2) | 13.6 (12.2, 15.0) | 0.010 |
| Income to Poverty Ratio | ||||||||
| <=1.0 | 88 | 40.0 (27.4, 52.6) | 796 | 10.0 (7.8, 12.2) | <0.001 | 33.2 (17.6, 48.9) | 14.5 (11.9, 17.0) | 0.029 |
| >1.0 | 273 | 45.7 (38.4, 53.1) | 3535 | 16.5 (15.0, 18.1) | <0.001 | 36.9 (26.3, 47.6) | 16.8 (15.5, 18.1) | <0.001 |
| Military History | ||||||||
| Yes | 68 | 68.1 (53.3, 82.9) | 517 | 39.2 (35.4, 43.0) | 0.003 | 62.8 (37.9, 87.7) | 27.2 (24.3, 30.1) | 0.096 |
| No | 330 | 39.2 (33.2, 45.2) | 4224 | 12.7 (11.4, 14.0) | <0.001 | 31.5 (22.4, 40.7) | 14.1 (12.8, 15.4) | <0.001 |
| Leisure time noise exposure |
||||||||
| Yes | 87 | 62.5 (50.1, 75.0) | 1227 | 18.8 (16.6, 20.9) | <0.001 | 52.0 (33.8, 70.1) | 22.9 (21.1, 24.7) | 0.002 |
| No | 312 | 39.8 (33.7, 45.8) | 3511 | 14.6 (13.1, 16.1) | <0.001 | 31.5 (22.7, 40.2) | 14.3 (12.9, 15.6) | <0.001 |
| Occupational noise exposure |
||||||||
| Yes | 117 | 58.4 (46.2, 70.5) | 1475 | 22.7 (20.0, 25.3) | <0.001 | 50.9 (35.8, 66.0) | 24.0 (21.7, 26.3) | 0.003 |
| No | 254 | 38.5 (31.2, 45.9) | 3048 | 12.4 (11.0, 13.8) | <0.001 | 26.7 (17.7, 35.7) | 12.8 (11.6, 14.0) | 0.004 |
| Ototoxic medication use | ||||||||
| Yes | 101 | 53.3 (40.9, 65.6) | 514 | 20.3 (16.4, 24.1) | <0.001 | 29.9 (13.0, 46.8) | 14.7 (11.9, 17.6) | 0.004 |
| No | 298 | 43.0 (36.9, 49.2) | 4227 | 15.3 (14.0, 16.5) | <0.001 | 37.6 (27.9, 47.4) | 16.8 (15.6, 18.0) | <0.001 |
| Current Smoker | ||||||||
| Yes | 94 | 48.8 (34.8, 62.8) | 1251 | 16.5 (13.9, 19.0) | 0.001 | 46.9 (30.3, 63.8) | 19.3 (16.7, 21.8) | 0.017 |
| No | 305 | 44.6 (37.1, 52.1) | 3485 | 15.6 (14.1, 17.2) | <0.001 | 31.8 (21.1, 42.5) | 15.4 (14.1, 16.7) | <0.001 |
CI=Confidence Interval
Hearing impairment defined as pure tone average >40 dB of thresholds assessed at 3000, 4000, 6000, 8000 Hz.
Age-adjusted to 2000 US Census
Column totals may not add due to missing data on the covariates
App Table 4e
Prevalence of Low/mid Frequency Hearing Impairment of Mild or Greater Severity* Assessed in the Better Ear in U.S. Adults Age 20–69 Years by Diabetes Status and Socio-demographic Characteristics—NHANES 1999–2004 (n=5140)
| Prevalence | Age-Adjusted† Prevalence | |||||||
|---|---|---|---|---|---|---|---|---|
| Diabetes (n=399) |
No Diabetes (n=4741) |
Diabetes (n=399) |
No Diabetes (n=4741) |
|||||
| n‡ | Prevalence, % (95% CI) |
n‡ | Prevalence, % (95% CI) |
p-value | Prevalence, % (95% CI) |
Prevalence, % (95% CI) |
p-value | |
| Age, years | ||||||||
| 20–49 | 97 | 5.2 (0.0, 10.8) | 3232 | 1.3 (0.7, 1.9) | 0.20 | - | - | |
| 50–59 | 111 | 15.9 (8.0, 23.7) | 727 | 4.9 (3.1, 6.8) | 0.021 | - | - | |
| 60–69 | 191 | 17.0 (10.8, 23.2) | 782 | 15.0 (11.4, 18.5) | 0.56 | - | - | |
| Race/Ethnicity | ||||||||
| Non-Hispanic White | 139 | 12.0 (6.8, 17.3) | 2311 | 3.7 (2.8, 4.5) | 0.007 | 6.9 (2.4, 11.4) | 3.6 (2.8, 4.4) | 0.114 |
| Non-Hispanic Black | 97 | 5.9 (0.8, 10.9) | 956 | 1.9 (1.1, 2.7) | 0.144 | 2.6 (0.5, 4.7) | 3.3 (1.4, 3.2) | 0.55 |
| Mexican American | 118 | 11.7 (7.7, 15.7) | 1090 | 2.7 (1.7, 3.5) | <0.001 | 5.8 (3.9, 7.6) | 4.3 (2.7, 5.9) | 0.079 |
| Other | 45 | 20.9 (9.3, 32.5) | 384 | 3.4 (1.5, 5.3) | 0.014 | 18.8 (2.8, 34.8) | 4.4 (2.1, 6.6) | 0.047 |
| Sex | ||||||||
| Male | 192 | 11.5 (5.9, 17.1) | 2223 | 3.4 (2.5, 4.4) | 0.010 | 6.9 (2.3, 11.5) | 3.8 (2.9, 4.7) | 0.192 |
| Female | 207 | 13.8 (7.6, 20.0) | 2518 | 3.3 (2.4, 4.1) | 0.004 | 10.6 (2.3, 18.9) | 3.4 (2.5, 4.2) | 0.028 |
| Education | ||||||||
| < High school | 166 | 19.5 (10.5, 28.5) | 1323 | 5.8 (4.2, 7.4) | 0.010 | 16.0 (4.3, 27.7) | 5.3 (4.1, 6.6) | 0.113 |
| High school | 91 | 10.7 (3.4, 18.0) | 1090 | 3.6 (2.3, 4.9) | 0.061 | 3.5 (0.5, 6.5) | 3.7 (2.4, 5.0) | 0.38 |
| > High school | 142 | 9.5 (4.0, 14.9) | 2326 | 2.5 (1.7, 3.3) | 0.024 | 6.4 (1.6, 11.2) | 2.8 (2.0, 3.5) | 0.106 |
| Income to Poverty Ratio | ||||||||
| <=1.0 | 88 | 12.8 (4.6, 20.9) | 796 | 3.9 (2.6, 5.1) | 0.046 | 6.4 (3.1, 9.6) | 6.0 (3.9, 8.0) | 0.46 |
| >1.0 | 273 | 12.4 (7.7, 17.1) | 3535 | 3.0 (2.4, 3.7) | 0.001 | 8.1 (3.2, 13.1) | 3.2 (2.5, 3.8) | 0.018 |
| Military History | ||||||||
| Yes | 68 | 15.3 (3.3, 27.3) | 517 | 6.3 (3.8, 8.8) | 0.162 | 6.0 (0.7, 11.4) | 4.1 (2.3, 6.0) | 0.45 |
| No | 330 | 11.8 (7.5, 16.1) | 4224 | 3.0 (2.4, 3.6) | <0.001 | 8.8 (4.2, 13.4) | 3.4 (2.8, 4.1) | 0.012 |
| Leisure time noise exposure | ||||||||
| Yes | 87 | 15.6 (8.3, 23.0) | 1227 | 3.5 (2.3, 4.6) | 0.004 | 10.4 (2.8, 17.9) | 4.7 (3.2, 6.1) | 0.109 |
| No | 312 | 11.5 (7.0, 16.0) | 3511 | 3.3 (2.6, 3.9) | 0.002 | 7.9 (2.7, 13.0) | 3.2 (2.6, 3.8) | 0.033 |
| Occupational noise exposure | ||||||||
| Yes | 117 | 9.1 (2.2, 16.0) | 1475 | 4.1 (2.8, 5.3) | 0.18 | 4.5 (1.5, 7.6) | 4.5 (3.3, 5.8) | 0.60 |
| No | 254 | 13.5 (8.4, 18.6) | 3048 | 2.7 (2.0, 3.4) | <0.001 | 9.5 (2.9, 16.1) | 2.8 (2.1, 3.5) | 0.010 |
| Ototoxic medication use | ||||||||
| Yes | 101 | 16.7 (5.4, 27.9) | 514 | 7.5 (4.6, 10.5) | 0.091 | 6.2 (1.8, 10.5) | 5.6 (3.3, 7.9) | 0.35 |
| No | 298 | 11.2 (6.8, 15.6) | 4227 | 2.8 (2.3, 3.3) | 0.001 | 8.5 (3.6, 13.4) | 3.2 (2.6. 3.8) | 0.028 |
| Current Smoker | ||||||||
| Yes | 94 | 14.8 (6.3, 23.4) | 1251 | 3.3 (2.3, 4.3) | 0.018 | 12.8 (3.5, 22.0) | 3.9 (2.8, 5.0) | 0.056 |
| No | 305 | 11.9 (6.8, 16.9) | 3485 | 3.4 (2.6, 4.1) | 0.002 | 6.4 (2.1, 10.6) | 3.3 (2.6, 4.0) | 0.074 |
CI=Confidence Interval
Hearing impairment defined as pure tone average >25 dB of thresholds assessed at 500, 1000, 2000 Hz.
Age-adjusted to 2000 US Census
Column totals may not add due to missing data on the covariates
App Table 4f
Prevalence of High Frequency Hearing Impairment of Mild or Greater Severity* Assessed in The Better Ear in U.S. Adults Age 20–69 Years by Diabetes Status and Socio-demographic Characteristics—NHANES 1999–2004 (n=5140)
| Prevalence | Age-Adjusted† Prevalence | |||||||
|---|---|---|---|---|---|---|---|---|
| Diabetes (n=399) |
No Diabetes (n=4741) |
Diabetes (n=399) |
No Diabetes (n=4741) |
|||||
| n‡ | Prevalence, % (95% CI) |
n‡ | Prevalence, % (95% CI) |
p-value | Prevalence, % (95% CI) |
Prevalence, % (95% CI) |
p-value | |
| Age, years | ||||||||
| 20–49 | 97 | 31.6 (21.2, 42.1) | 3232 | 8.8 (7.6, 10.0) | 0.001 | - | - | |
| 50–59 | 111 | 56.0 (45.4, 66.5) | 727 | 37.9 (33.7, 42.1) | 0.003 | - | - | |
| 60–69 | 191 | 75.7 (67.6, 83.8) | 782 | 62.2 (57.7, 66.7) | 0.011 | - | - | |
| Race/Ethnicity | ||||||||
| Non-Hispanic White | 139 | 58.4 (50.4, 66.4) | 2311 | 22.7 (21.1, 24.4) | <0.001 | 42.9 (31.4, 54.3) | 22.2 (20.7, 23.6) | <0.001 |
| Non-Hispanic Black | 97 | 29.3 (21.2, 37.4) | 956 | 10.0 (8.2, 11.7) | <0.001 | 20.6 (9.7, 31.4) | 12.5 (10.7, 14.4) | 0.178 |
| Mexican American | 118 | 39.9 (30.7, 49.2) | 1090 | 12.4 (10.6, 14.2) | <0.001 | 23.9 (16.1, 31.8) | 18.7 (16.5, 20.9) | 0.036 |
| Other | 45 | 66.3 (50.7, 81.9) | 384 | 11.7 (8.2, 15.3) | <0.001 | 58.9 (37.7, 80.2) | 14.3 (11.2, 17.4) | 0.002 |
| Sex | ||||||||
| Male | 192 | 69.0 (60.8, 77.2) | 2223 | 27.7 (25.4, 29.9) | <0.001 | 54.3 (43.9, 64.8) | 29.2 (27.3, 31.0) | <0.001 |
| Female | 207 | 37.7 (27.4, 48.0) | 2518 | 11.5 (10.0, 13.0) | <0.001 | 25.8 (14.9, 36.7) | 11.8 (10.4, 13.2) | 0.013 |
| Education | ||||||||
| < High school | 166 | 63.4 (52.3, 74.4) | 1323 | 24.9 (21.3, 28.5) | <0.001 | 53.5 (38.2, 68.7) | 24.0 (20.9, 27.1) | 0.003 |
| High school | 91 | 56.1 (43.7, 68.4) | 1090 | 22.3 (19.8, 24.8) | <0.001 | 40.8 (21.0, 60.6) | 23.1 (20.5, 25.6) | 0.037 |
| > High school | 142 | 47.3 (37.9, 56.8) | 2326 | 16.4 (14.9, 17.9) | <0.001 | 34.9 (22.8, 46.9) | 17.6 (16.1, 19.1) | 0.004 |
| Income to Poverty Ratio | ||||||||
| <=1.0 | 88 | 50.0 (34.2, 65.7) | 796 | 12.9 (10.7, 15.1) | 0.001 | 32.8 (22.1, 43.5) | 17.5 (14.8, 20.3) | 0.006 |
| >1.0 | 273 | 55.0 (47.9, 62.0) | 3535 | 20.1 (18.8, 21.5) | <0.001 | 43.2 (33.5, 52.9) | 20.5 (19.3, 21.7) | <0.001 |
| Military History | ||||||||
| Yes | 68 | 80.6 (68.7, 92.5) | 517 | 45.1 (40.6, 49.6) | <0.001 | 77.5 (53.3, 101.7) | 32.7 (29.0, 36.5) | 0.005 |
| No | 330 | 46.5 (39.1, 53.9) | 4224 | 16.0 (14.8, 17.1) | <0.001 | 33.7 (25.4, 42.0) | 17.8 (16.7, 19.0) | <0.001 |
| Leisure time noise exposure |
||||||||
| Yes | 87 | 68.7 (58.0, 79.4) | 1227 | 21.8 (19.1, 24.5) | <0.001 | 60.2 (43.2, 77.3) | 26.0 (23.4, 28.5) | <0.001 |
| No | 312 | 49.0 (41.8, 56.1) | 3511 | 18.4 (16.8, 20.0) | <0.001 | 33.4 (25.3, 41.6) | 17.9 (16.5, 19.3) | <0.001 |
| Occupational noise exposure |
||||||||
| Yes | 117 | 58.6 (47.2, 69.9) | 1475 | 27.8 (25.3, 30.3) | <0.001 | 50.0 (37.2, 62.8) | 29.3 (27.2, 31.4) | 0.011 |
| No | 254 | 51.0 (43.6, 58.4) | 3048 | 15.1 (13.7, 16.7) | <0.001 | 33.5 (24.4, 42.5) | 15.7 (14.3, 17.0) | <0.001 |
| Ototoxic medication use | ||||||||
| Yes | 101 | 61.0 (48.7, 73.3) | 514 | 27.7 (32.5, 23.0) | <0.001 | 43.3 (20.5, 66.0) | 19.8 (16.1, 23.4) | 0.020 |
| No | 298 | 51.7 (44.5, 59.0) | 4227 | 18.3 (17.1, 19.5) | <0.001 | 40.6 (31.2, 49.9) | 20.1 (19.0, 21.2) | <0.001 |
| Current Smoker | ||||||||
| Yes | 94 | 54.1 (39.7, 68.5) | 1251 | 21.2 (18.4, 23.9) | 0.001 | 47.4 (31.5, 63.2) | 24.5 (21.8, 27.2) | 0.027 |
| No | 305 | 54.0 (46.4, 61.6) | 3485 | 18.7 (17.2, 20.2) | <0.001 | 38.0 (29.1, 46.9) | 18.4 (17.2, 19.7) | <0.001 |
CI=Confidence Interval
Hearing impairment defined as pure tone average >25 dB of thresholds assessed at 3000, 4000, 6000, 8000 Hz.
Age-adjusted to 2000 US Census
Column totals may not add due to missing data on the covariates
App Table 4g
Prevalence of Low/mid Frequency Hearing Impairment of Moderate or Greater Severity* Assessed in The Better Ear in U.S. Adults Age 20–69 Years by Diabetes Status and Socio-demographic Characteristics—NHANES 1999–2004 (n=5140)
| Prevalence | Age-Adjusted† Prevalence | |||||||
|---|---|---|---|---|---|---|---|---|
| Diabetes (n=399) |
No Diabetes (n=4741) |
Diabetes (n=399) |
No Diabetes (n=4741) |
|||||
| n‡ | Prevalence, % (95% CI) |
n‡ | Prevalence, % (95% CI) |
p-value | Prevalence, % (95% CI) |
Prevalence, % (95% CI) |
p-value | |
| Age, years | ||||||||
| 20–49 | 97 | 0.0 (0.0, 0.0) | 3232 | 0.3 (0.1, 0.5) | 0.004 | - | - | |
| 50–59 | 111 | 5.5 (0.5, 10.5) | 727 | 0.8 (0.2, 1.4) | 0.076 | - | - | |
| 60–69 | 191 | 4.5 (0.6, 8.5) | 782 | 1.9 (0.6, 3.1) | 0.155 | - | - | |
| Race/Ethnicity | ||||||||
| Non-Hispanic White | 139 | 3.8 (0.9, 6.7) | 2311 | 0.6 (0.3, 0.9) | 0.043 | 1.6 (0.3, 3.0) | 0.6 (0.3, 0.8) | 0.060 |
| Non-Hispanic Black | 97 | 4.1 (−0.6, 8.7) | 956 | 0.6 (0.2, 1.0) | 0.171 | 1.8 (−0.2, 3.8) | 0.7 (0.2, 1.2) | 0.24 |
| Mexican American | 118 | 5.1 (−0.9, 11.0) | 1090 | 0.6 (0.3, 0.9) | 0.157 | 2.6 (−0.5, 5.6) | 0.9 (0.3, 1.4) | 0.25 |
| Other | 45 | 0.0 (0.0, 0.0) | 384 | 0.6 (−0.1, 1.3) | 0.193 | 0.0 (0.0, 0.0) | 0.5 (−0.2, 1.3) | 0.25 |
| Sex | ||||||||
| Male | 192 | 3.0 (, 0.2, 5.8) | 2223 | 0.7 (0.3, 1.1) | 0.112 | 1.4 (−0.1, 2.8) | 0.7 (0.3, 1.1) | 0.185 |
| Female | 207 | 3.7 (, 0.8, 6.5) | 2518 | 0.4 (0.1, 0.7) | 0.033 | 1.6 (0.4, 2.8) | 0.5 (0.2, 0.8) | 0.052 |
| Education | ||||||||
| < High school | 166 | 2.7 (0.1, 5.4) | 1323 | 1.3 (0.4, 2.1) | 0.31 | 1.0 (0.2, 1.9) | 1.2 (0.4, 1.9) | 0.92 |
| High school | 91 | 5.0 (−0.2, 10.2) | 1090 | 0.6 (0.1, 1.1) | 0.105 | 2.0 (−0.4, 4.4) | 0.6 (0.1, 1.2) | 0.103 |
| > High school | 142 | 2.7 (−0.1, 5.6) | 2326 | 0.3 (0.1, 0.6) | 0.118 | 1.3 (−0.1, 2.7) | 0.4 (0.1, 0.6) | 0.137 |
| Income to Poverty Ratio | ||||||||
| <=1.0 | 88 | 4.4 (−0.1, 8.9) | 796 | 1.3 (0.6, 2.1) | 0.22 | 2.3 (−0.1, 4.8) | 1.6 (0.7, 2.5) | 0.37 |
| >1.0 | 273 | 3.2 (0.8, 5.7) | 3535 | 0.4 (0.2, 0.6) | 0.03 | 1.4 (0.3, 2.5) | 0.4 (0.2, 0.6) | 0.050 |
| Military History | ||||||||
| Yes | 68 | 4.1 (−0.9, 9.1) | 517 | 0.4 (0.0, 0.7) | 0.157 | 1.0 (−0.3, 2.2) | 0.4 (−0.1, 0.9) | 0.162 |
| No | 330 | 3.1 (0.9, 5.3) | 4224 | 0.6 (0.3, 0.9) | 0.034 | 1.5 (0.4, 2.6) | 0.7 (0.4, 1.0) | 0.085 |
| Leisure time noise exposure | ||||||||
| Yes | 87 | 3.3 (−0.3, 6.9) | 1227 | 0.7 (0.2, 1.2) | 0.180 | 1.5 (−0.1, 3.1) | 0.8 (0.2, 1.4) | 0.29 |
| No | 312 | 3.3 (1.0, 5.7) | 3511 | 0.5 (0.2, 0.8) | 0.029 | 1.5 (0.4, 2.6) | 0.5 (0.2, 0.8) | 0.063 |
| Occupational noise exposure | ||||||||
| Yes | 117 | 4.1 (−0.1, 8.2) | 1475 | 0.9 (0.3, 1.5) | 0.14 | 2.0 (0.0, 4.0) | 0.9 (0.3, 1.6) | 0.17 |
| No | 254 | 2.7 (0.4, 4.9) | 3048 | 0.4 (0.1, 0.6) | 0.05 | 1.2 (0.2, 2.2) | 0.4 (0.2, 0.6) | 0.11 |
| Ototoxic medication use | ||||||||
| Yes | 101 | 4.1 (−1.3, 9.4) | 514 | 1.1 (0.2, 2.1) | 0.27 | 1.6 (−0.7, 3.9) | 0.9 (0.1, 1.7) | 0.40 |
| No | 298 | 3.1 (1.0, 5.1) | 4227 | 0.5 (0.3, 0.7) | 0.020 | 1.5 (0.5, 2.4) | 0.5 (0.3, 0.7) | 0.030 |
| Current Smoker | ||||||||
| Yes | 94 | 2.3 (−0.4, 5.1) | 1251 | 0.9 (0.3, 1.4) | 0.31 | 1.3 (−0.1, 2.7) | 0.9 (0.4, 1.5) | 0.41 |
| No | 305 | 3.6 (1.2, 6.1) | 3485 | 0.4 (0.2, 0.6) | 0.019 | 1.6 (0.5, 2.7) | 0.4 (0.2, 0.6) | 0.033 |
CI=Confidence Interval
Hearing impairment defined as pure tone average >40 dB of thresholds assessed at 500, 1000, 2000 Hz.
Age-adjusted to 2000 US Census
Column totals may not add due to missing data on the covariates
App Table 4h
Prevalence of High Frequency Hearing Impairment of Moderate or Greater Severity* Assessed in The Better Ear in U.S. Adults Age 20–69 Years by Diabetes Status and Socio-demographic Characteristics—NHANES 1999–2004 (n=5140)
| Prevalence | Age-Adjusted† Prevalence | |||||||
|---|---|---|---|---|---|---|---|---|
| Diabetes (n=399) |
No Diabetes (n=4741) |
Diabetes (n=399) |
No Diabetes (n=4741) |
|||||
| n‡ | Prevalence, % (95% CI) |
n‡ | Prevalence, % (95% CI) |
p-value | Prevalence, % (95% CI) |
Prevalence, % (95% CI) |
p-value | |
| Age, years | ||||||||
| 20–49 | 97 | 12.6 (5.5, 19.7) | 3232 | 2.7 (1.9, 3.4) | 0.019 | - | - | |
| 50–59 | 111 | 22.0 (13.7, 30.4) | 727 | 17.2 (13.5, 21.0) | 0.31 | - | - | |
| 60–69 | 191 | 47.8 (37.7, 57.8) | 782 | 36.7 (32.9, 40.4) | 0.052 | - | - | |
| Race/Ethnicity | ||||||||
| Non-Hispanic White | 139 | 29.6 (23.1, 36.1) | 2311 | 10.7 (9.4, 12.0) | <0.001 | 15.5 (9.3, 21.7) | 10.3 (9.3, 11.4) | 0.025 |
| Non-Hispanic Black | 97 | 9.8 (4.4, 15.3) | 956 | 3.0 (2.2, 3.8) | 0.038 | 4.2 (2.1, 6.3) | 3.7 (2.8, 4.6) | 0.37 |
| Mexican American | 118 | 16.8 (9.6, 23.9) | 1090 | 4.6 (3.6, 5.6) | 0.008 | 10.7 (5.0, 16.4) | 8.0 (6.4, 9.5) | 0.55 |
| Other | 45 | 37.6 (23.8, 51.4) | 384 | 4.5 (2.4, 6.6) | <0.001 | 38.9 (19.4, 58.5) | 5.9 (3.7, 8.2) | 0.005 |
| Sex | ||||||||
| Male | 192 | 40.1 (32.5, 47.6) | 2223 | 13.9 (12.1, 15.7) | <0.001 | 27.4 (19.1, 35.8) | 15.0 (13.74, 16.6) | 0.007 |
| Female | 207 | 12.8 (6.8, 18.9) | 2518 | 3.8 (3.0, 4.7) | 0.010 | 8.0 (1.7, 14.4) | 3.9 (3.2, 4.7) | 0.20 |
| Education | ||||||||
| < High school | 166 | 27.1 (18.1, 36.1) | 1323 | 13.0 (10.3, 15.6) | 0.011 | 15.4 (6.4, 24.3) | 12.1 (10.3, 13.9) | 0.77 |
| High school | 91 | 26.8 (16.4, 37.2) | 1090 | 10.5 (8.7, 12.4) | 0.012 | 15.6 (4.4, 26.7) | 11.0 (9.0, 13.1) | 0.52 |
| > High school | 142 | 27.2 (19.0, 35.5) | 2326 | 6.6 (5.5, 7.7) | <0.001 | 20.9 (12.0, 29.8) | 7.2 (6.1, 8.3) | 0.007 |
| Income to Poverty Ratio | ||||||||
| <=1.0 | 88 | 17.4 (6.3, 28.4) | 796 | 5.2 (3.7, 6.7) | 0.061 | 8.6 (4.7, 12.6) | 8.2 (6.1, 10.3) | 0.68 |
| >1.0 | 273 | 28.7 (22.6, 34.8) | 3535 | 9.1 (7.9, 10.2) | <0.001 | 20.5 (13.2, 27.8) | 9.3 (8.4, 10.3) | 0.009 |
| Military History | ||||||||
| Yes | 68 | 51.2 (36.3, 66.1) | 517 | 25.3 (21.6, 29.0) | 0.008 | 42.5 (20.8, 64.2) | 16.2 (13.4, 19.1) | 0.151 |
| No | 330 | 20.2 (14.8, 25.6) | 4224 | 6.5 (5.6, 7.4) | <0.001 | 13.0 (9.5, 16.6) | 7.5 (6.6, 8.4) | 0.025 |
| Leisure time noise exposure |
||||||||
| Yes | 87 | 43.9 (32.8, 55.0) | 1227 | 10.1 (8.3, 11.9) | <0.001 | 30.7 (16.2, 45.2) | 13.3 (11.6, 15.0) | 0.007 |
| No | 312 | 21.3 (16.3, 26.3) | 3511 | 8.1 (6.9, 9.3) | <0.001 | 13.9 (8.2, 19.6) | 7.9 (6.9, 8.8) | 0.089 |
| Occupational noise exposure |
||||||||
| Yes | 117 | 30.7 (20.0, 41.3) | 1475 | 13.6 (11.7, 15.4) | 0.005 | 21.9 (11.2, 32.6) | 14.7 (13.1, 16.4) | 0.21 |
| No | 254 | 24.4 (19.0, 29.8) | 3048 | 6.2 (5.1, 7.2) | <0.001 | 14.9 (8.2, 21.5) | 6.4 (5.4, 7.4) | 0.005 |
| Ototoxic medication use | ||||||||
| Yes | 101 | 30.7 (19.7, 41.7) | 514 | 12.2 (9.2, 15.2) | 0.002 | 10.2 (6.4, 14.0) | 8.3 (6.2, 10.4) | 0.067 |
| No | 298 | 25.9 (20.7, 31.0) | 4227 | 8.2 (7.3, 9.2) | <0.001 | 19.6 (13.3. 25.8) | 9.4 (8.4, 10.4) | 0.006 |
| Current Smoker | ||||||||
| Yes | 94 | 28.2 (18.5, 37.8) | 1251 | 9.0 (7.3, 10.8) | 0.002 | 24.3 (15.2. 33.4) | 11.6 (9.9, 13.2) | 0.045 |
| No | 305 | 26.7 (20.1, 33.3) | 3485 | 8.6 (7.5, 9.7) | <0.001 | 15.4 (8.3, 22.5) | 8.4 (7.5, 9.4) | 0.021 |
CI=Confidence Interval
Hearing impairment defined as pure tone average >40 dB of thresholds assessed at 3000, 4000, 6000, 8000 Hz.
Age-adjusted to 2000 US Census
Column totals may not add due to missing data on the covariates
App Table 4i
Prevalence of Self-Reported Hearing Impairment in U.S. Adults Age 20–69 Years by Diabetes Status and Socio-demographic Characteristics—NHANES 1999–2004 (n=5140)
| Prevalence | Age-Adjusted* Prevalence | |||||||
|---|---|---|---|---|---|---|---|---|
| Diabetes (n=399) |
No Diabetes (n=4741) |
Diabetes (n=399) |
No Diabetes (n=4741) |
|||||
| n† | Prevalence, % (95% CI) |
n† | Prevalence, % (95% CI) |
p-value | Prevalence, % (95% CI) |
Prevalence, % (95% CI) |
p-value | |
| Age, years | ||||||||
| 20–49 | 97 | 36.5 (24.8, 48.3) | 3232 | 17.3 (16.2, 19.3) | 0.007 | - | - | |
| 50–59 | 111 | 41.1 (31.9, 50.3) | 727 | 28.8 (24.4, 33.1) | 0.024 | - | - | |
| 60–69 | 191 | 49.6 (39.6, 59.6) | 782 | 35.4 (30.6, 40.2) | 0.012 | - | - | |
| Race/Ethnicity | ||||||||
| Non-Hispanic White | 139 | 48.2 (40.0, 56.3) | 2311 | 24.4 (22.5, 26.3) | <.001 | 46.7 (33.2, 60.1) | 24.2 (22.3, 26.1) | 0.001 |
| Non-Hispanic Black | 97 | 23.3 (14.9, 31.6) | 956 | 12.6 (10.5, 14.7) | 0.030 | 18.0 (6.9, 29.1) | 13.2 (11.0, 15.3) | 0.156 |
| Mexican American | 118 | 30.1 (18.6, 41.7) | 1090 | 15.1 (12.7, 17.6) | 0.034 | 28.7 (13.5, 44.0) | 17.5 (14.9, 20.2) | 0.176 |
| Other | 45 | 42.9 (29.4, 56.4) | 384 | 15.7 (11.4, 20.0) | 0.001 | 36.4 (17.8, 54.9) | 16.0 (11.9, 20.1) | 0.004 |
| Sex | ||||||||
| Male | 192 | 52.3 (44.4, 60.3) | 2223 | 26.2 (23.6, 28.8) | <0.001 | 48.1 (37.6, 58.5) | 26.8 (24.3, 29.3) | <0.001 |
| Female | 207 | 31.3 (21.8, 40.7) | 2518 | 17.0 (14.9, 19.1) | 0.011 | 28.2 (14.6, 41.8) | 17.1 (15.0, 19.1) | 0.064 |
| Education | ||||||||
| < High school | 166 | 39.8 (29.4, 50.2) | 1323 | 23.3 (19.0, 27.6) | 0.011 | 35.3 (20.0, 50.7) | 22.9 (18.8, 26.9) | 0.143 |
| High school | 91 | 45.0 (31.3, 58.7) | 1090 | 24.1 (21.2, 27.1) | 0.014 | 39.0 (20.1, 58.0) | 24.4 (21.4, 27.4) | 0.032 |
| > High school | 142 | 42.3 (32.2, 52.3) | 2326 | 19.8 (17.8, 21.7) | <0.001 | 40.5 (27.3, 53.6) | 20.1 (18.3, 22.0) | 0.004 |
| Income to Poverty Ratio | ||||||||
| <=1.0 | 88 | 41.0 (26.8, 55.2) | 796 | 22.2 (17.7, 26.7) | 0.038 | 39.6 (21.2, 57.9) | 23.5 (18.8, 28.1) | 0.121 |
| >1.0 | 273 | 40.0 (32.3, 47.6) | 3535 | 21.3 (19.8, 22.9) | <0.001 | 35.2 (23.6, 46.8) | 21.5 (20.0, 23.0) | 0.005 |
| Military History | ||||||||
| Yes | 68 | 52.4 (36.9, 67.8) | 517 | 35.2 (30.9, 39.4) | 0.064 | 49.0 (26.8, 71.1) | 31.3 (26.7, 35.8) | 0.134 |
| No | 330 | 39.5 (32.1, 46.9) | 4224 | 19.7 (18.2, 21.2) | <0.001 | 36.9 (27.0, 46.8) | 20.3 (18.7, 21.8) | <0.001 |
| Leisure time noise exposure |
||||||||
| Yes | 87 | 57.2 (44.5, 69.9) | 1227 | 31.5 (28.0, 35.0) | <0.001 | 51.4 (35.1, 67.6) | 33.4 (30.1, 36.8) | 0.029 |
| No | 312 | 37.1 (30.6, 43.6) | 3511 | 17.3 (15.8, 18.8) | <0.001 | 34.6 (25.2, 44.0) | 17.2 (15.7, 18.6) | <0.001 |
| Occupational noise exposure |
||||||||
| Yes | 117 | 57.7 (45.9, 69.4) | 1475 | 32.3 (29.0, 35.6) | 0.001 | 51.4 (36.5, 66.4) | 33.0 (29.6, 36.4) | 0.010 |
| No | 254 | 34.7 (27.4, 41.9) | 3048 | 16.0 (14.4, 17.7) | <0.001 | 30.4 (19.6, 41.1) | 16.2 (14.6, 17.8) | 0.001 |
| Ototoxic medication use | ||||||||
| Yes | 101 | 40.7 (29.2, 52.1) | 514 | 27.3 (22.6, 32.0) | 0.031 | 17.7 (9.0, 26.4) | 25.0 (20.2, 29.8) | 0.153 |
| No | 298 | 42.8 (36.2, 49.4) | 4227 | 20.7 (19.3, 22.1) | <0.001 | 42.3 (32.7, 51.9) | 21.3 (19.9, 22.8) | <0.001 |
| Current Smoker | ||||||||
| Yes | 94 | 52.7 (41.9, 63.5) | 1251 | 23.2 (19.9, 26.5) | <0.001 | 56.5 (43.5, 69.4) | 24.2 (20.9, 27.4) | 0.002 |
| No | 305 | 38.9 (31.9, 45.8) | 3485 | 20.8 (19.2, 22.4) | <0.001 | 29.3 (18.6, 40.0) | 20.7 (19.1, 22.3) | 0.003 |
CI=Confidence Interval
Age-adjusted to 2000 US Census
Column totals may not add due to missing data on the covariates
Footnotes
Publisher's Disclaimer: “This is the pre-publication, author-produced version of a manuscript accepted for publication in Annals of Internal Medicine. This version does not include post-acceptance editing and formatting. The American College of Physicians, the publisher of Annals of Internal Medicine, is not responsible for the content or presentation of the author-produced accepted version of the manuscript or any version that a third party derives from it. Readers who wish to access the definitive published version of this manuscript and any ancillary material related to this manuscript (correspondence, corrections, editorials, linked articles, etc…) should go to www.annals.org or to the print issue in which the article appears. Those who cite this manuscript should cite the published version, as it is the official version of record.”
References
- 1.Pleis JR, Lethbridge-Cejku M. Summary health statistics for U.S. adults: National Health Interview Survey 2005. Vital Health Stat 10. 2006;(232):1–153. [PubMed] [Google Scholar]
- 2.Cruickshanks KJ, Tweed TS, Wiley TL, et al. The 5-year incidence and progression of hearing loss: the epidemiology of hearing loss study. Arch Otolaryngol Head Neck Surg. 2003;129(10):1041–1046. doi: 10.1001/archotol.129.10.1041. [DOI] [PubMed] [Google Scholar]
- 3.Muhr P, Mansson B, Hellstrom PA. A study of hearing changes among military conscripts in the Swedish Army. Int J Audiol. 2006;45(4):247–251. doi: 10.1080/14992020500190052. [DOI] [PubMed] [Google Scholar]
- 4.Dalton DS, Cruickshanks KJ, Wiley TL, Klein BE, Klein R, Tweed TS. Association of leisure-time noise exposure and hearing loss. Audiology. 2001;40(1):1–9. [PubMed] [Google Scholar]
- 5.Cruickshanks KJ, Klein R, Klein BE, Wiley TL, Nondahl DM, Tweed TS. Cigarette smoking and hearing loss: the epidemiology of hearing loss study. Jama. 1998;279(21):1715–1719. doi: 10.1001/jama.279.21.1715. [DOI] [PubMed] [Google Scholar]
- 6.Cruickshanks KJ, Wiley TL, Tweed TS, et al. Prevalence of hearing loss in older adults in Beaver Dam, Wisconsin. The Epidemiology of Hearing Loss Study. Am J Epidemiol. 1998;148(9):879–886. doi: 10.1093/oxfordjournals.aje.a009713. [DOI] [PubMed] [Google Scholar]
- 7.Dalton DS, Cruickshanks KJ, Klein BE, Klein R, Wiley TL, Nondahl DM. The impact of hearing loss on quality of life in older adults. Gerontologist. 2003;43(5):661–668. doi: 10.1093/geront/43.5.661. [DOI] [PubMed] [Google Scholar]
- 8.Strawbridge WJ, Cohen RD, Shema SJ, Kaplan GA. Successful aging: predictors and associated activities. Am J Epidemiol. 1996;144(2):135–141. doi: 10.1093/oxfordjournals.aje.a008900. [DOI] [PubMed] [Google Scholar]
- 9.National Institute of Diabetes and Digestive and Kidney Diseases. (U.S. Department of Health and Human Services, National Institute of Health) National Diabetes Statistics fact sheet: general information and national estimates on diabetes in the United States, 2005. 2005
- 10.Cowie CC, Rust KF, Byrd-Holt DD, et al. Prevalence of diabetes and impaired fasting glucose in adults in the U.S. population: National Health And Nutrition Examination Survey 1999–2002. Diabetes Care. 2006;29(6):1263–1268. doi: 10.2337/dc06-0062. [DOI] [PubMed] [Google Scholar]
- 11.National Diabetes Data Group (U.S.), National Institute of Diabetes and Digestive and Kidney Diseases (U.S.), National Institutes of Health (U.S.) Bethesda, Md: National Institutes of Health, National Institute of Diabetes and Digestive and Kidney Diseases; Diabetes in America. (2nd ed) 1995 NIH publication ; no. 95–1468.
- 12.Makishima K, Tanaka K. Pathological changes of the inner ear and central auditory pathway in diabetics. Ann Otol Rhinol Laryngol. 1971;80(2):218–228. doi: 10.1177/000348947108000208. [DOI] [PubMed] [Google Scholar]
- 13.Jorgensen MB. The inner ear in diabetes mellitus. Histological studies. Arch Otolaryngol. 1961;74:373–381. doi: 10.1001/archotol.1961.00740030382003. [DOI] [PubMed] [Google Scholar]
- 14.Friedman SA, Schulman RH, Weiss S. Hearing and diabetic neuropathy. Arch Intern Med. 1975;135(4):573–576. [PubMed] [Google Scholar]
- 15.Axelsson A, Sigroth K, Vertes D. Hearing in diabetics. Acta Otolaryngol Suppl. 1978;Vol. 356:1–23. [PubMed] [Google Scholar]
- 16.Taylor IG, Irwin J. Some audiological aspects of diabetes mellitus. J Laryngol Otol. 1978;92(2):99–113. doi: 10.1017/s0022215100085108. [DOI] [PubMed] [Google Scholar]
- 17.Kurien M, Thomas K, Bhanu TS. Hearing threshold in patients with diabetes mellitus. J Laryngol Otol. 1989;103(2):164–168. doi: 10.1017/s0022215100108345. [DOI] [PubMed] [Google Scholar]
- 18.Erdem T, Ozturan O, Miman MC, Ozturk C, Karatas E. Exploration of the early auditory effects of hyperlipoproteinemia and diabetes mellitus using otoacoustic emissions. Eur Arch Otorhinolaryngol. 2003;260(2):62–66. doi: 10.1007/s00405-002-0519-1. [DOI] [PubMed] [Google Scholar]
- 19.Ishii EK, Talbott EO, Findlay RC, D'Antonio JA, Kuller LH. Is NIDDM a risk factor for noise-induced hearing loss in an occupationally noise exposed cohort? Sci Total Environ. 1992;127(1–2):155–165. doi: 10.1016/0048-9697(92)90474-7. [DOI] [PubMed] [Google Scholar]
- 20.Dalton DS, Cruickshanks KJ, Klein R, Klein BE, Wiley TL. Association of NIDDM and hearing loss. Diabetes Care. 1998;21(9):1540–1544. doi: 10.2337/diacare.21.9.1540. [DOI] [PubMed] [Google Scholar]
- 21.Helzner EP, Cauley JA, Pratt SR, et al. Race and sex differences in age-related hearing loss: the Health, Aging and Body Composition Study. J Am Geriatr Soc. 2005;53(12):2119–2127. doi: 10.1111/j.1532-5415.2005.00525.x. [DOI] [PubMed] [Google Scholar]
- 22.Axelsson A, Eliasson A, Israelsson B. Hearing in pop/rock musicians: a follow-up study. Ear Hear. 1995;16(3):245–253. doi: 10.1097/00003446-199506000-00001. [DOI] [PubMed] [Google Scholar]
- 23.Tambs K, Hoffman HJ, Borchgrevink HM, Holmen J, Samuelsen SO. Hearing loss induced by noise, ear infections, and head injuries: results from the Nord-Trondelag Hearing Loss Study. Int J Audiol. 2003;42(2):89–105. doi: 10.3109/14992020309078340. [DOI] [PubMed] [Google Scholar]
- 24.Gelfand SA. Essentials of audiology. 2nd ed. New York: Thieme; 2001. [Google Scholar]
- 25.Sakuta H, Suzuki T, Yasuda H, Ito T. Type 2 diabetes and hearing loss in personnel of the Self-Defense Forces. Diabetes Res Clin Pract. 2007;75(2):229–234. doi: 10.1016/j.diabres.2006.06.029. [DOI] [PubMed] [Google Scholar]
- 26.Gates GA, Cobb JL, D'Agostino RB, Wolf PA. The relation of hearing in the elderly to the presence of cardiovascular disease and cardiovascular risk factors. Arch Otolaryngol Head Neck Surg. 1993;119(2):156–161. doi: 10.1001/archotol.1993.01880140038006. [DOI] [PubMed] [Google Scholar]
- 27.Ma F, Gomez-Marin O, Lee DJ, Balkany T. Diabetes and hearing impairment in Mexican American adults: a population-based study. J Laryngol Otol. 1998;112(9):835–839. doi: 10.1017/s0022215100141842. [DOI] [PubMed] [Google Scholar]
- 28.Kasemsuwan L, Sriwanyong S, Krittiyawong S, Sunetrworakul J, Jiamsuchon K. Hearing in young diabetic patients. J Med Assoc Thai. 2001;84(10):1389–1394. [PubMed] [Google Scholar]
- 29.Ciulla TA, Amador AG, Zinman B. Diabetic retinopathy and diabetic macular edema: pathophysiology, screening, and novel therapies. Diabetes Care. 2003;26(9):2653–2664. doi: 10.2337/diacare.26.9.2653. [DOI] [PubMed] [Google Scholar]
- 30.Fukushima H, Cureoglu S, Schachern PA, et al. Cochlear changes in patients with type 1 diabetes mellitus. Otolaryngol Head Neck Surg. 2005;133(1):100–106. doi: 10.1016/j.otohns.2005.02.004. [DOI] [PubMed] [Google Scholar]
- 31.Sasso FC, Salvatore T, Tranchino G, et al. Cochlear dysfunction in type 2 diabetes: a complication independent of neuropathy and acute hyperglycemia. Metabolism. 1999;48(11):1346–1350. doi: 10.1016/s0026-0495(99)90141-5. [DOI] [PubMed] [Google Scholar]
- 32.Makishima K. Arteriolar sclerosis as a cause of presbycusis. Otolaryngology. 1978;86(2):ORL322–ORL326. doi: 10.1177/019459987808600225. [DOI] [PubMed] [Google Scholar]
- 33.Marshall JD, Beck S, Maffei P, Naggert JK. Alstrom syndrome. Eur J Hum Genet. 2007;15(12):1193–1202. doi: 10.1038/sj.ejhg.5201933. [DOI] [PubMed] [Google Scholar]
- 34.Minton JA, Rainbow LA, Ricketts C, Barrett TG. Wolfram syndrome. Rev Endocr Metab Disord. 2003;4(1):53–59. doi: 10.1023/a:1021875403463. [DOI] [PubMed] [Google Scholar]
- 35.Maassen JA, LM TH, Van Essen E, et al. Mitochondrial diabetes: molecular mechanisms and clinical presentation. Diabetes. 2004;53 Suppl 1:S103–S109. doi: 10.2337/diabetes.53.2007.s103. [DOI] [PubMed] [Google Scholar]
- 36.Gates GA, Schmid P, Kujawa SG, Nam B, D'Agostino R. Longitudinal threshold changes in older men with audiometric notches. Hear Res. 2000;141(1–2):220–228. doi: 10.1016/s0378-5955(99)00223-3. [DOI] [PubMed] [Google Scholar]
- 37.Bagai A, Thavendiranathan P, Detsky AS. Does this patient have hearing impairment? JAMA. 2006;295(4):416–428. doi: 10.1001/jama.295.4.416. [DOI] [PubMed] [Google Scholar]
- 38.Yueh B, Shapiro N, MacLean CH, Shekelle PG. Screening and management of adult hearing loss in primary care: scientific review. JAMA. 2003;289(15):1976–1985. doi: 10.1001/jama.289.15.1976. [DOI] [PubMed] [Google Scholar]
- 39.Bogardus ST, Jr, Yueh B, Shekelle PG. Screening and management of adult hearing loss in primary care: clinical applications. JAMA. 2003;289(15):1986–1990. doi: 10.1001/jama.289.15.1986. [DOI] [PubMed] [Google Scholar]