

Abstract
Background
Health benefits of an active lifestyle are well established. However, Americans in general and American Indians specifically are not sufficiently active to achieve health benefits.
Purpose
This study presents the descriptive epidemiology of physical activity in a community-based sample of American-Indian adults.
Methods
Data came from Education and Research Towards Health (EARTH), a cross-sectional study conducted between December 2003 and April 2006 of 5,207 American Indian adults in South Dakota and Arizona. Physical activity was assessed using a culturally tailored, computer-assisted instrument. Both type and intensity of activities were measured; minutes per week averaged over the past year was the primary outcome. Individuals were categorized as being sufficiently active, not sufficiently active, or inactive using a cut-point of more or less than 150 minutes/week. Information on age, gender, and BMI was also collected.
Results
More than one third of participants were not sufficiently active (<150 minutes/week) and 18% reported no leisure-time activity. Sufficient activity was less often reported by women than men (41% vs 56%) and participants from the Southwest than the Northern Plains (44% vs 50%). Household activities constituted the largest amount of activity among all participants. There were clear trends in physical (in)activity across BMI strata; time spent in sedentary activities increased while leisure-time activity decreased with BMI.
Conclusions
American Indian adults in this cohort exhibited levels of physical (in)activity similar to other race/ethnic groups in the U.S., suggesting a need for specific interventions to increase activity levels across the population.
INTRODUCTION
The health benefits of an active lifestyle are well established.1–4 However, the majority of the U.S. population does not engage in a level of physical activity that is consistent with recommendations to achieve these health benefits.5 Particularly disconcerting is the large proportion of individuals who remain completely inactive in their leisure time. The most recent national estimate is that one in four adults engage in no leisure-time physical activity.6 Members of underrepresented race/ethnic groups, including American Indians, are less likely to meet physical activity recommendations,7 and more likely to report leisure-time physical inactivity,6 than their non-Hispanic, white counterparts. This discrepancy is particularly relevant to public health because an overarching goal of Healthy People 2010 is to reduce health disparities among racial/ethnic groups.8 For example, recent monitoring data for the Healthy People initiative indicate that roughly 46% of American-Indian compared to 33% of white adults reported no leisure-time physical activity over the years 1997–2006. With a goal to reduce the proportion of adults who engage in no leisure-time physical activity to 20%, there are clearly still large disparities among racial/ethnic groups in reaching this target.
The goal of the Education and Research Towards Health (EARTH) cohort study of American Indians and Alaska Natives was to determine how diet, physical activity, and other lifestyle and cultural factors relate to chronic diseases. The Black Hills Center for American Indian Health (BHCAIH), one of the EARTH project grantees, worked with local communities in South Dakota and Arizona to develop site-specific, culturally appropriate questionnaires to accurately capture pertinent behaviors and cultural factors. EARTH participants in these regions are part of the Lakota and Pima/Maricopa cultural groups, respectively, with fundamental differences between the two. In addition to the strikingly different environment in each region, the Lakota were traditionally nomadic hunter–gatherers versus the largely agrarian Pima/Maricopa. The Lakota are also described as patrilineal as opposed to the matrilineal Pima/Maricopa.
This study describes the epidemiology of physical activity among 5,207 participants enrolled in EARTH in these two areas. The objectives were to determine: (1) average amounts of physical activity performed within five categories (e.g., leisure time, sedentary, household); (2) how physical activity patterns differ by gender, region, BMI, and age; and (3) how levels of physical activity compare to the reported levels in the general population.
METHODS
Data Source and Collection
Data for this study were derived from the EARTH cohort, a study of 5,207 individuals examined by BHCAIH 18 to 82 years residing on the Oglala Sioux9 (n=2,025) and Cheyenne River Sioux10 (n=1,528) reservations in South Dakota, and the Gila River Indian Community11 (n=1,654) in Arizona. Funded by the National Cancer Institute, EARTH was designed to examine demographic, dietary, behavioral, and cultural factors associated with cancer and chronic diseases among American Indians and Alaska Natives. A detailed description of the design and implementation of EARTH has been previously published.12 The study was approved by each participating tribe, and both the Phoenix and Aberdeen Area Indian Health Service IRBs. Recruitment for EARTH was accomplished using print and radio advertising, community presentations, and word-of-mouth. The Northern Plains cohort was age-representative within 5% to 5-year age cohorts of the U.S. 2000 Census among self-identified American Indians within the same counties, which in this situation are wholly contained within both reservation boundaries. Overall, approximately one third of all adults on the three participating reservations and communities were included in EARTH.
At baseline, conducted from December 2003 to April 2006, participants provided written informed consent, completed comprehensive, computerized questionnaires using computer-aided self-interviewing technology,13 and underwent anthropomorphic measurements and laboratory testing. They also completed an exit interview, and then received individual feedback consisting of a health report at the conclusion of the visit. Participants were also given small incentives; the value of these items varied by site but was approximately $20–$30.
The questionnaire collected information on participants’ demographics, dietary history, health history, physical activity, and cultural identity. Clinical data included anthropometric measurements, automated blood pressure measurement, and fasting lipid and glucose levels.
Physical Activity Instrument
A detailed physical activity questionnaire adapted from the Cross-Cultural Activity Participation Study14 was developed to collect data on activity performed at various levels of intensity over the past year. The questionnaire has two sections. The first section asks about the frequency and duration of seven different activities done in a typical week in the past month. These activities, which are believed to be relatively stable over a year’s time, include household chores, child, elder or dependent care, driving or riding in a motorized vehicle, sitting or reclining and watching TV, and reading, sewing, beading, carving, or using a computer. The second section asks about 21 broad activities done for more than 10 minutes at a time in the past year. Yes responses prompt queries on frequency and duration of the activities. This list of activities was intended to encompass the major sources of physical activity by American Indian and Alaska Native populations, including activities performed during leisure time, around the home, and at a paid job. The instrument has acceptable validity (mean hours of moderate and vigorous physical activity against pedometer counts; r=0.29 and 0.65, respectively) and test–retest reliability (mean hours of moderate and vigorous physical activity at baseline and 1 month later; r=0.76 and 0.67, respectively) (M. Murtaugh, University of Utah, unpublished data, 2007).
Definitions of Physical Activity Categories
Individuals were categorized as being sufficiently active, not sufficiently active, or inactive using a cut-point of more or less than 150 minutes/week of physical activity, or no reported activity, during leisure time. The 150-minutes/week physical activity threshold corresponds to the minimum level recommended to achieve or maintain health benefits.15 Estimates of physical activity were calculated separately as minutes per week averaged over the past year in five categories. These categories were developed to correspond to the major types of activities described in the Compendium of Physical Activities,16 including those considered sedentary, occupational, leisure-time, household, and hunting/fishing type activities.
Each activity was also weighted by its relative metabolic cost using the appropriate value in the Compendium,16 its MET, thereby deriving MET-hours per week as the final unit of expression. One MET represents the energy expenditure for an individual at rest, whereas a 10-MET activity requires 10 times the resting energy expenditure. For example, light effort household chores such as dusting or straightening up is about 2.5 METs, whereas playing basketball is about 6.0 METs. The data were examined using normality plots and frequency distributions to determine outliers and implausible responses. In most cases, no more than the upper 1% of the distribution was discarded, representing, for example, more than 18 hours of activity in a given day.
Statistical Analysis
Demographic characteristics and physical activity data were described using means and SEs for continuous variables and percentages and 95% CIs for categoric variables. Regression models were fitted to compare physical activity levels separately between gender groups within each region adjusted for age. There were multiple instances of missing values for income, employment status, and/or education, making comparisons between adjusted and unadjusted models inappropriate. Thus, these demographic factors were not included in regression analyses. Regression models were used to compare physical activity levels between the two regions controlling for age and gender. To test trends in physical activity levels across age groups, regression models were constructed that included gender and region as covariates. An interaction term for gender by age groups was also included to examine if there were male–female differences across the age groups; the interaction term was maintained in the model if it was significant. Regression models were used to estimate mean levels of physical activity with corresponding 95% CIs for each BMI group and to test trends across BMI groups adjusted for age, gender, and region. Both average time (minutes/week) and intensity-weighted time (MET-hours/week) were analyzed. Data were analyzed in 2007–2009 using STATA Version 9.0.
RESULTS
Descriptive characteristics
Physical activity data were available from 4,911 of the 5,207 adults examined by the BHCIAH. However, the number of data points available for some physical activity categories was less than 4,911 because of differential missing values, ranging from three to 258 when examined over physical activity categories. There were more women than men (55% vs 45%), and more participants from the Northern Plains than the Southwest (67% vs 33%). The mean ages were 37 years for participants from the Northern Plains and 36 years in the Southwest (range 18–82 years). Overall, more than one third of participants were married or living as married, with more participants from the Southwest reporting never married. The educational level of the two geographic centers differed, with a greater proportion of Northern Plains’ participants reporting both graduating from high school and some college experience. Lastly, about 20% of participants were employed and nearly 40% of participating households reported an annual household income less than $5,000.
Prevalence of leisure-time physical (in)activity
The proportion of participants who were sufficiently active, not sufficiently active, or inactive during leisure time is presented in Table 1. Overall, more than one third of participants were classified as not sufficiently active and 18% reported no activity during leisure time. The distribution of physical activity levels differed significantly (Ps < 0.05) by gender and region. Fewer women were sufficiently active than men (41% vs 56%) and more women than men were inactive (20% vs 15%) during leisure time. Fewer participants were sufficiently active in the Southwest than in the Northern Plains (44% vs 50%); about 18% of participants in the Northern Plains and Southwest were inactive during leisure time.
Table 1.
Percentage of EARTH Participants Sufficiently Active, Not Sufficiently Active, or Inactive During Leisure time by Gender and Region
| Leisure-time Physical Activity Levela | ||||||
|---|---|---|---|---|---|---|
| Sufficiently active | Not sufficiently active | No leisure-time activity | ||||
| Total | 48 | 46, 49 | 35 | 33, 36 | 18 | 17, 19 |
| Gender * | ||||||
| Male | 56 | 54, 58 | 29 | 27, 30 | 15 | 14, 17 |
| Female | 41 | 39, 43 | 39 | 38, 41 | 20 | 18, 21 |
| Region * | ||||||
| Northern Plains | 50 | 48, 51 | 32 | 31, 34 | 18 | 17, 20 |
| Southwest | 44 | 41, 46 | 39 | 37, 41 | 17 | 15, 19 |
Indicates significant difference in percentage distribution by gender and region (P < 0.05 by x2 analysis).
Sufficiently active defined as greater than or equal to 150 minutes/week of total physical activity of any intensity during leisure time; not sufficiently active defined as less than 150 minutes/week of total physical activity but greater than 0 during leisure time.
Data are presented as percentage (%) with 95% CI.
Amount of physical activity by category
Participants spent an average of 1,337 minutes/week, or roughly 3 hours/day, on sedentary activities. An average of 1,782 minutes/week, or about 4 hours/day, was spent on household activities. When expressed as an intensity-weighted level, physical activities in the household category were by far the largest source of energy expenditure; household physical activity expressed as MET-hours/week was 3.3-fold higher than leisure-time physical activity, the next highest category (89.9 vs 26.8 MET-hours/week, respectively).
Unadjusted levels of occupational, leisure-time, and hunting and fishing activities were higher, and household levels were lower, in men than women in both regions (Table 2, P<0.05). The patterns remained similar after adjusting for age. The average amount of time spent in sedentary activities was lower in men than women in the Northern Plains in both age-adjusted and unadjusted models (P<0.05). However, in the Southwest men spent more time in sedentary activities than women, although this was no longer significant after adjusting for age (P=0.06). When examined by region overall, participants in the Northern Plains had higher levels of leisure-time and hunting and fishing activities, and lower mean levels of sedentary and household activities than those in the Southwest (P<0.05). However, after adjusting for age and gender, levels of participation in household activities were no longer significantly lower in the Northern Plains than in the Southwest regions. Occupational activities did not differ among regions in both unadjusted and adjusted models. The results were nearly identical when activity was expressed as MET-hours/week with one exception; intensity-weighted sedentary activity was not different by gender in the Southwest region as was the case when expressed as average time in minutes/week.
Table 2.
Unadjusted Average Time (minutes/week) in each of Five Main Categories of Physical Activity by Gender within each Region
| Region | ||||||
|---|---|---|---|---|---|---|
| Northern Plains | Southwest | |||||
| Category | Men | Women | Overall | Men | Women | Overall |
| Sedentary *,**,*** | 1,220 (30) | 1,310 (29) | 1,267 (21) | 1,550 (48) | 1,427 (39) | 1,477 (30) |
| Occupational *,** | 368 (22) | 169 (14) | 264 (13) | 431 (37) | 183 (19) | 284 (19) |
| Leisure time *,**,*** | 523 (17) | 273 (11) | 392 (10) | 403 (23) | 254 (14) | 315 (13) |
| Household *,**,*** | 1,466 (41) | 2,008 (45) | 1,746 (31) | 1,587 (62) | 2,043 (59) | 1,854 (43) |
| Hunting and fishing*,**,*** | 60 (6) | 14 (2) | 36 (3) | 19 (5) | 3 (1) | 9 (2) |
Indicates significant difference in physical activity category by gender in Northern Plains when unadjusted (P < 0.05).
Indicates significant difference in physical activity category by gender in Southwest when unadjusted (P < 0.05).
Indicates significant difference in physical activity category by Region when unadjusted (P < 0.05).
Data are M (SE).
Trends in activity levels as a function of age were relatively consistent; unadjusted mean levels of occupational, leisure-time, household, and hunting and fishing activities all declined across age groups (Table 3, P<0.05). A similar pattern was also found with respect to household activities and hunting and fishing activities after adjusting for gender and region. No gender difference was found for these two activity categories across age groups. For occupational activities, levels for men and women differed across age groups as evidenced by a significant age by gender interaction (P=0.02). The trend for men was significant across age groups (P<0.01) while the trend for women was not (P=0.11). Men and women also differed with respect to leisure time activities across age groups (age by gender interaction P<0.01). The decline was greater for men than women. The results were unchanged when expressed as MET-hours/week. Clear trends emerged in physical activity patterns across BMI strata. For example, average intensity-weighted time in leisure-time activities decreased systematically as a function of increasing BMI even after adjusting for age, gender, and region, (Fig. 1, P<0.01). Similarly, trends for occupational and hunting and fishing activities were significant after adjusting for age, gender, and region (P<0.05). However, trends for sedentary and household activities were significant in unadjusted models only (P>0.05). Figure 1 also illustrates the general pattern; the average intensity-weighted time spent in sedentary activities increased as a linear function of BMI category, although this was not significant after adjustment.
Table 3.
Comparison of Unadjusted Average Time (minutes/week) in each of Five Main Categories of Physical Activity by Age Group
| Age group | ||||||
|---|---|---|---|---|---|---|
| Category | 17–29 | 30–39 | 40–49 | 50–59 | 60–69 | 70+ |
| Sedentary | 1, 315 (28) | 1,379 (35) | 1, 447 (40) | 1, 292 (54) | 1, 160 (66) | 961 (78) |
| Occupational * | 259 (17) | 369 (26) | 300 (24) | 188 (27) | 70 (23) | 48 (27) |
| Leisure time * | 484 (15) | 357 (16) | 323 (17) | 229 (19) | 143 (17) | 153 (35) |
| Household * | 2, 045 (45) | 1, 982 (53) | 1, 669 (52) | 1,351 (64) | 950 (62) | 841 (107) |
| Hunting and fishing * | 31 (4) | 26 (3) | 36 (7) | 15 (4) | 7 (2) | 4 (1) |
Indicates significant difference in physical activity category by age group when unadjusted (P < 0.05 by linear trend).
Data are M (SE).
Figure 1.
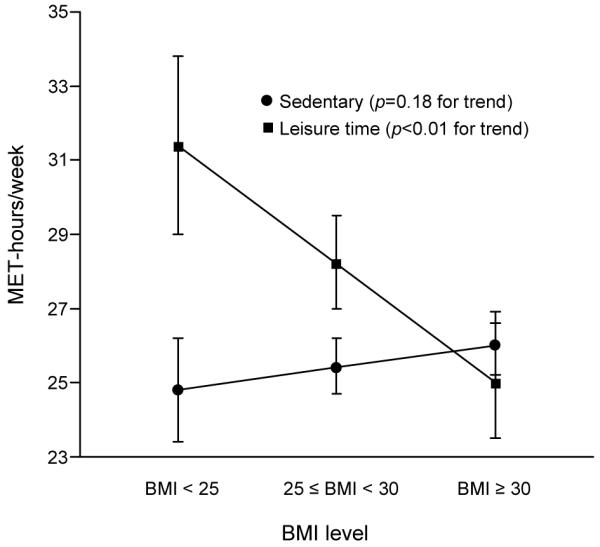
Adjusted intensity-weighted time (MET-hours/week) spent in sedentary and leisure-time physical activity according to levels of BMI
DISCUSSION
This cohort of American Indians was no more sedentary than other race/ethnic groups in the U.S. surveyed in the Behavioral Risk Factor Surveillance System (BRFSS). Indeed, 18% of the cohort engaged in no leisure-time physical activity, which is far less than figures reported in other studies of American Indian adults based on BRFSS. In one report, 33% of American Indian/Alaska Native adults reported no leisure-time physical activity.17 In another, estimates varied by gender, ranging from 36% to 24%.6 The estimate of no leisure-time physical activity in the present study is even lower than the 28% observed for non-Native individuals in the former report. Similarly, the prevalence of no leisure-time physical activity in the present study was lower than in the Inter-Tribal Heart Project,18 where 33% of women and 21% of men reported no leisure-time activity. Lastly, in the Strong Heart Study,19 total physical activity levels (occupational plus leisure-time activity) were higher in men (37%) and women (85%), and among participants from the Dakotas (83%) and Arizona (13.5%), compared with comparable combined occupational and leisure-time categories by gender and region in this cohort.
These discrepancies are most likely due to differences in sampling procedures, physical activity instruments used, and scoring procedures in the various studies. For example, BRFSS is a random-digit telephone survey whereas EARTH was a large, community-based sample of American Indians. Telephone surveys among American Indians might introduce a bias in that individuals with higher SES are over-represented.20,21 Further, telephone surveys exclude certain segments of this population because telephone coverage varies greatly among American Indian households in both urban and rural areas.22,23 In addition, activity data are based on responses to a single question in BRFSS whereas participants in EARTH completed a comprehensive, computerized questionnaire. Great care was taken to develop a culturally appropriate instrument that included activities common to traditional and contemporary American Indian and Alaska Native peoples. Finally, the estimate of leisure-time physical activity was not restricted to moderate-intensity activities. Instead, a total leisure-time physical activity score was calculated that included a variety of lower-intensity activities such as stretching/hatha yoga (2.5 METs) and bowling (3.0 METs). There were over 25 individual activities within the leisure-time category of the instrument. Despite the differences noted above, activity patterns in this study were consistent with previous reports when examined by demographic characteristics such as gender and age among American Indians.24
Of all categories of physical activities, the most time was spent in the household category, which included activities such as mopping, sweeping, and the like. Using intensity-weighted values, this cohort also derived their greatest amount of energy expenditure by performing household activities. Although unusual, this is consistent with a previous report from another American Indian population.18 Poverty, unemployment or underemployment, low educational levels, and a large number of individuals living in the same household are features common to many Native communities. Many prior reports have linked education, unemployment and/or poverty to leisure-time inactivity.25–30 Unemployed individuals living on a reservation likely spend many hours per day at home, increasing the likelihood that they will perform household activities. High housing density, which is typical of many impoverished settings, may also explain the predominance of household activities. American Indian households tend to have a large number of infants and young children living in large multigenerational families, increasing the need for household activities. Lastly, the widespread gravel/dirt roads, weed-filled yards and lots, and often poorly controlled insects and rodents in these remote, rural, dry, and windswept locations likely create a need for cleaning-related activities.
Merely describing the customary activity patterns in American Indians is not a major reason for obtaining this type of data. Rather, physical activity data are important for linking health behaviors to health outcomes. As an example, the results demonstrate that average time spent in sedentary activities increased systematically with increasing BMI while leisure-time physical activity declined as a function of BMI, although the former was no longer significant after adjusting for covariates. Differences in physical activity in the Northern Plains and Southwest that parallels regional differences in BMI was also observed. Total amounts of time spent in leisure time were higher, and in sedentary activities lower, in the Northern Plains compared to the Southwest. In future studies by the current authors, these physical activity data will be used to examine relationships with a host of health conditions in this population.
A strength of this study includes the comprehensive way in which physical activity was assessed. This approach provided a more complete picture of physical activity patterns among American Indians than is discernable from existing data. The use of a computer assisted personal interview to assess physical activity may have reduced respondent burden and thus increased reliability. The large sample size also distinguishes it from nearly all prior studies of physical activity among American Indians. Finally, in the Northern Plains, the sampling strategy and age-representativeness make this effectively a population-based study.
This study also has several limitations. First and foremost, physical activity assessed with interviews or questionnaires may not accurately capture physical activity levels.31 A pedometer was used as the standard measure in these unpublished observations, which is problematic because a pedometer is not a gold standard, thus raising the possibility that the results are influenced by measurement bias. The analysis also does not take into account other social factors that may influence physical activity, including social support, acculturation, neighborhood safety, and the built environment.24 Third, the EARTH study used mixed sampling methods to achieve the desired overall target sample size in the Northern Plains and a random systematic household sampling strategy in Gila River Indian Community. Several of the tribal governments required that the study be open to all tribal members, not just those randomly selected. Fourth, results from EARTH participants may not be generalizable to nonreservation populations and American Indians living in other regions. Finally, it is not clear whether household activities result in mental and physical health benefits comparable to leisure-time physical activity, specifically exercise.
Conclusion
This study reveals that over one third of EARTH study participants did not meet current recommendations for physical activity and a high proportion was completely sedentary in their leisure time. Household activities contributed the largest share of physical activity performed. This research also has public health implications. Although American Indians historically had very low rates of cardiovascular disease, today it is the leading cause of death in this population, exceeding rates in other U.S. populations.32 In most American Indian tribes, cardiovascular disease morbidity and mortality rates are increasing, fueled in part by the epidemic of obesity and type 2 diabetes in this population.32 The EARTH cohort is no exception to this general pattern. These parallel epidemics underscore the pressing need for further research into the relationships among physical activity and obesity, nutrition, and health outcomes such as cancer, type 2 diabetes, and CVD. In particular, the data demonstrate that activity patterns among American Indian adults differ by type, gender, age, and region. Thus, any lifestyle-based intervention in this population should consider these factors at a minimum in order to tailor programmatic advice to maximize compliance.
Grants and acknowledgments
The EARTH study was funded by the National Cancer Institute (1RO1 CA89139, J. Henderson, PI) and the analyses were supported by the National Cancer Institute (1U01 CA114642-01, D. Buchwald, PI). The contents of this manuscript are solely the responsibility of the authors and do not necessarily represent the official view of the National Cancer Institute. We would like to acknowledge the contributions and support of the Indian Health Service, the Cheyenne River Sioux Tribe, the Oglala Sioux Tribe, and the Gila River Indian Community; Tribal Advisory Board Members including Beverley Pigman, George Ridley, Ileen Sylvester, Tim Gilbert, Fritz George, Terry Pourier, and Jayme Longbrake; the staff associated with the Black Hills Center for American Indian Health including Joyce Colombe, Marcia O’Leary, Betty Jarvis, Dr. Patricia Nez Henderson, Dr. Marie Russell, Kurt Schweigman, Bert Lewis, Wendy Lawrence, Daniel Kougl, Marie Gross, Jay Kunf, Lauri Bickle, Francine Red Willow, Arie Shiroma, Lois Bettlyoun, Mary Merrivale, and Lillian Brown. We would also like to acknowledge James Bryner and Kelly Cunningham for computer programming; Omron Health Care Inc. who provided the Omron Hem 907 to the study at a reduced cost; and Sharlane Donaldson of Alaska Scientific, Inc., who assisted with development of the Cholestech protocol and staff training.
Footnotes
Publisher's Disclaimer: This is a PDF file of an unedited manuscript that has been accepted for publication. As a service to our customers we are providing this early version of the manuscript. The manuscript will undergo copyediting, typesetting, and review of the resulting proof before it is published in its final citable form. Please note that during the production process errors may be discovered which could affect the content, and all legal disclaimers that apply to the journal pertain.
No financial disclosures were reported by the authors of this paper.
References
- 1.Paffenbarger RS, Jr., Hyde RT, Wing AL, Hsieh CC. Physical activity, all-cause mortality, and longevity of college alumni. N Engl J Med. 1986;314:605–13. doi: 10.1056/NEJM198603063141003. [DOI] [PubMed] [Google Scholar]
- 2.Leon AS, Connett J, Jacobs DR, Jr., Rauramaa R. Leisure-time physical activity levels and risk of coronary heart disease and death. The Multiple Risk Factor Intervention Trial. JAMA. 1987;258:2388–95. [PubMed] [Google Scholar]
- 3.Lee IM, Hsieh CC, Paffenbarger RS., Jr. Exercise intensity and longevity in men. The Harvard Alumni Health Study. JAMA. 1995;273:1179–84. [PubMed] [Google Scholar]
- 4.Wannamethee SG, Shaper AG. Physical activity in the prevention of cardiovascular disease: an epidemiological perspective. Sports Med. 2001;31:101–14. doi: 10.2165/00007256-200131020-00003. [DOI] [PubMed] [Google Scholar]
- 5.CDC Adult participation in recommended levels of physical activity — United States, 2001 and 2003. MMWR. 2005;54:1208–12. [PubMed] [Google Scholar]
- 6.CDC Trends in leisure-time physical inactivity by age, sex, and race/ethnicity — United States, 1994–2004. MMWR. 2005;54:991–4. [PubMed] [Google Scholar]
- 7.CDC REACH 2010 surveillance for health status in minority communities — United States, 2001–2002. MMWR. 2004;53:1–36. [PubMed] [Google Scholar]
- 8.USDHHS . Healthy People 2010: Understanding and Improving Health. 2nd ed. U.S. Government Printing Office; Washington, D.C.: Nov, 2000. [Google Scholar]
- 9.Oglala Sioux Tribe website [internet] Oglala Sioux Tribe, Pine Ridge Indian Reservation; Pine Ridge (SD): Aug 4, 2009. cited. Available from: http://oglalalakotanation.com/ [Google Scholar]
- 10.Cheyenne River Sioux Tribe website [internet] Cheyenne River Sioux Tribe, Cheyenne River Reservation; Eagle Butte (SD): Aug 4, 2009. cited. Available from: http://www.sioux.org/ [Google Scholar]
- 11.Gila River Indian Community website [internet] Gila River Indian Community, Gila River Reservation; Sacaton (AZ): Aug 4, 2009. cited. Available from: http://www.gilariver.org/ [Google Scholar]
- 12.Slattery ML, Schumacher MC, Lanier AP, et al. A prospective cohort of American Indian and Alaska Native people: study design, methods, and implementation. Am J Epidemiol. 2007;166:606–15. doi: 10.1093/aje/kwm109. [DOI] [PMC free article] [PubMed] [Google Scholar]
- 13.Edwards SL, Slattery ML, Murtaugh MA, et al. Development and Use of Touch-Screen Audio Computer-assisted Self-Interviewing in a Study of American Indians. Am J Epidemiol. 2007;165:1336–42. doi: 10.1093/aje/kwm019. [DOI] [PubMed] [Google Scholar]
- 14.Ainsworth BE, Irwin ML, Addy CL, Whitt MC, Stolarczyk LM. Moderate physical activity patterns of minority women: the Cross-Cultural Activity Participation Study. J Womens Health Gend Based Med. 1999;8:805–13. doi: 10.1089/152460999319129. [DOI] [PubMed] [Google Scholar]
- 15.USDHHS . Physical activity and health: a report of the Surgeon General. USDHHS, CDC, National Center for Chronic Disease Prevention and Health Promotion; Atlanta: 1996. [Google Scholar]
- 16.Ainsworth BE, Haskell WL, Whitt MC, et al. Compendium of physical activities: an update of activity codes and MET intensities. Med Sci Sports Exerc. 2000;32:S498–504. doi: 10.1097/00005768-200009001-00009. [DOI] [PubMed] [Google Scholar]
- 17.Denny CH, Holtzman D, Cobb N. Surveillance for health behaviors of American Indians and Alaska Natives. Findings from the Behavioral Risk Factor Surveillance System, 1997–2000. MMWR Surveill Summ. 2003;52:1–13. [PubMed] [Google Scholar]
- 18.Fischer ID, Brown DR, Blanton CJ, Casper ML, Croft JB, Brownson RC. Physical activity patterns of Chippewa and Menominee Indians: the Inter-Tribal Heart Project. Am J Prev Med. 1999;17:189–97. doi: 10.1016/s0749-3797(99)00073-2. [DOI] [PubMed] [Google Scholar]
- 19.Yurgalevitch SM, Kriska AM, Welty TK, Go O, Robbins DC, Howard BV. Physical activity and lipids and lipoproteins in American Indians ages 45–74. Med Sci Sports Exerc. 1998;30:543–9. doi: 10.1097/00005768-199804000-00012. [DOI] [PubMed] [Google Scholar]
- 20.Pearson D, Cheadle A, Wagner E, Tonsberg R, Psaty BM. Differences in sociodemographic, health status, and lifestyle characteristics among American Indians by telephone coverage. Prev Med. 1994;23:461–4. doi: 10.1006/pmed.1994.1063. [DOI] [PubMed] [Google Scholar]
- 21.Ponce NA, Lavarreda SA, Yen W, Brown ER, DiSogra C, Satter DE. The California Health Interview Survey 2001: translation of a major survey for California’s multiethnic population. Public Health Rep. 2004;119:388–95. doi: 10.1016/j.phr.2004.05.002. [DOI] [PMC free article] [PubMed] [Google Scholar]
- 22.U.S. Census Bureau . Phoneless in America. U.S. Department of Commerce, Bureau of the Census; Washington, D.C.: 1994. Bureau of the Census Statistical Brief (SB/94-16) [Google Scholar]
- 23.U.S. Department of Commerce . Falling through the net: defining the digital divide. National Telecommunications and Information Administration, U.S. Department of Commerce; Washington, D.C.: 1999. [Google Scholar]
- 24.Coble JD, Rhodes RE. Physical activity and Native Americans: a review. Am J Prev Med. 2006;31:36–46. doi: 10.1016/j.amepre.2006.03.004. [DOI] [PubMed] [Google Scholar]
- 25.Crespo CJ, Ainsworth BE, Keteyian SJ, Heath GW, Smit E. Prevalence of physical inactivity and its relation to social class in U.S. adults: results from the Third National Health and Nutrition Examination Survey, 1988–1994. Med Sci Sports Exerc. 1999;31:1821–7. doi: 10.1097/00005768-199912000-00019. [DOI] [PubMed] [Google Scholar]
- 26.Crespo CJ, Smit E, Andersen RE, Carter-Pokras O, Ainsworth BE. Race/ethnicity, social class and their relation to physical inactivity during leisure time: results from the Third National Health and Nutrition Examination Survey, 1988–1994. Am J Prev Med. 2000;18:46–53. doi: 10.1016/s0749-3797(99)00105-1. [DOI] [PubMed] [Google Scholar]
- 27.Dias-da-Costa JS, Hallal PC, Wells JC, et al. Epidemiology of leisure-time physical activity: a population-based study in southern Brazil. Cad Saude Publica. 2005;21:275–82. doi: 10.1590/s0102-311x2005000100030. [DOI] [PubMed] [Google Scholar]
- 28.Droomers M, Schrijvers CT, Mackenbach JP. Educational level and decreases in leisure time physical activity: predictors from the longitudinal GLOBE study. J Epidemiol Community Health. 2001;55:562–8. doi: 10.1136/jech.55.8.562. [DOI] [PMC free article] [PubMed] [Google Scholar]
- 29.Hallal PC, Victora CG, Wells JC, Lima RC. Physical inactivity: prevalence and associated variables in Brazilian adults. Med Sci Sports Exerc. 2003;35:1894–1900. doi: 10.1249/01.MSS.0000093615.33774.0E. [DOI] [PubMed] [Google Scholar]
- 30.Yancey AK, Wold CM, McCarthy WJ, et al. Physical inactivity and overweight among Los Angeles County adults. Am J Prev Med. 2004;27:146–52. doi: 10.1016/j.amepre.2004.03.012. [DOI] [PubMed] [Google Scholar]
- 31.Montoye HJ, Kemper HCG, Saris WHM, Washburn RA. Measuring physical activity and energy expenditure. Human Kinetics; Champaign (IL): 1996. [Google Scholar]
- 32.Howard BV, Lee ET, Cowan LD, et al. Rising tide of cardiovascular disease in American Indians. The Strong Heart Study. Circulation. 1999;99:2389–95. doi: 10.1161/01.cir.99.18.2389. [DOI] [PubMed] [Google Scholar]