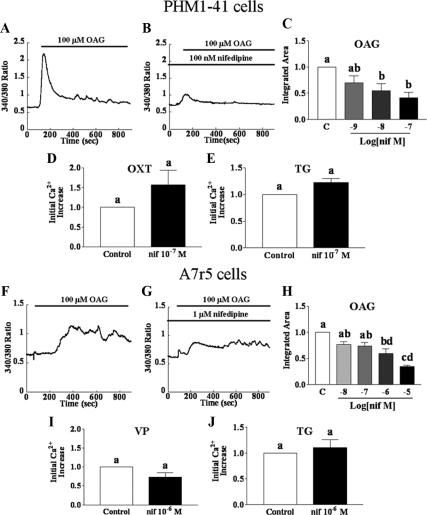
Figure 4.
Comparison of the effects of L-type channel blocker nifedipine on the effects of OAG-, oxytocin (OXT)-, vasopressin (VP)-, and thapsigargin (TG)-stimulated [Ca2+]i in PHM1-41 (panels A–E) and A7r5 cells (panels F–J). Where indicated, cells were pretreated with nifedipine for 5 min before the start of the experiments. Cells were stimulated with 100 μm OAG (panels A–C and F–H) in the presence of 1 mm extracellular Ca2+ or with 100 nm OXT (panel D, PHM1-41 cells) or VP (panel I; A7r5 cells) or 100 nm TG (panels E and J) in the absence of extracellular Ca2+, followed by addition of 1 mm extracellular Ca2+. Traces are the mean responses in 30–35 cells. Responses to OAG are reported as integrated [Ca2+]i increases over baseline for 15 min to take into account the delayed response in A7r5 cells. Responses to vasopressin, OXT, and TG were measured as mean amplitude of initial [Ca2+]i rise and expressed as percent of control (mean ± se, n = 3–4 dishes). Significant differences between groups are indicated by different lowercase letters.

