

Abstract
Solanum torvum Sw. cv. Torubamubiga (TB) is a low cadmium (Cd)-accumulating plant. To elucidate the molecular mechanisms of the Cd acclimation process in TB roots, transcriptional regulation was analysed in response to mild Cd treatment: 0.1 μM CdCl2 in hydroponic solution. A unigene set consisting of 6296 unigene sequences was constructed from 18 816 TB cDNAs. The distribution of functional categories was similar to tomato, while 330 unigenes were suggested to be TB specific. For expression profiling, the SuperSAGE method was adapted for use with Illumina sequencing technology. Expression tag libraries were constructed from Cd-treated (for 3 h, 1 d, and 3 d) and untreated roots, and 34 269 species of independent tags were collected. Moreover, 6237 tags were ascribed to the TB or eggplant (aubergine) unigene sequences. Time-course changes were examined, and 2049 up- and 2022 down-regulated tags were identified. Although no tags annotated to metal transporter genes were significantly regulated, a tag annotated to AtFRD3, a xylem-loading citrate transporter, was down-regulated. In addition to induction of heavy metal chaperone proteins, antioxidative and sulphur-assimilating enzymes were induced, confirming that oxidative stress developed even using a mild Cd concentration. Rapid repression of dehydration-related transcription factors and aquaporin isoforms suggests that dehydration stress is a potential constituent of Cd-induced biochemical impediments. These transcriptional changes were also confirmed by real-time reverse transcription-PCR. Further additions of TB unigene sequences and functional analysis of the regulated tags will reveal the molecular basis of the Cd acclimation process, including the low Cd-accumulating characteristics of TB.
Keywords: Cadmium, gene expression, Illumina sequencing, SAGE, Solanum torvum, Solexa sequencing, transcriptome
Introduction
Cadmium (Cd) is a heavy metal element harmful to human health. However, since the toxicity of Cd to plants is relatively low, Cd in the soil is taken up by crops and translocated to edible parts (Arao et al., 2008; Uraguchi et al., 2009). To prevent potential contamination and reduce the risk to human and animal health, the Codex Alimentarius Commission is planning to establish an international regulation of the Cd content in crops. Cd-polluted areas are easily found throughout the world (Uetani et al., 2006; Rodríguez et al., 2009), and the Cd content of crops harvested in such areas could exceed these limits. Techniques that reduce Cd content in crops are crucially important.
Solanum torvum Sw. cv. Torubamubiga (TB) has multiple resistance to Ralstonia solanacearum, Verticillium dahliae Klebahn, and Fusarium oxysporum f. sp. Melongenae, and is used as rootstock for eggplant (aubergine) cultivation in Japan. Cd content in the fruits of eggplant grafted onto TB grown in Cd-polluted soils were found to be significantly lower than those of eggplant grafted onto other species (Takeda et al., 2007; Arao et al., 2008). Low Cd translocation to the upper parts of TB is due to the low loading rate of Cd into the xylem sap in roots (Mori et al., 2009). In higher plants, several transporter proteins involved in heavy metal transport mechanisms have been identified in model plants (Mäser et al., 2001; Hall and Williams, 2003; Williams and Mills, 2005). In TB, however, knowledge of the molecular mechanism responsible for such unique Cd uptake and/or translocation characteristics is lacking.
So far, transcriptomic changes upon Cd stress have been investigated in several plant species, including Arabidopsis (Herbette et al., 2006; Weber et al., 2006), pea (Romero-Puertas et al., 2007), and barley (Tamás et al., 2008). Transcriptional regulation of several kinds of genes has been reported, related to antioxidative responses, sulphur metabolism, and some signal transduction pathways. In those reports, relatively high Cd concentrations (≥5 μM) were employed as Cd treatments. However, realistic acclimation events with minimized secondary effects could be observed by exposure to a physiologically mild level of Cd. To understand better the molecular bases of Cd metabolism and the related responses in TB, the time-course regulation of gene expression in TB roots in response to mild Cd treatment (0.1 μM CdCl2 in hydroponic solution) was analysed.
Expressed sequenced tags (ESTs) are one of the most basic resources for functional genetic research (Rudd, 2003). In the genus Solanum, tens of thousands of ESTs from tomato, potato, and pepper have been deposited in public databases, and the sets of expressed genes have been hypothesized (Quackenbush et al., 2001). In contrast, genomic information about TB is entirely absent. Therefore, the study began with collecting TB cDNA sequences expressed in either leaves or roots.
Microarray analysis is a standard technique for expression analysis in organisms with appreciable amounts of known genomic data. However, it is difficult to apply this technique to organisms with limited genomic information since only known genes can be spotted on the arrays, and undesirable heterologous hybridization cannot be avoided without a complete inventory of the set of expressed genes. The serial analysis of gene expression (SAGE) method is another powerful strategy for transcriptomic analysis (Velculescu et al., 1995), especially for organisms with limited genomic information such as TB. The SuperSAGE method is an improved version of the SAGE technique that is characterized by the generation of 26 bp tags by using the type III restriction enzyme EcoP15I (Matsumura et al., 2003). The recent emergence of second-generation sequencing technologies is dramatically changing many aspects of genomic research, including tag-based expression analysis. To date, high-throughput SAGE analysis can be carried out according to manufacturers’ protocols; for example, Illumina's Digital Gene Expression Tag Profiling (Hoen et al., 2008). The SuperSAGE method has also been improved through integration of the 454 sequencing technology (Matsumura et al., 2008). In this study, an attempt was made to apply the Illumina sequencing technology to the SuperSAGE method for transcriptomic profiling in Cd-stressed TB roots. This is the first report on the application of the SuperSAGE method in the Illumina sequencing format.
In this study, 6296 TB unigenes were generated by clustering and assembling 28 379 ESTs obtained from 18 816 cDNA clones. Functional annotations were assigned to the 6.3-K unigene set based on known plant sequences and utilized as the reference for comprehensive expression tag analysis. The time-course changes in gene expression in TB roots during physiologically mild Cd stress were analysed. The data presented here generally encompass the transcriptomic changes during the Cd acclimation process. More EST information will help to determine unlinked regulated tags and, together with functional analysis of regulated genes, document the molecular mechanisms of the Cd acclimation processes in TB, including low Cd translocation.
Materials and methods
Plant materials
Seeds of TB were sowed and cultivated for 30 d. Seedlings at around the three-leaf stage were transplanted and hydroponically grown for another 30 d. Culture medium consisted of 7.0 mM KNO3, 1.0 mM NH4H2PO4, 1.5 mM Ca(NO3)2·4H2O, 1.0 mM MgSO4·7H2O, 0.060 mM FeEDTA, 19 μM H3BO3, 0.31 μM ZnSO4·7H2O, 3.2 μM MnSO4·4H2O, 0.16 μM CuSO4·5H2O, and 0.051 μM (NH4)2MoO4. The solution was continuously aerated, and pH was adjusted to 5.5 with 1 N HCl every day. For construction of a cDNA library used in intensive cDNA sequencing, CdCl2 was added to the culture solution to create a final concentration of 0.89 μM, instead of 0.1 μM used in other analyses in this study. After 3 d of Cd addition, leaves and roots of Cd-treated and untreated plants were harvested. For expression tag library construction, mineral determination, and real-time reverse transcription-polymerase chain reaction (RT-PCR) analysis, CdCl2 was added to a final concentration of 0.1 μM. Plants were treated for 3 h (Cd3h), 1 d (Cd1d), and 3 d (Cd3d) before harvest. Leaves and roots of Cd-treated and untreated plants (Cd0) were sampled at the same time. The plant materials for molecular analyses were immediately frozen in liquid nitrogen and stored at –80 °C until use, and those for mineral determination were dried in an oven at 65 °C for 3 d.
Mineral determination
The mineral composition of plant tissues was determined as reported in Arao et al. (2008). Dried leaves and roots were digested in HNO3:H2O2 (5:1, v/v) in a microwave oven (MLS 1200, Milestone, FKV, Italy) as follows: step 1, 250 W for 5 min; step 2, 0 W for 1 min; step 3, 400 W for 5 min, step 4, 600 W for 2 min; step 5, 600 W for 2 min; and step 6, 250 W for 2 min. The Cd concentration was determined by ICP-mass spectrometry (ELAN DRC-e, PerkinElmer Inc., Waltham, MA, USA). The concentration of other mineral elements was determined by ICP-optical emission spectroscopy (Vista-PRO, Varian Inc., Palo Alto, CA, USA).
cDNA library construction and sequencing
Total RNA was isolated from TB leaf and root tissues from Cd-treated or untreated plants (described above) using TRIzol reagent (Invitrogen, Carlsbad, CA, USA). The same quantities of RNA samples isolated from the Cd-treated and untreated plants were mixed to produce a single leaf RNA sample and a single root RNA sample. The two RNA samples were used to construct cDNA libraries using the Creator-SMART cDNA Library Construction Kit (Clontech Laboratories Inc., Mountain View, CA, USA) to obtain two libraries, ‘TVL’ and ‘TVR’, which were from TB leaves and roots, respectively. From each library, colonies were randomly picked up and cultured in 96-well plates for plasmid isolation. Isolated plasmids were then used for forward and reverse sequencing. Sequencing was performed using BigDye v3 sequencing pre-mix and a 3730xl DNA sequencer (Applied Biosystems, Foster City, CA, USA).
cDNA clustering, assembling a TB unigene set, and functional annotation
Sequence data processing was performed using the Phred/Phrap/Cross_match package (Ewing and Green 1998; Ewing et al., 1998). The data with high quality value (QV ≥20) were extracted and deposited in the DDBJ/EMBL/GenBank DNA databank. The pairs of forward- and reverse-read sequences of each clone were assembled by Phrap and used for clustering. When the forward and reverse reads from a clone did not overlap, the reverse-read sequence was then reverse complemented and joined to the end of the forward sequence, with 20 ‘Ns’ inserted at the joint. All the assembled or joined sequences were clustered using the VISUALBIO-Clustering System (NTT Software Co., Yokohama, Japan), which is a global alignment-based clustering software developed through a mouse full-length cDNA project (Osato et al., 2002). A consensus sequence was obtained by assembling all trace data belonging to each cluster using Phrap, followed by vector trimming and extraction of high-QV sequences. In the same manner as described above, consensus sequences built by 5′-read and 3′-read were appropriately oriented and joined with 20 Ns if they were not overlapping. Assignment of functional annotations was based on a BLAST search against the known sequence data sets, including Arabidopsis-predicted gene model (TAIR8), NCBI plant RefSeq (Release 27; 92 764 records) (Pruitt et al., 2007), the Gene Index unigene sets (Quackenbush et al., 2001) of tomato and potato, LeGI_v12 (46 849 sequences), and StGI_v11 (56 712 sequences). In order to classify the sequences into functional groups, the result of a BLASTX search against the eukaryotic orthologous groups of proteins (KOG) database (Tatusov et al., 2003) was used.
Expression tag library construction and high-throughput tag sequencing by Illumina sequencing technology
Expression tag libraries for use with the Illumina sequencing technology were constructed by combining a commercial application platform for expression tag sequencing (Digital Gene Expression-Tag Profiling with NlaIII; Illumina, San Diego, CA, USA) and the SuperSAGE method (Matsumura et al., 2003). A simple device of inserting two nucleotides, such as GT or AG, into the adaptor 1 sequences as library coding marks was also employed in order to classify the sequence outputs of a mixed library into original discrete library classes. A schematic diagram of the procedure for expression tag library preparation is shown in Fig. 1, and the nucleotide sequences of polynucleotides used in the construction of the libraries and high-throughput sequencing are summarized in Table 1 (Oligonucleotide sequences © 2006 and 2008 Illumina, Inc. All right reserved). Total RNAs were extracted from the harvested root tissues using TRIzol reagent (Invitrogen). Poly(A)+ RNA was purified with an mRNA isolation kit (GE Healthcare UK Ltd, Buckinghamshire, UK). Double-stranded cDNA was synthesized using the SuperScript Double Stranded cDNA Synthesis Kit (Invitrogen) and a biotinylated oligo(dT) primer (QIAGEN, Valencia, CA, USA). Double-stranded cDNA was digested with NlaIII (NEB, Ipswich, MA, USA). A suspension of streptavidin magnetic beads (Promega, Madison, WI, USA) was added to the digested reaction product, and 3′ end fragments of the cDNA were bound to streptavidin magnetic beads. The bound cDNA was washed and subjected to ligation with adaptor 1_XX. Adaptor 1_XX containing the EcoP15I recognition sequence 5′-CAGCAG-3′ was flanked by library coding pairs of nucleotides: GT, CT, AC, and TC for Cd0, Cd3h, Cd1d, and Cd3d, respectively. Adaptor 1_XX-ligated cDNAs were digested by EcoP15I (NEB), and the released fragments were purified and dephosphorylated by alkaline phosphatase (BioDynamics Laboratory Inc., Tokyo, Japan) followed by ligation with adaptor 2. Adaptor-ligated cDNA fragments were amplified by PCR using the GEX PCR primer set and a heat-stable DNA polymerase KOD-Plus- (Toyobo, Osaka, Japan). PCR products were separated on a 6% polyacrylamide gel by electrophoresis. The amplified ‘adaptor 1-tag–adaptor 2’ fragments (∼104 bp) were isolated from the gel, and the concentration and the purity of the tag solutions were analysed with an Agilent 2100 Bioanalyzer (Agilent Technologies, Santa Clara, CA, USA). Four independent library solutions (Cd0, Cd3h, Cd1d, and Cd3d) were mixed in an equal amount of DNA, and the blended library solution was subjected to high-throughput sequencing using an Illumina Genome Analyzer (Illumina).
Fig. 1.

A schematic diagram of the procedure for expression tag library preparation. Double-stranded cDNA was synthesized from mRNA using a biotinylated adaptor oligo(dT) primer. After a digestion with NlaIII, the 3′ end cDNA fragments anchored to streptavidin magnetic beads were ligated to the adaptor 1_GT, the adaptor 1_CT, the adaptor 1_AC, and the adaptor 1_TC for Cd0, Cd3h, Cd1d, and Cd3d libraries, respectively. The adaptor 1-ligated cDNA fragments were digested with EcoP15I, and the released fragments were ligated to the adaptor 2. The adaptor 1-tag–adator 2 fragments were amplified using the GEX PCR primer set. The amplified fragments (∼104 bp) were separated by PAGE. Four independent library solutions (Cd0, Cd3h, Cd1d, and Cd3d) were mixed in an equal amount of DNA, and the blended library solution was subjected to high-throughput sequencing using an Illumina Genome Analyzer. Underlined characters indicate NlaIII and EcoP15I recognition sites. Bold ‘XX’ indicates library coding nucleotides, and ‘GT’, ‘CT’, ‘AC’, and ‘TC’ were used for Cd0, Cd3h, Cd1d, and Cd3d libraries, respectively.
Table 1.
Sequences of polynucleotides used in construction of expression tag libraries
| Name of polynucleotide | Nucleotide sequence |
| Biotinylated adaptor oligo(dT) primer | Biotin-5′-CTGATCTAGAGGTACCGGATCCCAGCAGT17-3′ |
| Adaptor 1_GT for Cd0 library | 5′-ACAGGTTCAGAGTTCTACAGTCCGACATGGTCAGCAGCATG-3′ |
| 3′-CAAGTCTCAAGATGTCAGGCTGTACCAGTCGTC-P-5′ | |
| Adaptor 1_CT for Cd3h library | 5′-ACAGGTTCAGAGTTCTACAGTCCGACATGCTCAGCAGCATG-3′ |
| 3′-CAAGTCTCAAGATGTCAGGCTGTACAGGTCGTC-P-5′ | |
| Adaptor 1_AC for Cd1d library | 5′-ACAGGTTCAGAGTTCTACAGTCCGACATGACCAGCAGCATG-3′ |
| 3′-CAAGTCTCAAGATGTCAGGCTGTACTGGTCGTC-P 5′ | |
| Adaptor 1_TC for Cd3d library | 5′-ACAGGTTCAGAGTTCTACAGTCCGACATGTCCAGCAGCATG-3′ |
| 3′-CAAGTCTCAAGATGTCAGGCTGTACAGGTCGTC-P-5′ | |
| Adaptor 2 | 5′-CAAGCAGAAGACGGCATACGA-3′ |
| 3′-GTTCGTCTTCTGCCGTATGCTNN-P-5′ | |
| GEX PCR primer set | 5′-CAAGCAGAAGACGGCATACGA-3′ |
| 5′-AATGATACGGCGACCACCGACAGGTTCAGAGTTCTACAGTCCGA-3′ | |
| GEX sequencing primer | 5′-CCGACAGGTTCAGAGTTCTACAGTCCGACATG-3′ |
Bold and underlined characters indicate library coding nucleotides and EcoP15I recognition sites, respectively. ‘-P’ indicates phosphorylated 5’ termini.
Oligonucleotide sequences © 2006 and 2008 Illumina, Inc. All rights reserved.
Extraction and counting of expression tag sequences
A flow chart for the analysis of the high-throughput sequencing data of the expression tag libraries is shown in Fig. 2. The raw sequence output data were processed with the Genome Analyzer Pipeline Software (Illumina), and sequences with low sequence reliability were excluded. The filtered sequences were then examined to determine whether they had canonical ‘adaptor-tag’ features. The 24 bp tag sequences with a 5′-flanking NlaIII recognition sequence were extracted from the canonical sequences and classified into four library categories using the library coding nucleotides in adaptor 1 as marks. The abundance of individual tag species in each library was counted, and the tag species that were counted ≥10 times throughout all four libraries were analysed further.
Fig. 2.

A flow chart for the analysis of the high-throughput sequencing data of expression tag libraries. Reliable sequence reads were checked if they had canonical ‘adaptor-tag’ features. Expression tag sequences of 24 bp were extracted and classified into four library categories according to the library coding nucleotides. The tag species that were counted ≥10 times in all four libraries were chosen for further analysis. For reference sequences required for the assignment of the tag sequences, TB cDNAs were intensively sequenced, and 28 317 cDNA sequences were assembled, resulting in 6296 TB unigene sequences. The eggplant unigene set comprising 16 245 sequences was also used as a reference. The TB unigene set was surveyed for the unigene sequences containing exact tag sequences. For 30 046 non-matching sequences, the eggplant unigene set was similarly searched. The differences in the counts of individual tag species between Cd-treated and untreated libraries were evaluated by the SAGEbetaBin analysis with a Bayes error rate of 0.05 (Vêncio et al., 2004).
Survey of TB and eggplant unigene sequences corresponding to individual tag species
First, the TB unigene set (6296 sequences) was searched for sequences that fully matched with individual tag sequences flanked by the 5′ NlaIII recognition site CATG. The eggplant unigene set (16 245 sequences) was similarly surveyed for tags that did not match with any TB unigenes. The tag sequences were linked to Arabidopsis thaliana genes that appeared at the top of the results of a BLAST search with an E-value of <10−5 in which the corresponding unigene sequences were submitted as the query sequences.
Evaluation of the differences in the counts of individual tag species between Cd-treated and untreated libraries
To investigate transcriptional regulation in TB roots during Cd treatment, the differences in the counts of individual tag species between the untreated library (Cd0) and Cd-treated libraries (Cd3h, Cd1d, and Cd3d) were evaluated. To evaluate the statistical significance of the differences in counts, a web-based program, SAGEbetaBin (Vêncio et al., 2004), was employed. The paired raw-count data sets (Cd0 versus Cd3h, Cd1d, or Cd3d) were subjected to the SAGEbetaBin analysis, and up- and down-regulated tag species were detected with a Bayes error rate of 0.05. For quantitative comparison, counts of zero were transformed to 1 and normalized by the library sizes.
Real-time RT-PCR analysis
Double-stranded cDNAs were synthesized as described above using the same plant materials as were used in expression tag library construction. Specific primer sets for TB unigenes were selected with Oligo 7 software (Molecular Biology Insight, Inc., Cascade, CO, USA). cDNAs were diluted and amplified using the LightCycler 480 System II and LightCycler 480 SYBR Green I Master (Roche Applied Science, Indianapolis, IN, USA). Standard curves for individual unigenes were calculated using a dilution series of the cDNA from untreated roots. The relative expression levels of the genes in Cd-treated roots as compared with those in untreated roots were determined on the basis of the comparisons with the reference gene TVR18P14C (a ubiquitin gene homologous to Arabidopsis UBQ14; At4g02890.3). A list of the primers used in the real-time RT-PCR analysis is shown in Supplementary Table S1 available at JXB online.
Results and Discussion
Cd treatment and mineral concentration
To investigate the time-course of transcriptional regulation in TB roots during physiologically mild Cd stress, 60-day-old TB plants were treated with 0.1 μM CdCl2 in hydroponic solution for either 3 h, 1 d, or 3 d. A very mild condition was employed to observe transcriptional changes in the Cd acclimation process, minimizing a vast range of the secondary effects caused by Cd stress. Plants treated for 3 d showed no apparent symptomatic changes in either roots or shoots. In Cd-treated TB plants, Cd accumulation in the roots was observed after just 3 h of treatment (Fig. 3A). Cd content in the roots continued to increase during Cd treatment, indicating the progression of Cd stress severity. In the leaves, however, it was not until after 1 d of treatment that Cd was detected in the tissue (less than the quantitative limit). Even after 3 d of treatment, Cd content in the leaves remained at quite a low level (0.12 mg kg−1 dry weight) compared with that in the roots. For other transition metal elements (Fig. 3B, C, D), slight increases in iron and/or manganese content in the roots were observed after 3 h (for manganese) and after 3 d (for iron and manganese), whereas zinc content in roots did not significantly change (P <0.05). The content of these metal elements in the leaves was not significantly changed. It was concluded that the early events of Cd-responsive transcriptional changes and subsequent responses during the acclimation process in root tissues could be captured with minimal disturbing side effects.
Fig. 3.

Cadmium and other metal contents in the roots and leaves of Cd-treated and untreated plants. (A) Cadmium, (B) iron, (C) manganese, and (D) zinc contents in the roots and leaves of Cd-treated and untreated TB plants. Cd0 indicates untreated plants and Cd3h, Cd1d, and Cd3d indicate plants treated with 0.1 μM for 3 h, 1 d, and 3 d, respectively. The same letters at the top of the bar indicate non-significant differences (P <0.05). Significance was evaluated by Tukey–Cramer's test. Bars indicate standard errors; n=8 (n=7 for leaves of plants treated for 3 d).
Sequencing TB cDNA sequences and assembling the TB unigene set
To attribute 24 bp tag sequences to expressed genes, cDNA sequences were collected from leaves and roots from TB plants that were treated or not treated with Cd. A Cd concentration of 0.89 μM was employed for cDNA library construction, instead of 0.1 μM used in tag expression analysis, in order to collect a diverse range of cDNAs related to Cd stress responses. In total, 18 816 cDNA clones were sequenced from both the 5’ and 3’ ends, and 28 379 high-quality sequences were obtained and registered in the DDBJ/EMBL/GenBank database (accession numbers FS098087–FS126465). These sequences were clustered into 6296 groups at the ‘locus’ level using the VISUALBIO-Clustering software, and consensus sequences were calculated for each cluster by Phrap. The resulting 6296 sequences were used for further analysis as a TB unigene set. The homology search against an Arabidopsis-predicted gene model revealed that 5230 unigenes (83.1%) had significant homology (E-value ≤10−5), while 1066 unigenes (16.9%) showed no significant correspondence. Similarly, 5302 unigenes (84.2%) corresponded to the plant genes in the RefSeq data set, and 5926 unigenes (94.1%) corresponded to potato and/or tomato unigene sets (Fig. 4). Finally, 330 unigenes were identified as being TB specific with no significant homology at the amino acid level to any of the data sets examined. In order to assign functional categories to the TB unigenes and to compare their distribution with that of tomato, a BLASTX search (E-value ≤10−5) against the data set of eukaryotic clusters of KOGs (Tatusov et al., 2003) was performed using both data sets as queries. In total, 3367 TB unigenes scored hits to KOG entries. As shown in Table 2, their functional categories showed a comparable distribution with that in tomato. This result suggested that the TB unigene set built in this study could represent the TB transcriptome without a significant bias. Because S. torvum was found to be most closely related to eggplant by ClustalW alignment analysis using 32 orthologue groups among Solanum species with available ESTs deposited in the database, the eggplant unigene set (16 245 independent unigenes) was also used for ascription of tag sequences to unigenes (Fukuoka et al., National Institute of Vegetable and Tea Science, unpublished results). The TB unigene set includes several genes highly related to Arabidopsis metal transporter genes. These include two P1B-ATPase family genes, HMA1 and HMA6; three ZIP metal transporter genes, ZIP4, ZIP5, and ZIP6; NRAMP1; MTPc4; and three MRP transporter family genes, MRP1, MRP2, and MRP4 (Supplementary Table S1 at JXB online). The TB unigene sequences (flat FASTA format) and a spreadsheet file containing annotation information based on BLAST results are available from the web-based database, VegMarks (http://vegmarks.nivot.affrc.go.jp/VegMarks/jsp/page.do?transition=link).
Fig. 4.

Classification of the TB unigenes based on a sequence similarity search against known plant sequence data sets. Figures indicate the number of TB unigenes that showed significant sequence similarity (E-value ≤10−5) by BLAST search. Figures in parentheses indicate the ratio of unigene number in each class to the total unigene number.
Table 2.
Distribution of functional annotations of unigenes in TB and tomato
| KOG code | Ratio (%) | KOG functional group | |
| TB | Tomato LeGI v12 | ||
| Information storage and processinga | |||
| J | 9.5 | 5.9 | [J] Translation, ribosomal structure, and biogenesis |
| A | 3.3 | 3.8 | [A] RNA processing and modification |
| K | 4.4 | 5.0 | [K] Transcription |
| L | 1.2 | 1.9 | [L] Replication, recombination, and repair |
| B | 1.5 | 1.3 | [B] Chromatin structure and dynamics |
| Cellular processes and signallinga | |||
| D | 1.7 | 2.1 | [D] Cell cycle control, cell division, chromosome partitioning |
| Y | 0.2 | 0.3 | [Y] Nuclear structure |
| V | 0.8 | 0.9 | [V] Defence mechanisms |
| T | 7.4 | 9.4 | [T] Signal transduction mechanisms |
| M | 1.0 | 1.3 | [M] Cell wall/membrane/envelope biogenesis |
| N | 0.0 | 0.0 | [N] Cell motility |
| Z | 2.2 | 2.1 | [Z] Cytoskeleton |
| W | 0.3 | 0.2 | [W] Extracellular structures |
| U | 5.6 | 5.2 | [U] Intracellular trafficking, secretion, and vesicular transport |
| O | 14.0 | 11.1 | [O] Post-translational modification, protein turnover, chaperones |
| Metabolisma | |||
| C | 6.0 | 4.7 | [C] Energy production and conversion |
| G | 5.4 | 5.7 | [G] Carbohydrate transport and metabolism |
| E | 4.0 | 4.6 | [E] Amino acid transport and metabolism |
| F | 0.7 | 1.1 | [F] Nucleotide transport and metabolism |
| H | 0.9 | 1.0 | [H] Coenzyme transport and metabolism |
| I | 3.7 | 4.6 | [I] Lipid transport and metabolism |
| P | 2.1 | 2.6 | [P] Inorganic ion transport and metabolism |
| Q | 4.0 | 4.4 | [Q] Secondary metabolite biosynthesis, transport, and catabolism |
| Poorly characterizeda | |||
| R | 15.4 | 16.3 | [R] General function prediction only |
| S | 4.7 | 4.6 | [S] Function unknown |
Four orthologous groups of protein (KOG) subcategories.
Tag extraction and counting
An outline of the analysis for the expression tag data is illustrated in Fig. 2. Among 5 728 996 reliable sequences obtained from Illumina sequencing analysis, a total of 4 305 525 sequences had the canonical ‘adaptor-tag’ features, and 24 bp expression tag sequences were extracted and classified into the four library categories according to the library coding nucleotides. The results of extraction and counting of the tags are summarized in Table 3, and a histogram of the count of individual tag species is shown in Fig. 5. The number of tag species found in all four libraries totalled nearly 1 160 000. This number was far greater than the expected number of genes for model plants; for example, 26 000 for Arabidopsis and 32 000 for rice. This discrepancy might have resulted from experimental artefacts such as PCR mutations and/or sequence misreading attributed to the innate features of the Illumina sequencing technology. This idea is supported by the fact that the number of tag species counted just once reached >970 000 (84.5%) and accounted for 22.7% of the total number of canonical tags. To exclude these rare and worthless tag species, the tag species that were counted ≥10 times in all four libraries were chosen for further analyses. Finally, a four-library Cd stress-classed expression tag data set comprising 34 269 tag species and 2 859 150 tags was compiled. The numbers of tag species found in each library were similar (∼33 000), and 31 430 tag species (91.7%) were commonly found in all four libraries. The number of tag species that appeared in only the Cd-treated libraries was 767, of which 662 were found in all three Cd-treated libraries (data not shown). These tags may be involved in physiological responses to Cd stress. On the other hand, the number of tag species specific to the untreated library was six.
Table 3.
Summary of collected tags
| Library | Canonical tags | Tags counted ≥10 times | ||
| Species of tags | No. of tags | Species of tags | No. of tags | |
| Cd0 | 352 595 | 1 056 689 | 33 507 | 696 333 |
| Cd3h | 314 907 | 1 075 351 | 33 584 | 754 729 |
| Cd1d | 457 140 | 1 127 050 | 33 207 | 660 252 |
| Cd3d | 298 514 | 1 046 435 | 33 671 | 746 101 |
| Total | 1 156 669 | 4 305 525 | 34 269 | 2 859 150 |
Fig. 5.

A histogram of the occurrence of individual tag species in three Cd-treated (3 h, 1 d, and 3 d treatment with 1 μM CdCl2) and untreated libraries. Occurrence of individual tags was counted over the four tag libraries. A vertical dashed line indicates a threshold line at the count of 10. Tags counted ≥10 times were further analysed.
Identification of TB and eggplant unigene sequences corresponding to the tag sequences
TB and eggplant unigene sets were surveyed for the unigene sequences containing exact individual tag sequences. The results are summarized in Table 4. Of 34 269 tag species examined, 4223 tags fully matched at least one TB unigene sequence. The eggplant unigene set was similarly searched for the other 30 046 non-matching sequences, and 2014 tags matched the eggplant unigenes. In total, 6237 tags (18.2%) were ascribed to either TB or eggplant unigenes. However, 200 tags for TB and 89 tags for eggplant matched more than one unigene sequence. These unigenes mutually shared sequence similarity and were considered members of the same gene families. The redundancy of ‘one tag versus multiple unigenes’ remained at two or three for the majority of them (183 for TB and 83 for eggplant). Conversely, ‘multiple tags versus one unigene’ relationships were found in 1467 of the tags, suggesting the existence of multiple 3’ polyadenylation sites and/or alternative splicing. A total of 891 tags that matched antisense sequences of the unigenes were also detected. The presence of a considerable fraction of antisense sequences in expression tags has been commonly observed (Hoen et al., 2008; Poole et al., 2008). Although these antisense transcripts might play significant roles in the physiological response to Cd, these tags were excluded for the physiological interpretation. The unmatching tags reached >80%, and their ascription is still to be determined. As shown in the right column of Table 4, however, 1530 (38.1%) regulated tag species have been ascribed to either TB or eggplant unigenes. The data set constructed in this study can be used effectively in transcriptomic analyses to interpret the physiological and molecular responses in TB roots during the Cd acclimation process.
Table 4.
Number of tags matched with TB and eggplant unigenes
| Tags match with | All tags (%) | Regulated tags (%) |
| TB unigene | 4197 (12.2) | 1197 (29.8) |
| One unigene | 4033 (11.8) | 1121 (27.9) |
| More than two unigenes | 164 (0.5) | 76 (1.9) |
| No TB unigene | 30 072 (87.8) | 2814 (70.2) |
| Eggplant unigene | 2018 (5.9) | 323 (8.1) |
| One unigene | 1929 (5.6) | 298 (7.4) |
| More than two unigenes | 89 (0.3) | 25 (0.6) |
| No eggplant unigene | 28 054 (81.9) | 2491 (62.1) |
| Summary | 34 269 (100.0) | 4011 (100.0) |
| One unigene | 5962 (17.4) | 1419 (35.4) |
| At least one unigenes | 6215 (18.1) | 1520 (37.9) |
| No unigene | 28 054 (81.9) | 2491 (62.1) |
Unigenes completely matched (24 bp/24 bp) with individual tag sequences were surveyed. First, the TB unigene set was searched. For tags without a matching TB unigene, the eggplant unigene set was examined.
Time-course changes in counts of tags during Cd treatment
Counts of individual tag species in the three Cd-treated libraries were compared with that in the untreated library by using the SAGEbetaBin program (Vêncio et al., 2004) with a Bayes error rate of 0.05. A total of 4011 tag species were differentially expressed during Cd treatment, and 2049 and 2022 tag species, respectively, increased and decreased in at least one Cd-treated library as compared with the untreated library. The numbers of differentially expressed tag species during Cd treatment are summarized in Fig. 6. After only 3 h of treatment, 580 up- and 652 down-regulated tags were found, indicating that transcriptional changes occur rapidly in the roots. Of these, the expression level of 322 up- and 271 down-regulated tags returned to an insignificant level after 1 d. These ‘rapid and transient’ responses may counteract cellular detrimental effects triggered by the sudden shock of Cd exposure. There were also some tags that reached significant levels again after 3 d of treatment. After 1 d of treatment, the number of differentially regulated tag species was the highest during Cd treatment, which included 2887 tags corresponding to 1423 up- and 1464 down-regulated tags. This may reflect the increased severity of Cd stress that accompanied the rapid accumulation of Cd in the roots (Fig. 3A). The number, however, decreased to 1376 tags comprising 655 up- and 721 down-regulated tags after 3 d of treatment. Thus, the expression levels of 1072 and 1028 differentially regulated tags at 1 d after treatment were no longer significantly different after 3 d of treatment. These ‘change and settle’ tags constituted more than half of the differentially regulated tags and are likely to play important roles in adaptation processes to Cd stress. The restitution of these genes indicates that TB plants might successfully acclimatize to Cd toxicity during 3 d of treatment. On the other hand, 110 and 173 tags had been up- and down-regulated, respectively, throughout the Cd treatment period. These ‘rapid and lasting’ tags may be involved in the cellular protective processes that respond to the intrinsic hazardous property of accumulated Cd in the cells, including systematic detoxification of Cd, antioxidative response, and related metabolic changes. It was not until after 3 d of treatment that the differential expression of 217 up- and 177 down-regulated tags became significant. Regulation of these ‘slow response’ tags might be due simply to the low severity of Cd stress, or they may be due to secondary effects caused by Cd. The diverse patterns of temporal changes described above could depend directly on the applied Cd concentration and might be partially explained by the Cd dose in the cells or tissues. The diverse patterns of gene expression, however, strongly suggest that the acclimation process consists of progressive phases characterized by regulation of sets of specific genes.
Fig. 6.

Numbers of tag species differentially regulated during Cd treatment. The difference in the counts of individual tag species between the untreated library and Cd-treated libraries. Treatment with 0.1 μM CdCl2 for 3 h (Cd3h), 1 d (Cd1d), and 3 d (Cd3d) was evaluated by the SAGEbetaBin program with a 0.05 Bayes error rate (Vêncio et al., 2004). The numbers of significantly (A) up-regulated and (B) down-regulated tag species in three Cd-treated libraries are shown.
Differentially expressed genes in TB roots during 3 d of Cd treatment
A list of the differentially regulated genes expected to be involved in heavy metal metabolism or other responses induced by Cd stress is shown in Table 5. The transcriptional regulation of these genes was also confirmed by real-time RT-PCR (Fig. 7).
Table 5.
Differentially regulated genes in TB roots during Cd treatment identified by the present tag-based transcriptomic analysis
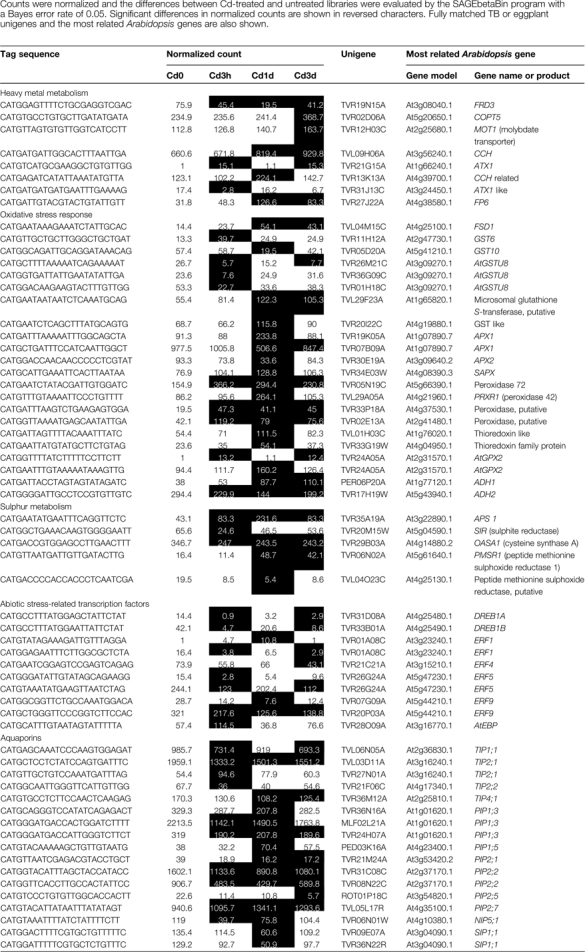 |
Fig. 7.

Time-course changes of the expression of the 23 TB unigenes in the roots during Cd treatment. TB plants were hydroponically grown and CdCl2 was added to the culture solutions at a final concentration of 0.1 μM. The roots were harvested 3 h (Cd3h), 1 d (Cd1d), or 3 d (Cd3d) after the start of treatment, together with untreated roots (Cd0). The relative amount of transcripts of individual TB unigenes in the roots was determined by real-time RT-PCR. Expression levels of the unigenes in Cd-treated roots relative to those in untreated roots were calculated using a unigene TVR18P14C (a ubiquitin gene) as a standard control. Bars indicate standard errors (n=4).
Genes involved in uptake, translocation, and metabolism of heavy metals
It has been reported that low loading of Cd into xylem in the roots is responsible for the reduced translocation of Cd to the shoots (Mori et al., 2009). The transcriptional regulation of metal transporter genes that might be involved in reduction in the amount of Cd and acclimation processes during Cd treatment was examined. Members of the P1B-ATPase family are involved in the transport of heavy metal ions in higher plants (Baxter et al., 2003; Williams and Mills, 2005). In Arabidopsis, eight family members were identified, and HMA1–HMA4 and HMA5–HMA8 were predicted to transport Zn/Cd/Pb/Co and Cu/Ag, respectively. HMA2 and HMA4 are plasma membrane-localized heavy metal exporters of Zn and Cd, and their involvement in heavy metal tolerance and metal hyperaccumulation has been characterized (Mills et al., 2003; Hussain et al., 2004; Courbot et al., 2007). No tags or cDNA, however, were found that annotated to HMA2 or HMA4. Four tags annotated to Arabidopsis HMA6 and HMA7 that localized to plastids and post-Golgi compartments, respectively, were identified, although these tags were not significantly regulated (data not shown). It is expected that Cd ions are taken up via divalent cation transporters such as ZIP transporters. In addition, Cd accumulated in plants competes for physiological binding sites with other essential metals such as zinc and copper and causes homeostatic imbalance, including apparent deficiency conditions of these metals (Weber et al., 2006). Hence, the expression of transporter genes for transition metal ions was examined. A tag annotated to the copper transporter COPT5 (TVR02D06A and TVR33K19C, At5g20650.1; unigene name, most related Arabidopsis gene name), one of the copper importer proteins in Arabidopsis (Sancenón et al., 2003), was up-regulated after 3 d of treatment (Table 5, Fig. 7). This induction might result from an apparent copper deficiency caused by Cd. Two tags annotated to two ZIPs (ZIP1 and ZIP5), two tags annotated to NRAMP1, and a tag annotated to ZAT1 were identified. However, these divalent cation transporters were not significantly regulated (data not shown). In this study, the candidate metal transporter genes responsible for low Cd accumulation were not identified, but a complete inventory of the TB metal transporter genes may help with molecular elucidation of the mechanism. The absence of dramatic changes in these metal transporters may explain why the mild Cd exposure did not induce serious competitive inhibitory effects on metal ion homeostasis in TB roots. On the other hand, a tag annotated to FRD3 (TVR19N15A, At3g08040.1), a member of the MATE efflux transporter family, was down-regulated after 3 h of treatment and remained low during Cd treatment. FRD3 is involved in loading of citrate into xylem, consequently ensuring the delivery of iron from roots to shoots (Rogers and Guerinot, 2002). It has been reported that FRD3 was more highly expressed in the metal hyperaccumulator Arabidopsis halleri than in A. thaliana, and the involvement of citrate loading to xylem in metal homeostasis was suggested (Talke et al., 2006). It has also been reported that pre-incubation with citric acid in culture media increased the root-to-shoot transport of Cd 5- to 6-fold (Senden et al., 1995). The rapid repression of the citrate exporter may lower the citrate concentration in xylem sap and reduce the solubility of Cd, thus inhibiting root-to-shoot translocation of the toxic element. Four regulated tags annotated to copper chaperone proteins and farnesylated proteins (FPs) that were characterized by conserved heavy metal-binding sites (M/L)XCXXC were identified. A tag annotated to CCH (TVL09H06A, At3g24450.1) was up-regulated after 1 d of treatment and remained high after 3 d of treatment. Two tags annotated to AtFP6 (TVR27J22A, At4g38580.1) and an AtFP-like protein (TVR13K13A, At4g39700.1) were significantly induced after 1 d of treatment. The other tag annotated to an ATX1-like protein (TVR31J13C, At3g24450.1), which was down-regulated after 1 d of treatment. Copper chaperone proteins such as CCH and ATX1 bind copper and recruit it to specific partners such as copper-containing enzymes and heavy metal pumps (Wintz and Vulpe, 2002; Puig et al., 2007). Two plasma membrane-localized FPs, CdI19 and AtFP6, were reported to be induced by Cd stress, and overexpression of these genes conferred Cd tolerance, suggesting their involvement in Cd detoxification (Suzuki et al., 2002; Gao et al., 2009). Induction of these heavy metal-binding proteins may facilitate efflux and sequestration of the hazardous Cd or moderation of Cd toxicity simply by chelation.
Genes involved in antioxidative stress
It is generally known that a high concentration of Cd in plant cells induces the accumulation of reactive oxygen species such as superoxide anion and hydrogen peroxide (Puig et al., 2007). Although Cd2+ ions do not alter their oxidation state, binding to sulphydryl groups of proteins and replacing divalent cations such as Zn2+ and Fe2+ on redox-reactive enzymes may cause release of these harmful molecules. In this study, four tags annotated to superoxide dismutase (SOD) genes were identified, including a chloroplast-localized Fe SOD, a mitochondrial Mn SOD, and a cytosolic Cu-Zn SOD. Of these, only a tag annotated to an Fe SOD (TVL04M15C, At4g25100.4, FSD1) was significantly up-regulated after 1 d of Cd treatment (Table 5, Fig. 7). The specific induction of FSD1 was also reported in roots of A. thaliana (Smeets et al., 2008). Peroxidases and catalases play central roles in hydrogen peroxide metabolism. Four tags annotated to ascorbate peroxidases were isolated and differentially regulated. Two of them—TVR19K05A (At1g07890.7), a cytosolic peroxidase APX1, and TVR34E03W (At4g08390.3), a chloroplastic stromal ascorbate peroxidase SAPX—and the other two—TVR07B09A (At1g07890.7) and TVR30E19A (At3g09640.2), a cytosolic ascorbate peroxidase APX2—were respectively up- and down-regulated after 1 d of treatment. Two tags annotated to AtGPX2 (TVR24A05A, At2g31570.1) were up-regulated by Cd treatment. In addition, seven tags annotated to peroxidase-related proteins with unknown function were up-regulated by Cd treatment. On the other hand, no regulated tags annotated to catalases were identified. Three and four tags annotated to glutathione S-transferase (GST) were up- and down-regulated, respectively. The strong induction of plastidic Fe SOD was consistent with the report that production of superoxide radicals is the main cause of oxidative stress in Cd-stressed roots (Smeets et al., 2008). The up-regulation of several peroxidase and GST isoforms indicated that the ascorbate–glutathione cycle might be activated in order to break down hydrogen peroxide released from superoxide dismutation.
Genes involved in sulphur metabolism
Under a heavy metal excess environment, the growing demand for cysteine for synthesis of glutathione and phytochelatins affects sulphur assimilation metabolism at various steps. In Arabidopsis, proteins involved in sulphate assimilation and cysteine synthesis are up-regulated. These include sulphate transporters, ATP sulphurylases, and 5′-adenylsulphate reductases (Herbette et al., 2006; Weber et al., 2006). A tag annotated to a sulphate transporter Sultr1;3 was isolated, but it was not differentially regulated during Cd treatment (data not shown). A tag annotated to the ATP sulphurylase gene, APS1 (TVR35A19A, At3g22890.1), was strongly up-regulated throughout the Cd treatment (Table 5, Fig. 7). This result confirmed the rapid and prolonged activation of cysteine synthesis upon Cd stress. However, a tag annotated to an O-acetylserine(thiol)lyase (TVR29B03A, At4g14880.2) that mediates cysteine synthesis was down-regulated during Cd treatment. It is contradictory that the enzyme catalysing the last step of cysteine biosynthesis is down-regulated when the demand is high. The repression of the genes under Cd stress was also reported in Arabidopsis (Herbette et al., 2006).
Transcriptional regulators related to abiotic stresses
Seven tags annotated to members of the ERF (ethylene response factor) transcriptional regulator family, a subfamily of the AP2/ERF superfamily, were down-regulated differentially by Cd treatment (Table 5, Fig. 7). These include ERF1 (TVR01A08C, At3g23240.1), ERF4 (TVR21C21A, At3g15210.1), ERF5 (TVR26G24A, At5g47230.1), and ERF9 (TVR20P03A, At5g44210.1). The AP2/ERF superfamily is a large gene family of transcription factors characterized by a unique AP2/ERF domain (Nakano et al., 2006). Members of the ERF subfamily are reportedly involved in not only ethylene signalling but also plant responses to various types of biotic and abiotic stresses. It has been reported that ERF1 and ERF5 were induced by Cd in A. thaliana (Herbette et al., 2006). Induction of ERF genes by Cd in A. thaliana and A. halleri has also been reported (Weber et al., 2006). The contradictory results obtained in this study might come from the moderate Cd concentration of 0.1 μM compared with the previous reports (≥5 μM). Diverse patterns of ERF gene expression induced by Cd suggest that each of the ERF proteins might be involved in the regulation of a different class of genes that responds to primary or secondary abiotic stress caused by Cd. We also identified two tags (TVR33B01A, At4g25490.1, DREB1B/CBF1; and TVR31D08A, At4g25480.1, DREB1A/CBF3) that annotated to two members of another subgroup of the AP2/ERF superfamily: dehydration-responsive element-binding protein (DREB) transcription factors. Both of them were down-regulated after just 3 h of treatment and stayed repressed during Cd treatment. DREB1A, DREB1B, and DREB1C are involved in induction of cold stress-responsive genes, and DREB2 is involved in osmotic stress-responsive gene expression in A. thaliana (Nakashima and Yamaguchi-Shinozaki, 2006). The expression of these transcriptional regulators is induced during the process of acclimation to these abiotic stresses. Although it is unclear why these stress-related transcriptional regulators were down-regulated under Cd-stressed environments, they might play an important role in transcriptional regulation of stress-responsive genes during the Cd acclimation process in TB roots.
Transcriptional repression of aquaporins
Twenty-eight tags annotated to members of the aquaporin water channel gene family were isolated. They were redundantly annotated to six tonoplast intrinsic proteins (TIPs), seven plasma membrane intrinsic proteins (PIPs), two small basic intrinsic proteins (SIPs), and a nodulin26-like intrinsic protein (NIP) in A. thaliana (data not shown). Of these, 17 tags were differentially regulated during Cd treatment (Table 5, Fig. 7). Four, seven, two, and one tag annotated to TIPs, PIPs, SIPs, and a NIP, respectively, were significantly down-regulated, and one and two tags annotated to a TIP and PIPs, respectively, were up-regulated. In most cases these transcriptional changes were rapid and occurred within 3 h. Aquaporins are localized in the membrane of cellular compartments such as tonoplast and plasma membranes, and function as water channels and play a role in water management in plants (Kaldenhoff and Fischer, 2006). So far, little information is available regarding transcriptional regulation of aquaporins under Cd stress except for a report on induction of a PIP gene in barley roots by Cd (Tamás et al., 2008). In A. thaliana, expression of TIP and PIP genes was down-regulated by osmotic stresses such as salt and drought stresses (Alexandersson et al., 2005; Boursiac et al., 2005). The rapid and uniform repressive regulation of aquaporin genes suggests that exposure to Cd might cause a potential dehydration stress in TB root cells. Moreover, we also identified 11 Cd-regulated tags annotated to dehydration-responsive genes (data not shown). Together with the transcriptional regulation of dehydration-related transcription factors and their related regulators, including DREB and ERF proteins, these results suggest that drought stress is one of the important constituents of the environmental problems caused by Cd stress in TB roots. Although the effects of Cd on plant–water relations in leaves have been characterized (Poschenrieder et al., 1989; Perfus-Barbeoch et al., 2002), the reports were limited to characterizing the effect of Cd on water status in roots. It has been shown that Cd directly binds AtPIP2;1 and inhibits its water transport activity in reconstituted liposomes (Verdoucq et al., 2008). The inhibitory effect of Cd on aquaporins may explain the transcriptional regulation of dehydration-related genes in TB roots during Cd stress.
The data presented here generally encompass the transcriptomic changes during the Cd acclimation process. The transcriptional changes of genes related to heavy metal metabolism, antioxidative stress, sulphur metabolism, and dehydration stress were successfully detected by SuperSAGE methods based on the Illumina sequencing platform. The mild Cd treatment enabled the detection of realistic transcriptional changes during the acclimation process with minimized secondary effects. However, interpretive evidence could not be found, except for repression of an FRD3 isologue, that could explain the low Cd-accumulating characteristics of TB, such as induction or repression of supposed Cd transporter genes. This is attributed mainly to a shortage in sequence data of expressed genes, although the possibility could not be ruled out that such genes are constitutively expressed irrespective of Cd in the media. More EST information will increase the number of determinate tags. It is also possible to clone and analyse the expressed genes corresponding to the regulated tags by means of a feature of the SuperSAGE method, i.e. the long tag sequence of 24 nucleotides. The resources of molecular information in this paper will assist in the elucidation of the molecular mechanisms of not only the Cd acclimation processes in TB, including low Cd accumulation, but also in the evaluation of other useful characteristics of TB, such as multiple disease resistance.
Supplementary data
Supplementary data are available at JXB online.
Table S1. Nucleotide sequences of primers used in real-time RT-PCR analysis of TB unigenes.
Table S2. TB unigenes highly related to Arabidopsis metal transporter genes.
Supplementary Material
Acknowledgments
We thank Ms Hanako Maeda, Ms Yumiko Kitamura, Ms Naomi Fukushima, Ms Hiroko Iwano, Mr Daisuke Yamashita, and Mr Tetsuo Izumi for their technical support. This work was supported by the Program for the Promotion of Basic Research Activities for Innovative Biosciences (PROBRAIN).
Glossary
Abbreviations
- ERF
ethylene response factor
- EST
expressed sequenced tag
- DREB
dehydration-responsive element-binding protein
- KOG
eukaryotic orthologous groups of proteins
- NIP
nodulin26-like intrinsic protein
- PIP
plasma membrane intrinsic protein
- RT-PCR
reverse transcription-polymerase chain reaction
- SAGE
serial analysis of gene expression
- SIP
small basic intrinsic protein
- TB
Solanum torvum Sw. cv. Torubamubiga
- TIP
tonoplast intrinsic protein
References
- Alexandersson E, Fraysse L, Sjövall-Larsen S, Gustavsson S, Fellert M, Karlsson M, Johanson U, Kjellbom P. Whole gene family expression and drought stress regulation of aquaporins. Plant Molecular Biology. 2005;59:469–484. doi: 10.1007/s11103-005-0352-1. [DOI] [PubMed] [Google Scholar]
- Arao T, Takeda H, Nishihara E. Reduction of cadmium translocation from roots to shoots in eggplant (Solanum melongena) by grafting onto Solanum torvum rootstock. Soil Science and Plant Nutrition. 2008;54:555–559. [Google Scholar]
- Baxter I, Tchieu J, Sussman MR, Boutry M, Palmgren MG, Gribskov M, Harper JF, Axelsen KB. Genomic comparison of P-type ATPase ion pumps in Arabidopsis and rice. Plant Physiology. 2003;132:618–628. doi: 10.1104/pp.103.021923. [DOI] [PMC free article] [PubMed] [Google Scholar]
- Boursiac Y, Chen S, Luu DT, Sorieul M, van den Dries N, Maurel C. Early effects of salinity on water transport in Arabidopsis roots. Molecular and cellular features of aquaporin expression. Plant Physiology. 2005;139:790–805. doi: 10.1104/pp.105.065029. [DOI] [PMC free article] [PubMed] [Google Scholar]
- Courbot M, Willems G, Motte P, Arvidsson S. A major quantitative trait locus for cadmium tolerance in Arabidopsis halleri colocalizes with HMA4, a gene encoding a heavy metal ATPase. Plant Physiology. 2007;144:1052–1065. doi: 10.1104/pp.106.095133. [DOI] [PMC free article] [PubMed] [Google Scholar]
- Ewing B, Green P. Base-calling of automated sequencer traces using Phred. II. Error probabilities. Genome Research. 1998;8:186–194. [PubMed] [Google Scholar]
- Ewing B, Hillier LD, Wendl MC, Green P. Base-calling of automated sequencer traces using Phred. I. Accuracy assessment. Genome Research. 1998;8:175–185. doi: 10.1101/gr.8.3.175. [DOI] [PubMed] [Google Scholar]
- Gao W, Xiao S, Li H, Tsao S, Chye M. Arabidopsis thaliana acyl-CoA-binding protein ACBP2 interacts with heavy-metal-binding farnesylated protein AtFP6. New Phytologist. 2009;181:89–102. doi: 10.1111/j.1469-8137.2008.02631.x. [DOI] [PubMed] [Google Scholar]
- Hall JL, Williams LE. Transition metal transporters in plants. Journal of Experimental Botany. 2003;54:2601–2613. doi: 10.1093/jxb/erg303. [DOI] [PubMed] [Google Scholar]
- Herbette S, Taconnat L, Hugouvieux V, et al. Genome-wide transcriptome profiling of the early cadmium response of Arabidopsis roots and shoots. Biochimie. 2006;88:1751–1765. doi: 10.1016/j.biochi.2006.04.018. [DOI] [PubMed] [Google Scholar]
- Hoen PAC't, Ariyurek Y, Thygesen HH, Vreugdenhil E, Vossen RHAM, de Menezes RX, Boer JM, van Ommen GB, den Dunnen JT. Deep sequencing-based expression analysis shows major advances in robustness, resolution and inter-lab portability over five microarray platforms. Nucleic Acids Research. 2008 doi: 10.1093/nar/gkn705. 36, e141. [DOI] [PMC free article] [PubMed] [Google Scholar]
- Hussain D, Haydon MJ, Wang Y, Wong E, Sherson SM, Young J, Camakaris J, Harper JF, Cobbett CS. P-type ATPase heavy metal transporters with roles in essential zinc homeostasis in Arabidopsis. The Plant Cell. 2004;16:1327–1339. doi: 10.1105/tpc.020487. [DOI] [PMC free article] [PubMed] [Google Scholar]
- Kaldenhoff R, Fischer M. Functional aquaporin diversity in plants. Biochimica et Biophysica Acta. 2006;1758:1134–1141. doi: 10.1016/j.bbamem.2006.03.012. [DOI] [PubMed] [Google Scholar]
- Mäser P, Thomine S, Schroeder JI, et al. Phylogenetic relationships within cation transporter families of Arabidopsis. Plant Physiology. 2001;126:1646–1667. doi: 10.1104/pp.126.4.1646. [DOI] [PMC free article] [PubMed] [Google Scholar]
- Matsumura H, Krüger D, Kahl G, Terauchi R. SuperSAGE: a modern platform for genome-wide quantitative transcript profiling. Current Pharmaceutical Biotechnology. 2008;9:368–374. doi: 10.2174/138920108785915157. [DOI] [PubMed] [Google Scholar]
- Matsumura H, Reich S, Ito A, Saitoh H, Kamoun S, Winter P, Kahl G, Reuter M, Krüger D, Terauchi R. Gene expression analysis of plant host–pathogen interactions by SuperSAGE. Procedings of the National Academy of Sciences, USA. 2003;100:15718–15723. doi: 10.1073/pnas.2536670100. [DOI] [PMC free article] [PubMed] [Google Scholar]
- Mills RF, Krijger GC, Baccarini PJ, Hall JL, Williams LE. Functional expression of AtHMA4, a P1B-type ATPase of the Zn/Co/Cd/Pb subclass. The Plant Journal. 2003;35:164–176. doi: 10.1046/j.1365-313x.2003.01790.x. [DOI] [PubMed] [Google Scholar]
- Mori S, Uraguchi S, Ishikawa S, Arao T. Xylem loading process is a critical factor in determining Cd accumulation in the shoots of Solanum melongena and Solanum torvum. Environmental and Experimental Botany. 2009;67:127–132. [Google Scholar]
- Nakano T, Suzuki K, Fujimura T, Shinshi H. Genome-wide analysis of the ERF gene family in Arabidopsis and rice. Plant Physiology. 2006;140:411–432. doi: 10.1104/pp.105.073783. [DOI] [PMC free article] [PubMed] [Google Scholar]
- Nakashima K, Yamaguchi-Shinozaki K. Regulons involved in osmotic stress-responsive and cold stress-responsive gene expression in plants. Physiologia Plantarum. 2006;126:62–71. [Google Scholar]
- Osato N, Itoh M, Konno H, et al. A computer-based method of selecting clones for a full-length cDNA project: simultaneous collection of negligibly redundant and variant cDNAs. Genome Research. 2002;12:1127–1134. doi: 10.1101/gr.75202. [DOI] [PMC free article] [PubMed] [Google Scholar]
- Perfus-Barbeoch L, Leonhardt N, Vavasseur A, Forestier C. Heavy metal toxicity: cadmium permeates through calcium channels and disturbs the plant water status. The Plant Journal. 2002;32:539–548. doi: 10.1046/j.1365-313x.2002.01442.x. [DOI] [PubMed] [Google Scholar]
- Poole RL, Barker GLA, Werner K, Biggi GF, Coghill J, Gibbings JG, Berry S, Dunwell JM, Edwards KJ. Analysis of wheat SAGE tags reveals evidence for widespread antisense transcription. BMC Genomics. 2008;9:475–491. doi: 10.1186/1471-2164-9-475. [DOI] [PMC free article] [PubMed] [Google Scholar]
- Poschenrieder C, Gunsé B, Barceló J. Influence of cadmium on water relations, stomatal resistance, and abscisic acid content in expanding bean leaves. Plant Physiology. 1989;90:1365–1371. doi: 10.1104/pp.90.4.1365. [DOI] [PMC free article] [PubMed] [Google Scholar]
- Pruitt KD, Tatusova T, Maglott DR. NCBI reference sequences (RefSeq): a curated non-redundant sequence database of genomes, transcripts and proteins. Nucleic Acids Research. 2007;35:D61–D65. doi: 10.1093/nar/gkl842. [DOI] [PMC free article] [PubMed] [Google Scholar]
- Puig S, Mira H, Dorcey E, et al. Higher plants possess two different types of ATX1-like copper chaperones. Biochemical and Biophysical Research Communications. 2007;354:385–390. doi: 10.1016/j.bbrc.2006.12.215. [DOI] [PubMed] [Google Scholar]
- Quackenbush J, Cho J, Lee D, Liang F, Holt I, Karamycheva S, Parvizi B, Pertea G, Sultana R, White J. The TIGR Gene Indices: analysis of gene transcript sequences in highly sampled eukaryotic species. Nucleic Acids Research. 2001;29:159–164. doi: 10.1093/nar/29.1.159. [DOI] [PMC free article] [PubMed] [Google Scholar]
- Rodríguez L, Ruiz E, Alonso-Azcárate J, Rincón J. Heavy metal distribution and chemical speciation in tailings and soils aroung a Pb–Zn mine in Spain. Journal of Environmental Management. 2009;90:1106–1116. doi: 10.1016/j.jenvman.2008.04.007. [DOI] [PubMed] [Google Scholar]
- Rogers EE, Guerinot ML. FRD3, a member of the multidrug and toxin efflux family, controls iron deficiency responses in Arabidopsis. The Plant Cell. 2002;14:1787–1799. doi: 10.1105/tpc.001495. [DOI] [PMC free article] [PubMed] [Google Scholar]
- Romero-Puertas MC, Corpas FJ, Rodríguez-Serrano M, Gómez M, del Río LA, Sandalio LM. Differential expression and regulation of antioxidative enzymes by cadmium in pea plants. Journal of Plant Physiology. 2007;164:1346–1357. doi: 10.1016/j.jplph.2006.06.018. [DOI] [PubMed] [Google Scholar]
- Rudd S. Expressed sequence tags: alternative or complement to whole genome sequences? Trends in Plant Science. 2003;8:321–329. doi: 10.1016/S1360-1385(03)00131-6. [DOI] [PubMed] [Google Scholar]
- Sancenón V, Puig S, Mira H, Thiele DJ, Peñarrubia L. Identification of a copper transporter family in Arabidopsis thaliana. Plant Molecular Biology. 2003;51:577–587. doi: 10.1023/a:1022345507112. [DOI] [PubMed] [Google Scholar]
- Senden MHMN, Meer AJGMvd, Verburg TG, Wolterbeek HT. Citric acid in tomato plant roots and its effect on cadmium uptake and distribution. Plant and Soil. 1995;171:333–339. [Google Scholar]
- Smeets K, Ruytinx J, Semane B, Van Belleghem F, Remans T, Van Sanden S, Vangronsveld J, Cuypers A. Cadmium-induced transcriptional and enzymatic alterations related to oxidative stress. Environmental and Experimental Botany. 2008;63:1–8. [Google Scholar]
- Suzuki N, Yamaguchi Y, Koizumi N, Sano H. Functional characterization of a heavy metal binding protein CdI19 from Arabidopsis. The Plant Journal. 2002;32:165–173. doi: 10.1046/j.1365-313x.2002.01412.x. [DOI] [PubMed] [Google Scholar]
- Takeda H, Sato A, Nishihara E, Arao T. Reduction of cadmium concentration in eggplant (Solanum melongena) fruits by grafting onto Solanum torvum rootstock. Japanese Journal of Soil Science and Plant Nutrition. 2007;78:581–586. (in Japanese with English summary) [Google Scholar]
- Talke IN, Hanikenne M, Krämer U. Zinc-dependent global transcriptional control, transcriptional deregulation, and higher gene copy number for genes in metal homeostasis of the hyperaccumulator Arabidopsis halleri. Plant Physiology. 2006;142:148–167. doi: 10.1104/pp.105.076232. [DOI] [PMC free article] [PubMed] [Google Scholar]
- Tamás L, Dudiková J, Durceková K, Halusková L, Huttová J, Mistrík I, Ollé M. Alterations of the gene expression, lipid peroxidation, proline and thiol content along the barley root exposed to cadmium. Journal of Plant Physiology. 2008;165:1193–1203. doi: 10.1016/j.jplph.2007.08.013. [DOI] [PubMed] [Google Scholar]
- Tatusov RL, Fedorova ND, Jackson JD, et al. The COG database: an updated version includes eukaryotes. BMC Bioinformatics. 2003;4:41. doi: 10.1186/1471-2105-4-41. [DOI] [PMC free article] [PubMed] [Google Scholar]
- Uetani M, Kobayashi E, Suwazono Y, Honda R, Nishijo M, Nakagawa H, Kido T, Nogawa K. Tissue cadmium (Cd) concentrations of people living in a Cd polluted area, Japan. BioMetals. 2006;19:521–525. doi: 10.1007/s10534-005-5619-0. [DOI] [PubMed] [Google Scholar]
- Uraguchi S, Mori S, Kuramata M, Kawasaki A, Arao T, Ishikawa S. Root-to-shoot Cd translocation via the xylem is the major process determining shoot and grain cadmium accumulation in rice. Journal of Experimental Botany. 2009;60:2677–2688. doi: 10.1093/jxb/erp119. [DOI] [PMC free article] [PubMed] [Google Scholar]
- Velculescu VE, Zhang L, Vogelstein B, Kinzler KW. Serial analysis of gene expression. Science. 1995;274:484–487. doi: 10.1126/science.270.5235.484. [DOI] [PubMed] [Google Scholar]
- Vêncio RZN, Brentani H, Patrão DFC, Pereira CAB. Bayesian model accounting for within-class biological variability in Serial Analysis of Gene Expression (SAGE) BMC Bioinformatics. 2004;5:119–131. doi: 10.1186/1471-2105-5-119. [DOI] [PMC free article] [PubMed] [Google Scholar]
- Verdoucq L, Grondin A, Maurel C. Structure–function analysis of plant aquaporin AtPIP2;1 gating by divalent cations and protons. Biochemical Journal. 2008;415:409–416. doi: 10.1042/BJ20080275. [DOI] [PubMed] [Google Scholar]
- Weber M, Trampczynska A, Clemens S. Comparative transcriptome analysis of toxic metal responses in Arabidopsis thaliana and the Cd2+-hypertolerant facultative metallophyte Arabidopsis halleri. Plant, Cell and Environment. 2006;29:950–963. doi: 10.1111/j.1365-3040.2005.01479.x. [DOI] [PubMed] [Google Scholar]
- Williams LE, Mills RF. P1B-ATPases—an ancient family of transition metal pumps with diverse functions in plants. Trends in Plant Science. 2005;10:491–502. doi: 10.1016/j.tplants.2005.08.008. [DOI] [PubMed] [Google Scholar]
- Wintz H, Vulpe C. Plant copper chaperones. Biochemical Society Transactions. 2002;30:732–735. doi: 10.1042/bst0300732. [DOI] [PubMed] [Google Scholar]
Associated Data
This section collects any data citations, data availability statements, or supplementary materials included in this article.