Abstract
The functional characteristics of plant cell walls depend on the composition of the cell wall polymers, as well as on their highly ordered architecture at scales from a few nanometres to several microns. Raman spectra of wood acquired with linear polarized laser light include information about polymer composition as well as the alignment of cellulose microfibrils with respect to the fibre axis (microfibril angle). By changing the laser polarization direction in 3° steps, the dependency between cellulose and laser orientation direction was investigated. Orientation-dependent changes of band height ratios and spectra were described by quadratic linear regression and partial least square regressions, respectively. Using the models and regressions with high coefficients of determination (R2 > 0.99) microfibril orientation was predicted in the S1 and S2 layers distinguished by the Raman imaging approach in cross-sections of spruce normal, opposite, and compression wood. The determined microfibril angle (MFA) in the different S2 layers ranged from 0° to 49.9° and was in coincidence with X-ray diffraction determination. With the prerequisite of geometric sample and laser alignment, exact MFA prediction can complete the picture of the chemical cell wall design gained by the Raman imaging approach at the micron level in all plant tissues.
Keywords: Cellulose, confocal Raman microscopy, microfibril orientation, plant cell wall, lignin, polarization
Introduction
Plant cell walls are complex and dynamic structures which determine cell and plant shape (Martin et al., 2001). Crystals of cellulose form microfibrils, which are embedded in matrix polymers and represent the major scaffold of the cell wall. Although native cellulose, termed cellulose I, has been one of the most studied polymers, the biosynthesis and ultrastructure of cellulose are not yet completely resolved (O'Sullivan, 1997; Atalla, 1999; Brown and Saxena, 2000; Klemm et al., 2005; Emons et al., 2007; Gutierrez et al., 2009). The deceptive simplicity of the repeating β-1-4 linking cellobiose unit is not indicative of the complex arrangement of amorphous and crystalline regions at the fibril and fibre level. Furthermore, the polysacharidic matrix polymers, the hemicelluloses, and pectins comprise a variety of different chemical configurations as well as the lignin, the polyphenolic incrusting polymer in secondary plant cell walls.
Beside the complex variety of chemical constituents, the plant cell wall of wood consists of different sublayers (S1, S2, and S3) formed at different periods during cell differentiation (Plomion et al., 2001). The S2 layer is the thickest (75–85% of the total thickness of the cell wall) and most important for mechanical stability (Fengel and Wegener, 1989). By contrast, the S1 and S3 layers are relatively thin, but are nevertheless thought to have a crucial role in strengthening the cell against deformation by water tension forces and limiting the maximum diameter increase of the S2 layer (Booker and Sell, 1998). The chemical composition of the cell wall and the alignment of the cellulose microfibrils (microfibril angle, MFA) in the different layers show significant inter- and intraspecies variability and determine the different properties and functions (Booker and Sell, 1998; Barnett and Bonham, 2004). By changing cell geometry, increasing lignin content, and laying down the microfibrils with a high angle, for example, so called compression wood is built in softwood trees to pre-stress their tissues in order to put stems or branches upright (Burgert et al., 2007). Because of the importance of the MFA for material property and function many microscopic measurement techniques exist to measure tracheids or fibres, or the measurement of bulk wood samples using X-ray diffraction or near infrared (NIR) spectroscopy (Donaldson, 2008). Position-resolved synchrotron X-ray microdiffraction even gave a complete image of the helical arrangement of the cellulose fibrils in the S2 layer of wood cells (Lichtenegger et al., 1999). Nevertheless, a fast laboratory method with resolution at the micron level and applicability on wood as well as other plant tissues is still desirable and the feasibility of confocal Raman microscopy was investigated in this study.
Raman microscopy has been successfully applied to plants in order to acquire information concerning the molecular structure and composition in a close to native state and it began with the investigation of cellulose (Atalla et al., 1980, 1984; Wiley and Atalla, 1987). During recent decades, micro-Raman spectroscopy was successfully applied to investigate non-destructively different natural cellulosic plant fibres, including the general characterization as well as the analysis of the molecular changes during mechanical processing, tensile deformation, and chemical treatments (Edwards et al., 1997; Himmelsbach et al., 1999; Eichhorn et al., 2001; Jähn et al., 2002; Morrison et al., 2003; Fischer et al., 2005; Gierlinger et al., 2006; Peetla et al., 2006; Schenzel et al., 2009). Furthermore the preferential orientation of the functional groups of plant polymers was derived from the response of the intensities of characteristic bands with changing polarization of the incident exciting radiation relative to the fibre axis (Atalla et al., 1980; Atalla and Agarwal, 1985). Most recently, it allowed molecular changes to be followed at the hierarchical level of individual cells and/or cell wall layers (Röder et al., 2004; Agarwal, 2006; Gierlinger and Schwanninger, 2006).
The functional characteristics of cell walls depend on the composition of the cell wall polymers as well as on their highly ordered architecture at scales from a few nanometres to several microns. The Raman spectra of plant cell walls comprise information on the chemical composition along with changes in architecture (orientation of cellulose microfibrils). By mapping cross-sectional areas, changes in chemistry as well as microfibril orientation can be visualized at the cell and cell wall level (Gierlinger and Schwanninger, 2006, 2007). The orientation dependency of the spectra had already been used to determine the cellulose microfibril orientation in pulp fibres (Pleasants et al., 1998). In this work, a detailed investigation of spectral changes due to orientation was tackled as a basis to determine microfibril orientation on Raman images in single cells and cell wall layers. Thus a fast laboratory method to investigate the microfibril angle at the micron level, together with the chemical composition in the cell wall layers of different plant tissues, will be realized.
Materials and methods
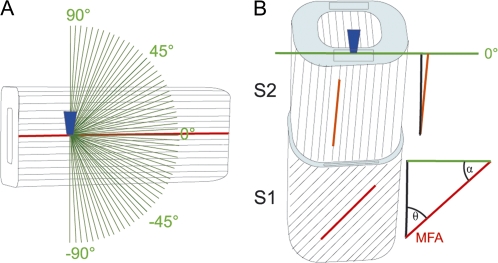
Spectra were acquired with a Confocal Raman microscope (CRM200, Witec, Germany) equipped with a piezo scanner (P-500, Physik Instrumente, Karlsruhe, Germany). A linear polarized laser (diode laser, λ=785 nm, CrystaLaser, Reno, NV, USA, 70 mW) was focused with a diffraction limited spot size and the Raman light passing a 50 μm multimode fibre followed by a grating (300 g mm−1, NIR-blazed) spectrograph (Acton, Princeton Instruments Inc., Trenton, NJ, USA) detected by a deep depletion spectroscopic CCD camera (DU401A-BR-DD, Andor, Belfast, North Ireland). For investigating the spectral dependency between cellulose fibril and laser orientation direction, and calibration of the cellulose microfibril orientation, single spectra with an integration time of 10 s were acquired with a ×10 objective (Nikon, NA=0.25) from the tangential surface of a single spruce (Picea abies) latewood fibre (microfibril angle <10°), isolated mechanically with tweezers. This type of fibre was chosen because of the almost parallel alignment of the cellulose fibrils and a very thick S2 and a thin S1 layer to acquire spectra with the focal plane in the S2 layer. Spectra were recorded on a dry fibre whilst changing the polarization of the incident laser in 3° steps around 180° (Fig. 1A), resulting in 64 spectra from one position. The mapping (Raman imaging) was done on epoxy resin-embedded wood blocks, the surfaces of which were absolutely flat by cutting with a diamond knife. A water immersible objective from Nikon (×60, NA = 0.8), an integration time of 0.5 s, a scanning area of 40×40 μm, and a scanning step size of 0.33 μm was chosen.
Fig. 1.
Schematic drawing of the experimental set-up. (A) The laser beam is focused through a microscopic objective (dark blue) within the tangential S2 layer of a single latewood fibre, in which cellulose fibril orientation is known to be parallel without an angle with respect to the fibre axis. Spectra are acquired from one position while changing the laser polarization direction in 3° steps (green lines) to investigate the dependency between cellulose fibril orientation and laser polarization direction. (B) The laser beam (microscopic objective, dark blue) is focused on a cross-sectional area (light blue) of embedded wood samples and an area of 40×40 μm scanned with the laser polarization direction (green line) always parallel to the tangential cell wall. By extracting spectra from cell wall areas parallel to the laser polarization direction (black rectangles) the angle between cellulose orientation and the laser polarization direction (α) can be predicted from the spectral characteristics of the cell wall layers in order to calculate the microfibril angle (MFA, θ=90–α).
The ScanCtrlSpectroscopyPlus software (Witec, Germany) was used for the measurement set-up and image processing and the OPUS software (Bruker, Germany) for spectra manipulation and Partial least squares (PLS) regression analyses. Before calculating the band height ratios, a baseline correction (concave rubberband, 64 points) was performed and, for the PLS modelling, in addition a normalization on the 1122 cm−1 band. The aim of a PLS-model is to determine the property Y of a system from an experimentally observable X, whereby X and Y are correlated by a calibration function b(Y=X×b). The vector Y consists of the component values as determined by the reference measurements. The row vectors of the matrix X are formed from the calibration spectra. The vector b is determined and used for the prediction of unknown values for Yn. Sixty-four spectra were used for cross validation (always one sample left out for validation) and, for test set validation, half of the samples were used as a test set. Wavenumber selection was done iteratively based on the visible differences in the spectra (Fig. 2) and the loadings calculated using the whole wavenumber range. The loadings (factors) describe the weighting of the individual x-variables with regard to their contribution to the variance. They allow to determine which data points make the biggest variance between the samples in order to assess the importance of the individual variable for the calibration. The optimal number of PLS components (factors) was estimated by the OPUS software, as described in Gierlinger et al. (2002).
Fig. 2.
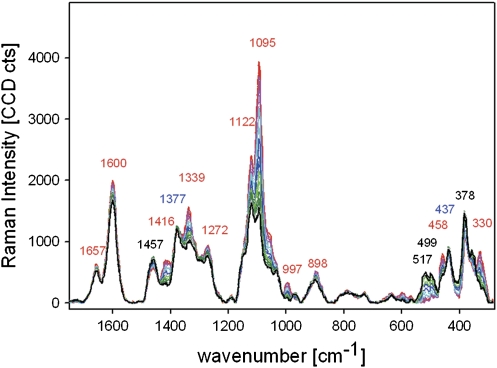
Changes in the fingerprint region of baseline corrected spectra acquired from one position of the tangential S2 layer of a mechanically isolated single spruce latewood fibre whilst rotating the polarization direction of the incident laser in 3° steps from parallel (0°, red) to perpendicular (90°, black) with respect to the fibre axis (red: 0, 3, 6, 9°, pink: 12, 15, 18, 21°; turquoise, 24, 27, 30, 33°; blue, 36, 39, 42, 45; light green, 48, 51, 54, 57°; green: 60, 63, 66, 69°; grey: 72, 75, 78, 81°; black: 84, 87, 90, 93°).
The established regression models were used to predict the microfibril angle (MFA) of the cell wall layers distinguished on embedded spruce (Picea abies) wood cross-sections by Raman imaging. Samples included spruce latewood with a mean MFA of 0° (LW00) and 20° (LW20) and spruce opposite (OW35) and compression wood (CW50) of a branch with a MFA of 35° and 50°, respectively. Characteristics of these samples and their preparation were described in detail in Gindl et al. (2004) and the microfibril angle, estimated by X-ray diffraction, served as a control for the values predicted with the new Raman approach. Based on Raman images, average spectra were extracted from the secondary cell wall layers distinguished. Always four spectra of S1 and S2 were extracted separately from different cell walls aligned parallel to the laser polarization direction (Fig. 1B). The band height ratios or normalized spectra, together with the established PLS-models, were used to calculate the angle between cellulose orientation and laser polarization direction (α). From this, the local MFA (θ, angle of cellulose fibril orientation with respect to the fibre axis) was calculated (Fig. 1B).
Results and discussion
In the Raman spectrum of the multicomponent material wood many bands are broad and overlapping (Fig. 2). So far, most of black spruce Raman features (Picea mariana) could be assigned to cellulose and lignin, whereas contributions of hemicelluloses occurred at similar wavenumbers to cellulose and could not be clearly distinguished (Agarwal and Ralph, 1997). But beside the different components, the cellulose orientation influences the wood spectra (Gierlinger and Schwanninger, 2007) and this influence has to be understood as well.
Spectral changes due to orientation
The tangential surface of a single latewood fibre was chosen to investigate spectral changes in context with orientation because (i) the cellulose microfibrils are oriented parallel with an angle smaller than 10° with respect to the fibre axis and (ii) the S2 layer is very thick (2–4 μm), which allows focusing within one single tangential S2 layer (Fig. 1A). Spectra were acquired at the same position whilst changing the incident laser polarization direction in 3° steps from the perpendicular with respect to the fibre axis (90°) to parallel (0°) and again to perpendicular (–90°) (Fig. 1A). By this, spectral changes due to composition were excluded and changes due to orientation could be analysed. Figure 2 shows that almost all bands showed changes during the rotation of the polarizer, except the two cellulose bands at 1377 cm−1 and 437 cm−1, assigned to HCC, HCO, and HOC bending and some heavy atom stretching (Agarwal, 1999), respectively. Most of the bands showed an increase when the electric vector changed from perpendicular (90°, black) to parallel (0°) with respect to the fibre axis (Fig. 2). The highest increase was observed for the band at 1095 cm−1, attributed to C-C and C-O stretching (Agarwal, 1999). A small decrease was found for the bands at 1457 cm−1 (HCH and HOC bending), 517 cm−1, 499 cm−1, and 378 cm−1 (all heavy atom stretching) (Fig. 2) and thus more perpendicular alignment of these functional groups was assumed.
For the lignin marker bands at 1657 cm−1 and 1600 cm−1 (Agarwal and Ralph, 1997) a small increase was found with the incident laser parallel to the fibre axis. Lignin was shown to have a preferred orientation within the wooden cell wall (Atalla and Agarwal, 1985). Nevertheless the orientational effect observed for lignin in the latewood fibres was very small and much less when compared to the cellulose bands (Fig. 2).
Relationship between intensity and angle of laser orientation
To exclude intensity changes due to optical effects when rotating the polarizer or due to changes in focus, and to be able to compare and analyse measurements with different integration time and thus intensity, detailed analyses were done either with band height ratios or with normalized spectra.
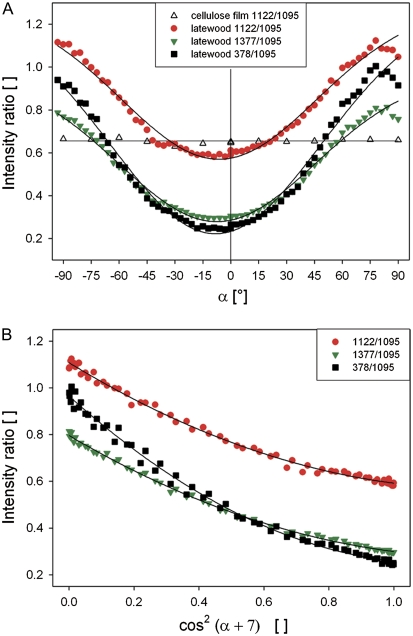
Most of the observed spectral changes in the wood spectra were supposed to derive from the anisotropic parallel alignment of the cellulose molecules in spruce latewood fibres. Analysing an isotropic film of bacterial cellulose, the 1095 cm−1 band was not changing in relation to the 1122 cm−1 band (Fig. 3A, blue points). Plotting the ratio of these two bands for the latewood fibre (Fig. 3A, red points) displayed the clear dependency between intensity and angle of incident laser polarization. It revealed a cos function, with the minimum not exactly at zero, but at –7°. A similar curve progression was found for the ratio 1377/1095 cm−1 (Fig. 3A, green points) and 378/1095 cm−1 (Fig. 3A, black points). The minimum at –7° can derive from slight misalignment between the fibre axis and the laser polarization direction or from the fact that the cellulose orientation (microfibril angle, θ) in the latewood fibre is not strictly parallel, but with an angle of 7°.
Fig. 3.
(A, B) Relationship between the angle of laser polarization (α) and the intensity ratio of cellulose bands in latewood fibres (black, red, green; A, B) and an isotropic bacterial cellulose film (blank triangles; A). Accounting for the cos function and the shift of 7° gives a quadratic regression (B). (This figure is available in colour at JXB online.)
A parallel alignment between the cellulose molecules and the incident laser polarization was thus not at 0°, but at –7°. For calibration purposes the angle was therefore shifted about 7° and the cos function accounted (Fig. 3B). Quadratic regressions described the strong relationship between the three selected band intensity ratios and the angle between cellulose molecule and laser polarization (Fig. 3B; Table 1). For all three intensity ratios high R2 (>0.99) and low standard error of estimates (<0.033) were calculated (Table 1). These quadratic regressions and the PLS-models established in the next step will be used to predict the angle of cellulose orientation from average spectra extracted from Raman images of cross-sections.
Table 1.
Statistics of the quadratic regressions describing the relationship between selected band height ratios and the polarization direction of the laser
| y=y0+ax+bx2 | R2 | Standard error | y0 | a | b | PRESSa |
| 1122/1095 | 0.9918 | 0.0335 | 3.507 | −5.602 | 2.208 | 0.0727 |
| 1377/1095 | 0.9961 | 0.0229 | 2.1324 | −4.6192 | 2.4624 | 0.0341 |
| 378/1095 | 0.9942 | 0.0281 | 1.654 | −3.084 | 1.445 | 0.0517 |
PRESS=predicted residual error sum of squares.
Partial least square regression models
As shown in the beginning, the bands of the wood spectra are broad and overlapping and the intensity of most of them is dependent on the angle between polarization direction and fibre (cellulose molecule) axis (Fig. 2). Therefore, making use not only of single spectral points, but of spectral features over a wide range by using multivariate analysis should give a more accurate description.
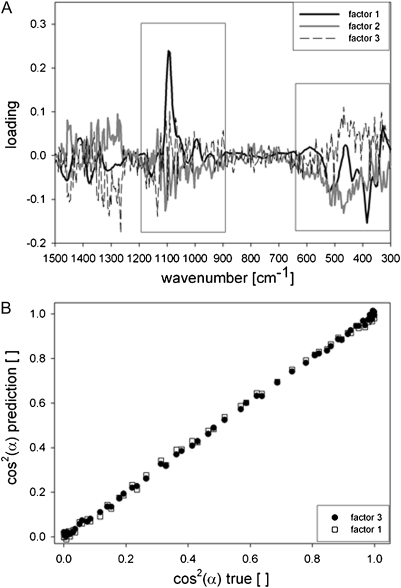
Several partial least square (PLS) regression models were established with spectra normalized on the 1377 cm−1 or 1122 cm−1 band. The 1377 cm−1 band was chosen, because this band was least affected by orientation changes (Fig. 2), but resulted in less good models and prediction compared to normalization on the 1122 cm−1 band (data not shown). The 1122 cm−1 band was seen to increase moderately (Fig. 2), but was applicable as an intensive band, which can clearly be distinguished in all plant cell wall spectra, from which we want to determine the cellulose orientation in the next step. The lignin region was omitted and the spectral range selected according to the loadings of the first factors (Fig. 4A). The best model statistics were achieved with the spectra normalized on the 1122 cm−1 band and restricting the wavenumber region to 1208–887 cm−1 and 634–293 cm−1 (Fig. 4B; Table 2).
Fig. 4.
(A, B) Loadings of the PLS-vectors (A), when regressing the baseline corrected normalized (1122 cm−1) spectra against the changing laser polarization angle [cos(α)2]. Relationship between true and predicted values in the cross validation using the wavenumber regions with high loading from 1208 to 887 cm−1 and 634 to 293 cm−1 (boxes in A) and three factors (black dircles) and one factor (white squares), respectively (B).
Table 2.
Results of the PLS-models using the wavenumber range from 1208 cm−1 to 887 cm−1 combined with 634 cm−1 to 293 cm−1
| Factor | R2(CAL) | R2(CV) | RMSECV | R2(TS) | RMSEP |
| 3 | 0.999 | 0.999 | 0.0087 | 0.999 | 0.0098 |
| 1 | 0.998 | 0.998 | 0.0147 | 0.998 | 0.0148 |
Models with three factors (components) and one factor were established and evaluated (CAL, calibration; CV, cross validation; TS, test set validation; RMSECV, root mean square error of cross validation; RMSEP, root mean square error of prediction).
The optimal suggested number of PLS-factors was three and led to a model with a high R2 (CV) of 0.999 and low root mean square error of cross validation (RMSECV) and test set validation (Table 2). Nevertheless, a closer look at the loadings of the PLS factors show that already the second and third factors seem to correlate more with noise than representing a real variance in the spectral dataset (Fig. 4A). Therefore, a model based on only one PLS-factor was also validated and resulted still in very good statistics (Fig. 4B; Table 2).
Prediction of cellulose orientation in cell wall layers of spruce cross-sections
For Raman imaging the cross-sectional surfaces of embedded wood fibres were prepared as a flat surface by cutting with a diamond knife. Area mapping (x–y) of cross-sections is advantageous to depth scanning (z) of fibres as a better lateral resolution is achieved and no intensity changes due to changing scattering conditions in the depth have to be dealt with.
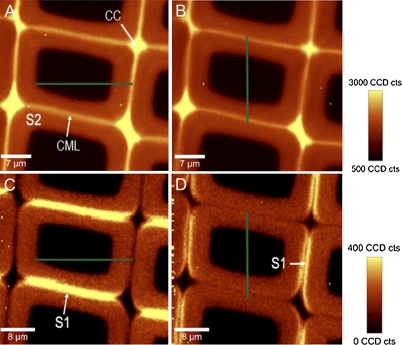
On the cross-sectional areas the cell wall layers can be visualized by integrating over different wavenumber ranges (Fig. 5A–D). By integrating over the lignin band, the highly lignified cell corners (CC) and compound middle lamella (CML) are distinguished from the secondary cell wall (S2) in spruce latewood (Fig. 5A). The direction of the incident laser polarization direction has no influence on the lignin integration and the same results are observed on turning the laser polarization from 0° (parallel to the x-axis) to 90° (perpendicular) (Fig. 5A, B). Restricting the integration on the 1097 cm−1 cellulose band highlights a small layer in the laser polarization direction (Fig. 5C, D). Consequently, if the laser is parallel to the x-direction the tangential walls are emphasized (Fig. 5C), while if the laser is perpendicular to the x-direction the radial walls show high intensity (Fig. 5D). This small layer represents the S1 layer and shows high intensity, because the microfibril angle (MFA) is large and thus the cellulose fibrils and the C-C, C-O stretching are not strictly perpendicular like in the S2, but with an angle (Fig. 1B).
Fig. 5.
(A–D) Raman mappings of spruce latewood with the incident laser polarization direction (green lines) parallel to the x-axis (A, C) and parallel to the y-axis (B, D). Integration over the lignin bands (1542–1696 cm−1) results in identical Raman images (A, B), whereas integration over the orientation-sensitive cellulose band at 1095 cm−1 enhances the S1 layers with a high microfibril angle in the polarization direction (C, D). Spectra for microfibril angle prediction were extracted from the separated layers parallel to the laser polarization direction (tangential walls C, radial walls D).
If the fibre axis in the embedded sample is exactly normal to the cut cross-sectional surface of the wood fibres, the angles between fibre axis and cellulose molecule and incident laser polarization are well defined (Fig. 1B) and can be determined because (i) the Raman signal is always dependent of the angle between cellulose fibril orientation and polarization direction and independent of the direction of the laser beam; (ii) to describe fibril orientation in 3D, two angles are necessary for fibril orientation. One angle is known, as the cellulose microfibrils are always aligned parallel to the cell wall, and only the angle with which they run along the cell wall (0° with respect to the fibre axis or with an angle) changes; (iii) therefore, on cross-sectional areas where the cell wall is parallel to the laser polarization direction (Fig. 1B, black rectangles), the Raman signal depends on the angle of alignment of the microfibrils (MFA) and can be determined.
Average spectra were extracted from the Raman images (Fig. 5C, D) by marking the S1 and S2 layers separately. The chosen pixels were restricted to cell wall areas parallel to the laser polarization direction. Four different cell wall areas were always selected per image and the angle between laser polarization and cellulose molecule (α) was predicted based on the quadratic regressions (Table 2) and the established PLS-models (Table 3) to calculate the MFA (θ=90–α). The average MFA of the four predictions are listed for all the developed methods in Table 3 and are compared with the results based on X-ray diffraction of the study of Gindl et al. (2004). In latewood, the microfibril angle estimated with X-ray diffraction was 0°, meaning the alignment of the cellulose fibrils (molecules) was without an angle along the fibre axis. The Raman approaches resulted in average values between 0–11.76° for the S2 layer and 34.03–52.78° for the S1 layer (Table 3). The radial and tangential walls resulted in similar predicted MFA (Table 3).
Table 3.
Average microfibril angles (MFAs) in degrees predicted by the different Raman approaches from spectra of the tangential (tang) and radial (rad) S1 and S2 layer [extracted from the Raman images (Figs 5–6) of four different positions per layer parallel to the laser polarization direction] are compared among themselves and to the MFA determined (for the S2-layer) by X-ray diffraction (Gindl et al., 2004)
| Sample | Layer | MFA X-ray | 1377/1095 | 1122/1095 | 378/1095 | PLS_3 | PLS_1 | Mean |
| Latewood (LW00) | S2 rad | 0 | 0 | 1.79 | 9.9 | 11.76 | 10.79 | 6.86 |
| S2 tang | 0 | 1.34 | 9.41 | 10.41 | 6.64 | 5.56 | ||
| S1 tang | – | 36.80 | 48.88 | 50.05 | 50.06 | 47.12 | 46.58 | |
| S1 rad | 34.03 | 47.95 | 52.78 | 51.99 | 47.50 | 46.85 | ||
| Latewood (LW20) | S2 tang | 20 | 14.06 | 24.40 | 26.34 | 27.66 | 26.79 | 23.85 |
| S1 tang | – | 41.05 | 54.66 | 60.15 | 54.43 | 52.58 | 52.57 | |
| Opposite wood (OW) | S2 tang | 35 | 32.80 | 37.26 | 37.17 | 41.73 | 41.36 | 38.06 |
| S1 tang | – | 39.13 | 49.52 | 53.33 | 54.89 | 52.18 | 49.80 | |
| Compression wood (CW) | S2 tang | 50 | 30.21 | 40.34 | 49.37 | 49.29 | 48.28 | 43.51 |
| S1 tang | – | 32.81 | 64.98 | 63.84 | 67.60 | 65.24 | 58.90 |
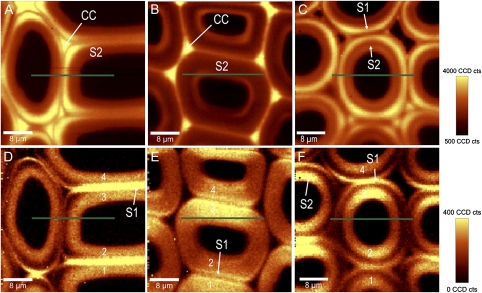
In addition to the latewood with 0° microfibril angle, spruce latewood with a higher microfibril angle and opposite and compression wood of a branch were mapped (Fig. 6A–F). The other latewood again shows higher lignin content in the CC, but also an increase of lignin in the corners of the secondary cell wall (Fig. 6A). The 1095 cm−1 band integration reveals an S1 thicker than in the latewood before. The MFA values predicted by the equations and models were between 14.06° and 27.66° for the S2 and between 41.05° and 60.15° for the S1 (Table 3). The 20° determined by X-ray was in between, but four of the approaches predicted higher values. The opposite wood again showed in the CC higher lignin content, but also an increase towards the lumen (Fig. 6B). The high intensity of the 1095 cm−1 band in the laser polarization direction in the S2 layer pointed to high MFA (Fig. 6E), confirmed by the predicted average values of 32.8° to 41.73° (Table 3). The highest MFAs were calculated for the compression wood, which had typically round cells and a highly lignified cell wall layer between S1 and S2 (Fig. 6C, F). The S1 was relatively thick (∼1 μm) and the Raman approach predicted a maximum average value of 67.66° in the S1, compared to a maximum of 49.37° in the S2 (Table 3).
Fig. 6.
(A–F) Changes in lignin amount (integral from 1542–1696 cm−1) in normal latewood (A), opposite (B), and compression wood (C) of spruce with the laser polarization direction parallel to the x-axis (green lines). Differences in cellulose orientation are visualized by integrating from 1063–1102 cm−1 (D–F) and spectra for microfibril angle prediction extracted separately from four tangential cell wall layers (1–4).
Comparison of Raman approaches and X-ray diffraction
Most of the approaches based on the band height ratios and the multivariate model resulted in very similar results, except the approach including the 1377 cm−1 band (Table 3). Although this band was identified as an orientation insensitive band (Fig. 2) and therefore promising for normalizing and building ratios (Fig. 3), the predicted values were much lower than the MFAs based on the 1122 cm−1 and 378 cm−1 bands and the PLS-models (Table 3). One reason for this underestimation could be changing lignin content and composition, as shoulders of lignin are reported between 1363−1 and 1393 cm−1 (Agarwal and Ralph, 1997). This assumption is strengthened by the fact that, particularly in the compression wood with the highest lignin content, the predicted MFA differ most (Table 3). The 1377/1095 approach was thus assumed as not qualified and no longer included in the discussion and summing up figure (Fig. 7).
Fig. 7.
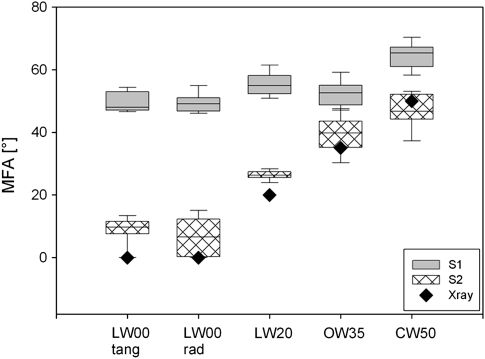
Microfibril angles (MFA) of S1 (grey) and S2 (black patterns) predicted by using the established equations and models (Tables 1, 2) on the spectra extracted from the tangential (tang) and radial (rad) walls of the Raman images and compared with the MFA determined by X-ray diffraction by Gindl et al. (2004) (black diamonds). The boundary of the box closest to zero indicates the 25th percentile, the line within the box marks the median, and the boundary of the box farthest from zero indicates the 75th percentile. Whiskers above and below the box indicate the 90th and 10th percentiles.
The MFAs predicted by the other four approaches for the S2 layer coincided with the X-ray determinations (Fig. 7). The predicted MFA for the S2 of the latewood samples were slightly higher than the X-ray data, opposite wood still showed this tendency, while the high angle in the compression wood were in agreement with the X-ray data (Table 3; Fig. 7). The two approaches gave similar results over a wide range of MFAs (0–50°; Fig. 7), although not exactly the same specimen was investigated and the X-ray data resulted from a mean value over more fibres while the Raman approach measurement was very local. Already (Pleasants et al., 1998) used the 1094–1122 cm−1 ratio to determine a mean MFA of bleached pulp fibres and found good correlations with the cell wall striation method, but poor correlation with the polarized microscopy and aperture angle methods.
The values for the S1 layer ranged from a minimum of 47.12° in latewood to a maximum of 67.60° in compression wood (Table 3). Although the S1 layer can be separated as a layer in all samples (Figs 5, 6), contributions of the S2 layer have to be assumed in the S1 spectra. In the samples with a relatively thick S1 layer (Fig. 6D, F) the highest, more realistic values, were determined (Fig. 7). Compared to other studies the values were similar or lower, for example, for S1 in spruce ∼70° were reported by X-ray (Muller et al., 2002) or for Pinus radiata 79–177° (Donaldson and Xu, 2005). In our case it is not a snapshop of one position within the S1, but an average, and includes the transition zone found towards the S2 (Donaldson, 2008). Due to the influence of the S2 the MFAs in the S1 might be underestimated. The S3 layer in these samples was too thin to be visualized by the Raman imaging approach.
To achieve spatial resolution at the cell level with position resolved X-ray diffraction, synchrotron radiation is needed, while confocal Raman microscopy can be performed in the laboratory with higher spatial resolution.
Drawbacks and assets
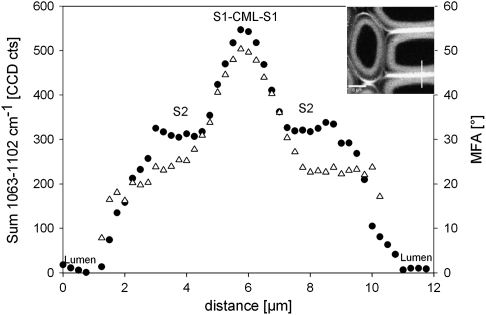
Due to changes in cellulose orientation, the S1 layer can be visualized in the Raman images of wood cross-sections. The estimated MFAs were much higher than in the S2, but were underestimated compared to other methods due to the inclusion of the transition zone and the limit of diffraction limited lateral resolution. Also a clear increase is seen towards the S1, the increase of the integrated intensity of the cellulose band as well as the calculated MFA is gradual (Fig. 8). With a scanning step size (0.25 μm) below the lateral theoretical spatial resolution, the neighbouring area always influences the spectra and, secondly, a natural gradual increase is also proposed within the S1 towards the middle lamella (Donaldson, 2008). So, even if layers can clearly be separated by the Raman imaging approach, adjacent regions can contribute to the Raman spectra if layers smaller than 1 μm are analysed in detail. The mapping approach and pixelwise post-extraction of spectra has the advantage of being able selectively to choose the area for detailed analysis and to exclude borders or gradients which might influence the true values. Within the S2 the predicted MFA values were between 16° and 23° and reached a plateau in the S1 of 50°. Although the MFA values across the cell wall (Fig. 8) are based on more noisy single spectra the predictions are similar to the ones based on the average spectra (Table 3).
Fig. 8.
Intensity of the orientation sensitive 1097 cm−1 band (black circles) and microfibril angles (MFA, triangles) predicted by the PLS1 model from single spectra extracted of every pixel along the line marked in the inset (LW20).
The spatial resolution could be improved slightly by using a laser with a wavelength of 532 nm and an oil immersible objective with higher numerical aperture (1.25). Nevertheless, the use of a 532 nm laser results in less good cellulose signals in highly lignified samples (e.g. compression wood) or layers due to a severe increase in fluorescence.
The prerequisite for determining true α and MFA (θ) is that sample preparation and alignment are done with great care. The fibres axis has to be exactly at 90° to the cross-sectional area as well as the radial and tangential cell walls defined with respect to the laser polarization direction (Fig. 1B). The influence can be seen by comparison of the tangential and radial walls (Fig. 5A): the radial walls were more parallel to the polarization direction and result in lower MFAs than the tangential walls, which were aligned with an angle with respect to the laser polarization direction (Figs 5, 7). In addition, differences between the S2 walls of one fibre, as in Fig. 6E or shown in a previous study (Konnerth et al., 2009), might derive from improper 90° fibre alignment and resulted in Fig. 6E in a difference of 16° on cell walls 2 and 3. So it is assumed that exact values can only be measured if proper sample preparation and alignment is achieved.
One outstanding advantage of the Raman imaging approach is that MFA and lignin content can be determined at once and on embedded samples the mechanical properties can also be determined at the same positions by nanoindentation (Konnerth et al., 2009).
Conclusions
With proper geometric sample preparation and alignment with respect to the laser polarization direction, MFA measurement can complete the picture of the chemical cell wall design gained by the Raman imaging approach at the micron level. By this, the MFA of different cell types can be revealed, for example, parenchyma, vessels, fibres in hardwoods or roots, together with chemical information and even the radial and tangential cell walls of one fibre compared.
Acknowledgments
Notburga Gierlinger acknowledges financial support by the APART programme of the Austrian Academy of Sciences.
References
- Agarwal UP. An overview of Raman spectroscopy as applied to lignocellulosic materials. In: Argyropoulos DS, editor. Advances in lignocellulosics characterization. Atlanta, GA: TAPPI Press; 1999. pp. 209–225. [Google Scholar]
- Agarwal UP. Raman imaging to investigate ultrastructure and composition of plant cell walls: distribution of lignin and cellulose in black spruce wood (Picea mariana) Planta. 2006;224:1141–1153. doi: 10.1007/s00425-006-0295-z. [DOI] [PubMed] [Google Scholar]
- Agarwal UP, Ralph SA. FT-Raman spectroscopy of wood: Identifying contributions of lignin and carbohydrate polymers in the spectrum of black spruce (Picea mariana) Applied Spectroscopy. 1997;51:1648–1655. [Google Scholar]
- Atalla RH. MIE Bioforum. Vol. 227. Suzuka, Japan: UNI Publisher Co,; 1999. The structure of native celluloses, and the origin of their variability; pp. 1–13. [Google Scholar]
- Atalla RH, Agarwal UP. Raman microprobe evidence for lignin orientation in the cell walls of native woody tissue. Science. 1985;227:636–638. doi: 10.1126/science.227.4687.636. [DOI] [PubMed] [Google Scholar]
- Atalla RH, Ranua J, Malcolm EW. Raman-spectroscopic studies of the structure of cellulose: a comparison of Kraft and sulfite pulps. Tappi Journal. 1984;67:96–99. [Google Scholar]
- Atalla RH, Whitmore RE, Heimbach CJ. Raman spectral evidence for molecular-orientation in native cellulosic fibres. Macromolecules. 1980;13:1717–1719. [Google Scholar]
- Barnett JR, Bonham VA. Cellulose microfibril angle in the cell wall of wood fibres. Biological Reviews. 2004;79:461–472. doi: 10.1017/s1464793103006377. [DOI] [PubMed] [Google Scholar]
- Booker RE, Sell J. The nanostructure of the cell wall of softwoods and its functions in a living tree. Holz Als Roh-Und Werkstoff. 1998;56:1–8. [Google Scholar]
- Brown RM, Saxena IM. Cellulose biosynthesis: a model for understanding the assembly of biopolymers. Plant Physiology and Biochemistry. 2000;38:57–67. [Google Scholar]
- Burgert I, Eder M, Gierlinger N, Fratzl P. Tensile and compressive stresses in tracheids are induced by swelling based on geometrical constraints of the wood cell. Planta. 2007;226:981–987. doi: 10.1007/s00425-007-0544-9. [DOI] [PubMed] [Google Scholar]
- Donaldson L. Microfibril angle: measurement, variation and relationships: a review. IAWA Journal. 2008;29:345–386. [Google Scholar]
- Donaldson L, Xu P. Microfibril orientation across the secondary cell wall of Radiata pine tracheids. Trees: Structure and Function. 2005;19:644–653. [Google Scholar]
- Edwards HGM, Farwell DW, Webster D. FT Raman microscopy of untreated natural plant fibres. Spectrochimica Acta Part A - Molecular and Biomolecular Spectroscopy. 1997;53:2383–2392. doi: 10.1016/s1386-1425(97)00178-9. [DOI] [PubMed] [Google Scholar]
- Eichhorn SJ, Sirichaisit J, Young RJ. Deformation mechanisms in cellulose fibres, paper and wood. Journal of Material Science. 2001;36:3129–3135. [Google Scholar]
- Emons AMC, Hofte H, Mulder BM. Microtubules and cellulose microfibrils: how intimate is their relationship? Trends in Plant Science. 2007;12:279–281. doi: 10.1016/j.tplants.2007.06.002. [DOI] [PubMed] [Google Scholar]
- Fengel D, Wegener G. Wood: chemistry, ultrastructure, reactions. Berlin: Walter de Gruyter and Co; 1989. [Google Scholar]
- Fischer S, Schenzel K, Fischer K, Diepenbrock W. Applications of FT Raman spectroscopy and micro spectroscopy characterizing cellulose and cellulosic biomaterials. Macromolecular Symposia. 2005;223:41–56. [Google Scholar]
- Gierlinger N, Schwanninger M. Chemical imaging of poplar wood cell walls by confocal Raman microscopy. Plant Physiology. 2006;140:1246–1254. doi: 10.1104/pp.105.066993. [DOI] [PMC free article] [PubMed] [Google Scholar]
- Gierlinger N, Schwanninger M. The potential of Raman microscopy and Raman imaging in plant research: review. Spectroscopy. 2007;21:69–89. [Google Scholar]
- Gierlinger N, Schwanninger M, Hinterstoisser B, Wimmer R. Rapid determination of heartwood extractives in Larix sp. by means of Fourier transform near infrared spectroscopy. Journal of Near Infrared Spectroscopy. 2002;10:203–214. [Google Scholar]
- Gierlinger N, Schwanninger M, Reinecke A, Burgert I. Molecular changes during tensile deformation of single wood fibres followed by Raman microscopy. Biomacromolecules. 2006;7:2077–2081. doi: 10.1021/bm060236g. [DOI] [PubMed] [Google Scholar]
- Gindl W, Gupta HS, Schöberl T, Lichtenegger HC, Fratzl P. Mechanical properties of spruce wood cell walls by nanoindentation. Applied Physics A: Materials Science and Processing. 2004;79:1141–1145. [Google Scholar]
- Gutierrez R, Lindeboom JJ, Paredez AR, Emons AMC, Ehrhardt DW. Arabidopsis cortical microtubules position cellulose synthase delivery to the plasma membrane and interact with cellulose synthase trafficking compartments. Nature Cell Biology. 2009;11:797–743. doi: 10.1038/ncb1886. [DOI] [PubMed] [Google Scholar]
- Himmelsbach DS, Khahili S, Akin DE. Near-infrared–Fourier-transform–Raman microspectroscopic imaging of flax stems. Vibrational Spectroscopy. 1999;19:361–367. [Google Scholar]
- Jähn A, Schröder MW, Füting M, Schenzel K, Diepenbrock W. Characterization of alkali-treated flax fibres by means of FT Raman spectroscopy and environmental scanning electron microscopy. Spectrochimica Acta Part A - Molecular and Biomolecular Spectroscopy. 2002;58:2271–2279. doi: 10.1016/s1386-1425(01)00697-7. [DOI] [PubMed] [Google Scholar]
- Klemm D, Heublein B, Fink HP, Bohn A. Cellulose: fascinating biopolymer and sustainable raw material. Angewandte Chemie-International Edition. 2005;44:3358–3393. doi: 10.1002/anie.200460587. [DOI] [PubMed] [Google Scholar]
- Konnerth J, Gierlinger N, Keckes J, Gindl W. Actual versus apparent within cell wall variability of nanoindentation results from wood cell walls related to cellulose microfibril angle. Journal of Material Science. 2009;44:4399–4406. doi: 10.1007/s10853-009-3665-7. [DOI] [PMC free article] [PubMed] [Google Scholar]
- Lichtenegger H, Muller M, Paris O, Riekel C, Fratzl P. Imaging of the helical arrangement of cellulose fibrils in wood by synchrotron X-ray microdiffraction. Journal of Applied Crystallography. 1999;32:1127–1133. [Google Scholar]
- Martin C, Bhatt K, Baumann K. Shaping in plant cells. Current Opinion in Plant Biology. 2001;4:540–549. doi: 10.1016/s1369-5266(00)00213-2. [DOI] [PubMed] [Google Scholar]
- Morrison WH, Himmelsbach DS, Akin DE, Evans JD. Chemical and spectroscopic analysis of lignin in isolated flax fibres. Journal of Agricultural and Food Chemistry. 2003;51:2565–2568. doi: 10.1021/jf020885t. [DOI] [PubMed] [Google Scholar]
- Muller M, Hori R, Itoh T, Sugiyama J. X-ray microbeam and electron diffraction experiments on developing xylem cell walls. Biomacromolecules. 2002;3:182–186. doi: 10.1021/bm015605h. [DOI] [PubMed] [Google Scholar]
- O'Sullivan AC. Cellulose: the structure slowly unravels. Cellulose. 1997;4:173–207. [Google Scholar]
- Peetla P, Schenzel KC, Diepenbrock W. Determination of mechanical strength properties of hemp fibres using near-infrared Fourier transform Raman microspectroscopy. Applied Spectroscopy. 2006;60:682–691. doi: 10.1366/000370206777670602. [DOI] [PubMed] [Google Scholar]
- Pleasants S, Batchelor WJ, Parker IH. Measuring the fibril angle of bleached fibres using micro-Raman spectroscopy. Appita Journal. 1998;51:373–376. [Google Scholar]
- Plomion C, Leprovost G, Stokes A. Wood formation in trees. Plant Physiology. 2001;127:1513–1523. [PMC free article] [PubMed] [Google Scholar]
- Röder T, Koch G, Sixta H. Application of confocal Raman spectroscopy for the topochemical distribution of lignin and cellulose in plant cell walls of beech wood (Fagus sylvatica L.) compared to UV microspectrophotometry. Holzforschung. 2004;58:480–482. [Google Scholar]
- Schenzel K, Almlof H, Germgard U. Quantitative analysis of the transformation process of cellulose I to cellulose II using NIR FT Raman spectroscopy and chemometric methods. Cellulose. 2009;16:407–415. [Google Scholar]
- Wiley JH, Atalla RH. Band assignments in the Raman-spectra of celluloses. Carbohydrate Research. 1987;160:113–129. [Google Scholar]


