

Abstract
• Background and Aims This study examined the physiological basis of the cost of reproduction in the epiphytic bromeliad Werauhia sanguinolenta, growing in situ in a tropical lowland forest in Panama.
• Methods Entire mature plants were sampled repeatedly over the course of 2 years, which represents the common interval between reproductive events. Due to the uncertainty concerning the appropriate currency of resource allocation to reproduction, the temporal changes of the contents of total non-structural carbohydrates (TNC) and of all major nutrient elements in different plant parts were studied (stems, green leaves, non-green leaf bases, roots and reproductive structures when present).
• Key Results Although TNC varied with time in all compartments, this variation was more related to seasonal fluctuations than to reproductive status. The contents of the nutrient elements, N, P, K, Mg and S, on the other hand, showed significant differences between reproductive and non-reproductive individuals, while Ca did not change with reproductive status. Differences in nutrient contents were most pronounced in stems. Seeds were particularly enriched in P, much less so in N and the other nutrient elements. Model calculations of nutrient fluxes indicate that a plant needs about 2 years to accumulate the amount of P invested in a fruit crop, while the estimated uptake rates for N were much faster.
• Conclusions Since most mature individuals of this species fruit every other year, it is hypothesized that P is the prime limiting factor for reproduction. These findings therefore add to an increasing body of evidence that P rather than N is limiting growth and reproduction in vascular epiphytes.
Keywords: Barro Colorado Island, Bromeliaceae; cost of reproduction, nitrogen; non-structural carbohydrates; nutrient uptake; phosphorus; reproductive investment, seeds, Werauhia sanguinolenta
INTRODUCTION
Reproduction is likely to compete for limiting resources with other plant functions such as growth. Indeed, most pertinent studies report a ‘cost of reproduction’, i.e. a reduction in future growth, survival, and/or reproduction after a fruiting event (Obeso, 2002). While such a trade-off between functions is conveniently included in a life history perspective (Crawley, 1997), the particular nature of the limitation at the physiological level is much more subject to debate. Most studies of the cost of reproduction are based on biomass, which implies that either carbon is the limiting resource or that other potentially limiting resources vary in parallel. However, neither biomass nor carbon seem to be the appropriate currency for reproductive investment because reproductive structures are in general partly self-supporting in terms of carbon (Ashman, 1994; Aschan and Pfanz, 2003). Moreover, there is evidence of substantial differences in the proportions of carbon and nutrients such as nitrogen or phosphorus that are allocated to reproductive structures (e.g. Benzing and Davidson, 1979; Fenner, 1986; Reekie and Bazzaz, 1987; Zotz, 1999).
It has been suggested that costs of reproduction should be most apparent in habitats with low resource availability or other stress conditions (Reznick, 1985). Consequently, vascular epiphytes should be ideal study organisms: even in wet tropical forests, tree canopies are generally characterized by frequent drought and low nutrient input (Benzing, 1990; Zotz and Hietz, 2001). Although evidence is available for very few of the approximately 20 000 species of vascular epiphytes, published data indicate that a substantial proportion of resources is spent in individual fruiting events (up to 30 % of total plant biomass; Benzing and Davidson, 1979; Zotz, 1999). This combination of low nutrient availability and high reproductive allocation should lead to severe costs of reproduction in vascular epiphytes, and that has indeed been documented in a number of reports (e.g. Ackerman, 1989; Zimmerman and Aide, 1989; Ackerman and Montalvo, 1990; Zotz, 1998; Schmidt and Zotz, 2002). A particularly well-documented case is that of the bromeliad, Werauhia sanguinolenta. In a long-term demographic study in central Panama, Zotz et al. (2005) observed that very few mature individuals of this species reproduced two years in a row, while cultivated plants in the greenhouse invariably did. Further evidence for a substantial cost of reproduction were a decrease in plant size in the year after reproduction and strongly increased mortality rates in smaller reproducing plants.
The current study was designed to explore the physiological basis of these observations. By repeatedly sampling entire Werauhia sanguinolenta plants between two fruiting events, changes in total biomass, non-structural carbohydrate (TNC) pools, and nutrient pools (N, P, K, Mg, S) were documented, which allowed an estimate of the respective fluxes. Since the correct currency of allocation is still controversial (Obeso, 2002), such a broad approach seemed necessary to address the question of the limiting resource for reproduction in this epiphyte.
MATERIALS AND METHODS
Habitat and study species
The study was carried out in the Barro Colorado Nature Monument (9°10′N, 79°51′W), Republic of Panama. The forest of this biological reserve is classified as a tropical moist forest (Holdridge et al., 1971). There is a pronounced dry season from late December to late April (Windsor, 1990). The rainfall during the present study was about 10 % below the long-term average of approx. 2600 mm (2000: 2494 mm; 2001: 2331 mm; 2002: 2301 mm). Detailed descriptions of vegetation, climate and ecology are reported elsewhere (Croat, 1978; Leigh et al., 1982).
Werauhia sanguinolenta (Linden ex Cogn. & Marchal) Grant [syn. Vriesea sanguinolenta Cogn. & Marchal (Grant, 1995)] is found from Costa Rica to Colombia and on various Caribbean islands in lowland to lower-montane wet forests (Croat, 1978; Schmidt and Zotz, 2002). It colonizes a number of host tree species high in the forest canopy, but is particularly abundant on flood-tolerant, evergreen Annona glabra L. (Annonaceae; Schmidt and Zotz, 2002). Both maximum leaf length (LL, in cm) and plant dry mass, which are highly correlated with each other (Schmidt and Zotz, 2002), are used as measures of plant size. Werauhia sanguinolenta is polycarpic, but individual shoots flower only once. Flowering occurs in the rainy season, fruits mature during the following dry season, and seeds are released in the second half of the dry season. Similar to many other epiphytic bromeliads (Martinelli, 1994; Bush and Beach, 1995; Cascante-Marin et al., 2005), the species is at least facultatively autogamous (Zotz, unpubl. data). Reproductive plants rarely fruit again in subsequent years, and most mature plants produce fruits every other year (Zotz et al., 2005).
In late 2000, 90 fruiting individuals of similar size (LL range from 67 to 84 cm) were located on A. glabra. At five times in the following 24 months (i.e. the beginning and the end of the following dry seasons in early January 2001, early May 2001, early January 2002, late April 2002, and late December 2002) four plants were randomly selected for harvesting. Plants were separated immediately into their component parts, i.e. upper parts of green leaves, non-green leaf bases of green leaves, living leaf bases of otherwise senesced leaves, stems, roots and, if present, infructescence, the latter separated into: (1) fruit stalk, (2) capsule walls without seeds, and (3) seeds (including coma hairs). After the determination of total fresh mass, representative subsamples were microwaved for 10 min to stop any further enzymatic activity and were subsequently dried in a freeze-drier.
Nutrient concentrations and contents
Mineral nutrient concentrations were determined with an ICP spectrometer (JY 70 plus; ISA, Munich, Germany) and a CHN-O element analyser (Heraeus, Hanau, Germany) at the University of Würzburg. Nutrient contents of component plant parts were then estimated by multiplication of nutrient concentrations by the biomass of each organ. Following Benzing and Davidson (1979), the ‘seed enrichment ratio’ was calculated as the quotient of the concentration of an element in seeds and the mean concentration of this element in all vegetative compartments.
It was frequently not possible to sample the total root mass and to distinguish consistently between live and dead roots. In the case of 12 plants where there is confidence that all roots had been recovered, their biomass ranged from 7·4–21·9 % total plant biomass (12·4 ± 1·42, mean ± s.e.) with varying, yet undetermined proportions of dead roots. Roots in these tank bromeliads function primarily as holdfasts (Benzing, 2000), which is consistent with low nutrient and TNC concentrations of live roots. Due to these sampling difficulties, nutrient and TNC contents of roots were not calculated, and proportional allocation of biomass, nutrients and TNC in this paper is consistently in terms of total plant biomass excluding roots.
Total non-structural carbohydrates
The soluble fraction of total non-structural carbohydrates (TNC) was extracted from ground samples (20 mg) with 0·5 mL of a mixture of methanol, chloroform and water (12 : 5 : 3, v : v : v) containing 200 mg phenyl β-d-glucopyranoside as internal standard at 60 °C for 30 min. After cooling to room temperature, 0·5 mL deionised water was added and phases were separated by centrifugation. Aliquots of 100 μL from the aqueous phase were taken to dryness under vacuum and soluble carbohydrates were converted into trimethylsilyl (TMSi) derivatives by treatment with 200 μL pyridine and 50 μL of a mixture of BSTFA/TMCS (N,O-bis-(trimethylsilyl)trifluoroacetamide : trimethylchlorosilane, 10 : 1, v/v) at 75 °C for 60 min. The sugar derivatives were separated and quantified by capillary GC (HP 5890 Series II, Hewlett-Packard, Vienna, Austria) on a fused-silica chemically bonded polydimethylsiloxane column (HP1, 15 m length, 0·53 mm i.d., and 0·15 µm film thickness).
Starch was quantified from 40 mg of ground plant material after careful extraction of soluble sugars with ethanol and cold water. One mL of heat stable α-amylase (from Bacillus licheniformis, 500 units, Sigma) was added to the sample and the suspension was incubated at 85 °C for 30 min. After centrifugation, 100 μL of the supernatant (containing solublized starch) was incubated with 0·5 mL amyloglucosidase (from Aspergillus niger, Roche) at 55 °C for 30 min. Chloroform (0·5 mL) was added and the samples mixed vigorously and centrifuged to precipitate proteins. Glucose in the supernatant was estimated by anion exchange chromatography with pulsed amperometric detection (Dionex DX 500, Carbopac PA 10, 50 × 2 mm) and isocratic elution with 100 mm NaOH. Total carbohydrate contents of component plant parts were estimated by multiplication of carbohydrate concentrations by the biomass of each organ.
Statistical analysis
Data analysis was carried out with STATISTICA software (version 5·1, StatSoft Inc., Tulsa, OK, USA). Whenever the assumptions of homoscedasticity and/or normality were not met, data were transformed (log or arcsin-square root) before analysis (Sokal and Rohlf, 1995). For reasons of clarity, the non-transformed data are shown in all figures and tables. All direct comparisons of reproductive and non-reproductive individuals were made without including the sample from May 2001, because the sampled plants had just shed their seeds and still bore dried capsule walls and green fruit-stalks.
RESULTS
Total plant biomass (excluding roots) showed rather moderate changes during the study period (Fig. 1; one-way ANOVA, F4,15 = 3·06, P = 0·049), although there was a consistent trend towards lower biomass at the end of the dry seasons and corresponding increases during the wet seasons, particularly in the second year (Newman–Keuls, P < 0·05). Fruit stalks measured between 1·03–1·59 m in length and had 39–107 capsule walls. Total biomass of reproducing individuals was significantly higher than that of non-reproductive ones (453 ± 76 g vs. 321 ± 111 g, respectively; t-test, t = 2·7, d.f. = 14, P = 0·02). Reproductive investments, i.e. the biomass proportion of reproductive structures (fruit-stalk, capsule walls, seeds) in relation to total plant biomass, ranged from 23–51 % (38 ± 5 %; mean ± s.e., n = 8) in individual plants, seeds themselves (including comas) accounting for 2–14 % of total biomass (6·6 ± 2·0 %).
Fig. 1.

Changes in total plant biomass (dry mass, circles) and the dry mass proportion of reproductive structures (black bars, fruit stalks; open bars, seeds) during a reproductive cycle. Different letters represent significant differences (ANOVA, Newman–Keuls post hoc test, P < 0.05). Data are means ± s.e.. Hatched bars at the top of the figure indicate rainy seasons.
Non-structural carbohydrate concentrations and contents
During the course of the 2-year study, whole-plant concentrations of total non-structural carbohydrates (TNC) varied from 2·6 % to 6·0 %, but there were no indications of a decrease in TNC during, or immediately after, a reproductive event (Fig. 2). On the other hand, the decrease in plant biomass at the end of the dry seasons was accompanied by a similar trend in carbohydrate concentrations (Fig. 2) and contents (data not shown). Temporal changes in contents and concentrations were consistent across compartments (Fig. 3, Table 1; ANOVA, interaction term n.s.). The highest concentrations of TNC in individual compartments were observed in stems, in which they accounted for, on average, more than 10 % of total dry mass (117 ± 15 mg g−1 dry mass; mean ± s.e., n = 20), while, at the other extreme, TNC concentrations in roots were lower by more than two orders of magnitude (1·1 ± 1·4 mg g−1 dry mass; mean ± s.e., n = 6).
Fig. 2.

Temporal changes in total non-structural carbohydrate (TNC) concentrations. Different letters represent significant differences (ANOVA, Newman–Keuls post hoc test, P < 0.05). F = Fruiting plants. Data are means + s.e.. Hatched bars at the top of the figure indicate rainy seasons.
Fig. 3.

Temporal changes in relative non-structural carbohydrates (TNC) contents (% total, bars) and relative biomass (% total, circles) of different compartments, from fruiting in early 2001 to the next reproductive event in late 2002. Note the different scale of the y-axes for green leaves. Data are means (n = 4). For statistical details, see Table 1. Hatched bars at the top of the figure indicate the rainy seasons.
Table 1.
Two-way ANOVA on the effects of time and compartment on total non-structural carbohydrate concentrations in W. sanguinolenta
| Factor | d.f. | F | P-value |
|---|---|---|---|
| Time (T) | 4 | 3·10 | 0·021 |
| Compartment (C) | 3 | 24·1 | <0·001 |
| T × C | 12 | 1·35 | 0·22 |
| Error | 60 |
Only those compartments present at all harvest dates were considered, i.e. reproductive structures were excluded.
Across all compartments, starch and sucrose each made up about 30 % of TNC, with glucose and fructose averaging approx. 25 % and approx. 15 %, respectively (data not shown). Individual compartments deviated substantially from these whole-plant means. For example, starch was the most important storage carbohydrate in seeds and roots (>50 %), but accounted for less than 20 % of TNC in stems or fruit-stalks. Conversely, in stems, the bulk of non-structural carbohydrates (>60 %) was sucrose, while the same sugar accounted for around 10 % of TNC in green leaves or even less (all other compartments).
Nutrient concentrations and contents
In contrast to TNC, temporal changes in nutrient contents and concentrations (data not shown) did not occur in parallel in all compartments, i.e. ANOVAs yielded a significant interaction term for N and K (Fig. 4, Table 2). Subsequently, reproductive and non-reproductive individuals were compared, excluding the plants sampled in May 2001, which still bore old, yet not senesced infructescences. Before lumping together plants collected at different times, a series of planned comparisons was conducted. Plants collected in the early and late dry season of 2002 (non-reproductive) did not differ in the concentrations of any of the six macronutrients (P >> 0·5). Reproductive plants sampled in early 2001 and late 2002 did not differ in N, P, K, Mg and S either, but varied in Ca (P < 0·001).
Fig. 4.

Temporal changes in relative nutrient contents (% total, bars) and relative biomass (% total, circles) of different compartments, from fruiting in early 2001 to the next reproductive event in late 2002. Data are means (n = 4). For statistical details, see Table 2. Hatched bars at the top of the figure indicate the rainy seasons.
Table 2.
Results of five two-way ANOVAs on the effects of time and compartment on the concentrations of N, P, K, Mg and S
| Macronutrient | Factor | d.f. | F | P-value |
|---|---|---|---|---|
| Nitrogen | Time (T) | 4 | 19·1 | <0·001 |
| Compartment (C) | 3 | 24·7 | <0·001 | |
| T × C | 12 | 2·4 | 0·01 | |
| Phosphorus | Time (T) | 4 | 13·3 | <0·001 |
| Compartment (C) | 3 | 17·8 | <0·001 | |
| T × C | 12 | 1·0 | 0·42 | |
| Potassium | Time (T) | 4 | 11·8 | <0·001 |
| Compartment (C) | 3 | 40·8 | <0·001 | |
| T × C | 12 | 4·38 | <0·001 | |
| Magnesium | Time (T) | 4 | 14·8 | <0·001 |
| Compartment (C) | 3 | 13·4 | <0·001 | |
| T × C | 12 | 0·86 | 0·59 | |
| Sulphur | Time (T) | 4 | 5·7 | <0·01 |
| Compartment (C) | 3 | 33·8 | <0·001 | |
| T × C | 12 | 1·5 | 0·13 | |
| Error | 60 |
Only those compartments present at all harvest dates were considered, i.e. reproductive structures were excluded.
In non-reproductive plants, nutrient concentrations were highest in stems, in which, for example, [N] averaged 6·8 mg g−1 and [P] 0·54 mg g−1 (Fig. 5), and lowest in old leaf bases: [N], 2·6 mg g−1; [P], 0·15 mg g−1. Nutrient concentrations in live roots (which were not consistently sampled) tended to be even lower (e.g. [P], 0·15 ± 0·02 mg g−1; [K], 0·39 ± 0·07 mg g−1; mean ± s.e., n = 6), with the exception of [N] (4·7 ± 0·08 mg g−1). Contrasting the nutrient concentrations in vegetative tissue during the reproductive and the non-reproductive phase (Fig. 5) revealed that the concentrations of P, K and Mg were reduced in all vegetative compartments, while stems were the only compartment also showing a consistent reduction in N and S during fruiting. Stems showed significant reductions in Zn (data not shown). The concentrations of immobile Ca, on the other hand, did not differ with reproductive phase in any compartment. Compared with vegetative tissue, P was by far more concentrated in seeds than any other element (Fig. 5). The seed enrichment ratio for P exceeded 10 and was thus more than twice that for N and almost four times that for K. Concentrations of Mg and S were similar to vegetative tissue or, in the case of Ca, even lower.
Fig. 5.
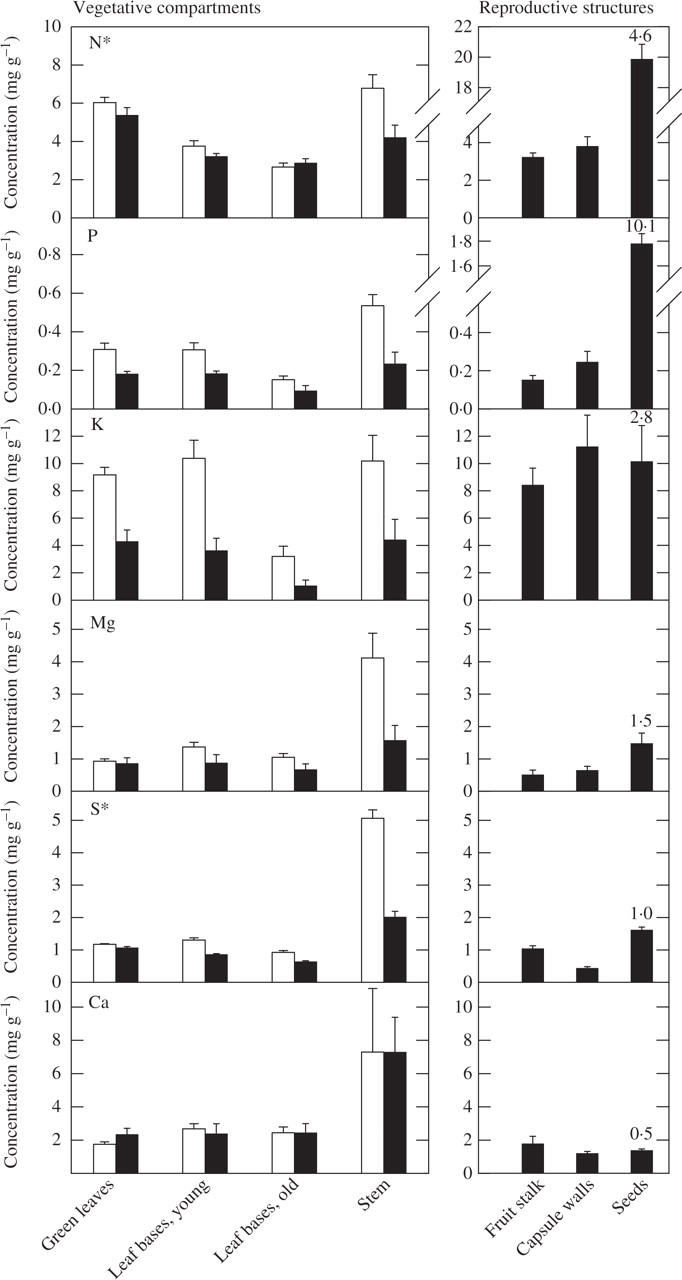
Nutrient concentrations in different compartments during the non-reproductive (open bars) and the reproductive phase (closed bars). Data are means ± s.e. of eight plants. An asterisk by the nutrient element indicates a significant interaction term (P < 0.05) in a two-way ANOVA with fruiting status and compartment as factors. The plots on the right give concentrations of reproductive structures. Note the different y-axes for N and P for vegetative compartments and reproductive structures. The numbers associated with seeds represent the mean seed enrichment ratio for each macronutrient.
Due to the highly varying concentrations of different macronutrients in seeds, fruit stalks and capsule walls, the biomass proportion of reproductive structures (approx. 36 %; Table 3) was not a good predictor for the relative investment of nutrients. In one extreme case, almost 60 % of the total P-pool of a fruiting plant was found in fruit stalk, capsule walls and seeds.
Table 3.
Relative contributions of different organs of fruiting plants to plant dry mass and total nutrient pools
| Compartment | Dry mass | N | P | K | Mg | S |
|---|---|---|---|---|---|---|
| Stem | 6·0 ± 1·0 | 6·0 ± 1·6 | 4·5 ± 0·7 | 4·7 ± 1·2 | 11·5 ± 1·2 | 10·5 ± 3·2 |
| Green leaves | 30·5 ± 2·3 | 33·7 ± 5·1 | 20·8 ± 3·6 | 25·2 ± 3·8 | 31·8 ± 2·4 | 35·1 ± 1·0 |
| Leaf bases (new) | 16·6 ± 2·1 | 10·5 ± 1·5 | 12·5 ± 2·4 | 11·0 ± 1·8 | 17·7 ± 1·8 | 14·4 ± 1·3 |
| Leaf bases (old) | 8·7 ± 1·1 | 4·1 ± 0·8 | 2·4 ± 0·8 | 2·6 ± 0·7 | 7·1 ± 0·7 | 5·4 ± 0·6 |
| Infructescence – stalk | 20·8 ± 1·7 | 13·0 ± 1·3 | 11·6 ± 1·4 | 33·0 ± 3·0 | 12·8 ± 1·3 | 21·1 ± 0·6 |
| Infructescence – capsule walls | 8·7 ± 1·4 | 5·8 ± 0·6 | 7·0 ± 1·3 | 13·8 ± 2·4 | 6·8 ± 0·5 | 4·3 ± 0·3 |
| Seeds | 6·4 ± 1·4 | 24·8 ± 5·9 | 39·8 ± 7·2 | 8·3 ± 1·0 | 11·5 ± 0·9 | 8·6 ± 0·4 |
| New rosette | 0·8 ± 0·3 | 0·7 ± 0·3 | 0·8 ± 0·4 | 1·2 ± 0·5 | 0·6 ± 0·1 | 0·4 ± 0·1 |
Data are mean percentages ± s.e. (n = 8 plants).
Estimation of nutrient fluxes
Determination of the biomass and nutrient concentrations of individual compartments allowed an estimate of net nutrient fluxes during a reproductive event (Fig. 6). As non-reproductive plants were sampled about 1 year after the last reproductive event, they could have partly replenished their nutrient pools during the 2001 rainy season. Consequently, the following estimates of external uptake refer to one season, i.e. the second rainy season of 2002. Note that all estimates do not include the possible costs of male function (pollen production). Because the biomass of vegetative compartments did not differ significantly in reproductive and non-reproductive individuals (t-tests, P > 0·05), significant variation in nutrient concentrations (Fig. 5) yielded similar differences in contents. For example, the lower concentrations of P in all vegetative compartments are equivalent to an estimated 40 mg P available for reproductive structures (Table 4, Fig. 6). Since the total P-content in fruit-stalk, capsule walls and seeds amounted to 77 mg, it is estimated that 37 mg or 48 % of the total needed had been taken up during a single rainy season. In contrast, nitrogen concentrations were lower only in stems, and external uptake must have played a much more important role: at least 922 mg or 87 % of the nitrogen pools of reproductive parts were procured during the preceding rainy season. Estimated pools of other nutrients (Table 4) were equal to, or even exceeded, the needs for K (93 %), S (99 %) and Mg (126 %).
Fig. 6.

Estimated pools (figures in bold) and fluxes (figures in italics) during reproduction. V = vegetative state; R = reproductive state. Each box represents a different compartment. Figures in each square are (A) P contents in mg plant−1 or (B) N contents in mg plant−1. Fluxes are estimated from the difference of P or N pools in the vegetative compartments during the vegetative and the reproductive state. ‘Net uptake’ is estimated as the difference of the nutrient content of reproductive organs and the sum of all fluxes from vegetative compartments. Corresponding estimates for all five macronutrients analysed are given in Table 4.
Table 4.
Pools of macronutrients (mg per plant) in different compartments of non-reproductive and reproductive plants
| Non-reproductive plants (V) |
Reproductive plants (R) |
|||||||||||
|---|---|---|---|---|---|---|---|---|---|---|---|---|
| Nutrient element | Green leaves | Leaf bases (young) | Leaf bases (old) | Stem | Green leaves | Leaf bases (young) | Leaf bases (old) | Stem | Fruit-stalk | Capsule walls | Seeds | Internal translocation |
| N | 798 | 293 | 113 | 235 | 798 | 247 | 113 | 148 | 322 | 157 | 577 | 134 (13 %) |
| P | 43 | 24 | 6 | 19 | 25 | 14 | 4 | 8 | 15 | 10 | 52 | 40 (52 %) |
| K | 1284 | 800 | 130 | 358 | 601 | 280 | 43 | 155 | 843 | 464 | 295 | 1493 (93 %) |
| Mg | 130 | 105 | 43 | 143 | 120 | 67 | 27 | 55 | 51 | 27 | 43 | 151 (126 %) |
| S | 164 | 100 | 38 | 178 | 149 | 66 | 26 | 71 | 104 | 18 | 47 | 167 (99 %) |
Internal translocation is estimated as the difference in pool size of vegetative compartments of reproductive and non-reproductive plants. Division of this figure by the nutrient pools of reproductive structures gives an estimate (in %) of the proportion ‘explained’ by internal translocation.
DISCUSSION
In the greenhouse, where plants were regularly fertilized and watered, mature W. sanguinolenta individuals reproduced each year for several years in a row. Under natural conditions, however, only a small percentage of individuals fruit in consecutive years (Zotz et al., 2005). Moreover, fruiting plants in situ experience decreased growth and fecundity in the following year and, in smaller individuals, increased mortality rates. The physiological basis of this cost of reproduction under field conditions was the subject of this study.
The construction of reproductive structures constitutes a major investment, representing more than 30 % of the total plant biomass (Table 3). However, in this study, TNC did not decrease in the vegetative compartments of reproducing plants (Fig. 2), which indicates that the carbon needed for the construction of fruit stalks and capsules was supplied entirely by current leaf photosynthesis and by the CO2 assimilation of reproductive structures themselves. Leaf photosynthetic capacity (PC) is commonly increased during reproduction to match increased demand (Wardlaw, 1990). It is not known whether this is the case in W. sanguinolenta, but comparable levels of leaf N in reproducing and non-reproducing individuals (Fig. 5) and the (commonly observed) tight correlation between PC and leaf N concentrations (Field and Mooney, 1986; Zotz et al., 2004) indicate otherwise. Although CO2 gas exchange of reproductive structures was not measured, both fruit stalks and bracts of individual flowers as well as young capsule walls were green, suggesting that they contributed to their own carbon maintenance. Autonomous CO2 fixation of reproductive structures can account for up to 60 % of their total carbon requirement (Chapin et al., 1990; Aschan and Pfanz, 2003). Taking this evidence together, it is unlikely that carbon limits reproduction under natural conditions in this epiphyte.
A substantial carbon surplus, as observed in W. sanguinolenta, seems to be common in plants under adverse environmental conditions (Körner, 2003). The magnitude of this stored carbon is indeed impressive when carbon pools are related to whole-plant photosynthesis. The study plants had a mean area of green foliage of 0·11 m2, and under optimal conditions the daily carbon gain of green foliage in plants of this size would be about 80 mmol CO2 m−2 d−1 (Zotz et al., 2002) or 0·11 g C d−1 plant−1. On the other hand, the average TNC content of 4·4 % dry mass (Fig. 2) or 16·6 g plant−1 corresponds to 6·6 g C plant−1. Thus, the mean TNC content of W. sanguinolenta measured here was equivalent to the net carbon gain of green foliage of about 60 d. Not playing any obvious role in reproduction, stored carbohydrates may be important for recovery after tissue loss (Chapin et al., 1990). Similarly, the re-initiation of growth after the dry season in other epiphyte species seems to depend upon stored carbon (Zotz, 1999). It seems unlikely, however, that the high TNC contents found in W. sanguinolenta would ever be needed even, for example, during an exceptional drought in an El Niño year.
The observed reduction in TNC contents in the dry season (Fig. 2) contrasts with observations on trees (Würth et al., 2005), where TNC is usually higher in the dry season than in the rainy season. Differences in water supply fully explain this discrepancy between growth forms. Although water shortage in the dry season affects meristem activity in both growth forms (Hsiao, 1973), trees can still take advantage of increased PFD due to their access to soil water (Zotz et al., 1995; Graham et al., 2003), whereas leaf gas exchange in epiphytes is strongly reduced or completely stopped (Zotz and Hietz, 2001).
In contrast to carbon, reproductive structures cannot be (partially) autonomous for nutrients. In these tank-forming bromeliads, nutrients are: (1) taken up via absorptive foliar scales rather than roots, which act primarily as holdfasts (Benzing, 2000); (2) stored temporarily in vegetative organs; and/or (3) directly allocated to reproductive structures. If the needs for reproductive structures exceed current uptake, it can be predicted that nutrient pools in vegetative compartments will be depleted during reproductive events (Chapin et al., 1990). The present observations supported this expectation, with stems being the most dynamic compartment (Figs 4, 5). On the other hand, comparison of the reductions in pool sizes of vegetative compartments with those in reproductive structures allows estimation of the amount of nutrients taken up from external sources (Table 4, Fig. 6). This estimate of external uptake per rainy season allows a more detailed evaluation of the question: which of the five macronutrients is most likely limiting reproduction in this epiphyte? Based purely on which element contributed the highest fraction of its total to reproduction, P was potentially most limiting (Table 3, Fig. 4; see also Benzing and Renfrow, 1971; Zotz, 1999). The high allocation of phosphorus to seeds resembles that of many Australian heath species where reserves support seedling growth for many weeks with little or no absorption from the environment (Chapin, 1980).
From the calculations shown in Table 4 and Fig. 6, the time necessary to take up the amounts of nitrogen and phosphorus needed for one reproductive event can be estimated. Assuming that uptake is negligible during the dry season, these estimates represent minima of annual nutrient uptake rates (ignoring, for example, compensation for losses due to leaching or normal leaf turnover). For P, the estimated 40 mg year−1 plant−1 (Fig. 6) equalled about 50 % of the P pool in reproductive structures. The expected period of 2 years to take up the P necessary for reproduction matches the most common interval between fruiting events observed in this species (Zotz et al., 2005), although since that these uptake rates are crude estimates, this may constitute a coincidence. Nutrient limitation can, strictly speaking, be demonstrated unambiguously only by ‘well-controlled, well-replicated nutrient addition experiments’ (Vitousek and Howarth, 1991), but the hypothesis that uptake of P limits reproduction in this species in the field lends itself to experimental testing.
The concept that P rather than N is most limiting for reproduction in vascular epiphytes was proposed by Benzing (1990), but P limitation of reproduction does not necessarily indicate that vegetative function is similarly limited by this element (Williams et al., 2004). There is, however, an increasing body of information that this is indeed the case (Zotz and Hietz, 2001). Indirect evidence is provided, for example, by higher resorption efficiencies and proficiencies (sensu Killingbeck, 1996) for phosphorus than for nitrogen during leaf senescence (Zotz, 2004) or by a sharp, tenfold, decrease in the N : P ratio of field-grown bromeliads when fertilized in the laboratory (Benzing and Renfrow, 1974).
In summary, the intermittent reproduction of mature individuals of the epiphytic bromeliad Werauhia sanguinolenta can not be explained by carbon or energy limitation. The observed changes in the concentrations and contents of the major nutrient elements studied (N, P, K, Mg and S) suggest, rather, that phosphorus uptake constitutes the major limitation to reproduction. This conclusion, which is currently based on correlative evidence, awaits a rigorous experimental examination.
Acknowledgments
The help of many fieldworkers (Veronique Chevillat, Stefan Laube, Steffen Schultz, Sibylle Sigrist) is acknowledged. Thanks also for excellent technical assistance by Frieda Reisberg (Würzburg) and Christina Kaiser (Wien). Financial support came from the Smithsonian Tropical Research Institute, the Freiwillige Akademische Gesellschaft, Basel, Switzerland, and the A.F.W. Schimperstiftung, Stuttgart, Germany.
LITERATURE CITED
- Ackerman JD. 1989. Limitations to sexual reproduction in Encyclia krugii (Orchidaceae). Systematic Botany 14: 101–109. [Google Scholar]
- Ackerman JD, Montalvo AM. 1990. Short- and long-term limitations to fruit production in a tropical orchid. Ecology 71: 263–272. [Google Scholar]
- Aschan G, Pfanz H. 2003. Non-foliar photosynthesis—a strategy of additional carbon acquisition. Flora 198: 81–97. [Google Scholar]
- Ashman TL. 1994. A dynamic perspective on the physiological cost of reproduction in plants. American Naturalist 144: 300–316. [Google Scholar]
- Benzing DH. 1990. Vascular epiphytes. General biology and related biota. Cambridge: Cambridge University Press.
- Benzing DH. 2000. Bromeliaceae—profile of an adaptive radiation. Cambridge: Cambridge University Press.
- Benzing DH, Davidson EA. 1979. Oligotrophic Tillandsia circinnata Schlecht. (Bromeliaceae): an assessment of its patterns of mineral allocation and reproduction. American Journal of Botany 66: 386–397. [Google Scholar]
- Benzing DH, Renfrow A. 1971. The biology of the atmospheric bromeliad Tillandsia circinnata Schlecht. I. The nutrient status of populations in South Florida. American Journal of Botany 58: 867–873. [Google Scholar]
- Benzing DH, Renfrow A. 1974. The mineral nutrition of Bromeliaceae. Botanical Gazette 135: 281–288. [Google Scholar]
- Bush SP, Beach JH. 1995. Breeding system of epiphytes in a tropical montane wet forest. Selbyana 16: 155–158. [Google Scholar]
- Cascante-Marin A, Oostermeijer JGB, Wolf JHD, den Nijs JCM. 2005. Reproductive biology of the epiphytic brorneliad Werauhia gladioliflora in a premontane tropical forest. Plant Biology 7: 203–209. [DOI] [PubMed] [Google Scholar]
- Chapin FS. 1980. The mineral nutrition of wild plants. Annual Review of Ecology and Systematics 11: 233–260. [Google Scholar]
- Chapin FS, Schulze ED, Mooney HA. 1990. The ecology and economics of storage in plants. Annual Review of Ecology and Systematics 21: 423–447. [Google Scholar]
- Crawley MJ. 1997. Plant ecology. Oxford: Blackwell Scientific Publications.
- Croat TB. 1978. Flora of Barro Colorado Island. Stanford: Stanford University Press.
- Fenner M. 1986. The allocation of minerals to seeds in Senecio vulgaris plants subjected to nutrient shortage. Journal of Ecology 74: 385–392. [Google Scholar]
- Field C, Mooney HA. 1986. The photosynthesis-nitrogen relationship in wild plants. In: Givnish TJ, ed. On the economy of plant form and function. Cambridge: Cambridge University Press, 25–55.
- Graham EA, Mulkey SS, Kitajima K, Phillips NG, Wright SJ. 2003. Cloud cover limits net CO2 uptake and growth of a rainforest tree during tropical rainy seasons. Proceedings of the National Academy of Sciences of the USA 100: 572–576. [DOI] [PMC free article] [PubMed] [Google Scholar]
- Grant JR. 1995. Bromelienstudien. Tropisch Subtropische Pflanzenwelt 91: 1–57. [Google Scholar]
- Holdridge LR, Grenke WC, Hatheway WH, Liang T, Tosi JA, Jr. 1971. Forest environments in tropical life zones: a pilot study. Oxford: Pergamon Press.
- Hsiao TC. 1973. Plant response to water stress. Annual Review of Plant Physiology 24: 519–570. [Google Scholar]
- Killingbeck KT. 1996. Nutrients in senesced leaves: keys to the search for potential resorption and resorption proficiency. Ecology 77: 1716–1727.
- Körner C. 2003. Carbon limitation in trees. Journal of Ecology 91: 4–17. [Google Scholar]
- Leigh Jr EG, Rand AS, Windsor DM. eds. 1982. The ecology of a tropical forest. Seasonal rhythms and long-term changes. Washington, DC: Smithsonian Institution Press.
- Martinelli G. 1994. Reproductive biology of Bromeliaceae in the Atlantic rain forest of southeastern Brasil. Ph.D. Thesis, University of St. Andrews, UK.
- Obeso JR. 2002. The costs of reproduction in plants. New Phytologist 155: 321–348. [DOI] [PubMed] [Google Scholar]
- Reekie EG, Bazzaz FA. 1987. Reproductive effort in plants. 2. Does carbon reflect the allocation of other resources? American Naturalist 129: 897–906. [Google Scholar]
- Reznick D. 1985. Cost of reproduction: an evaluation of the empirical evidence. Oikos 44: 257–267. [Google Scholar]
- Schmidt G, Zotz G. 2002. Inherently slow growth in two Caribbean epiphytic species: a demographic approach. Journal of Vegetation Science 13: 527–534. [Google Scholar]
- Sokal RR, Rohlf FJ. 1995. Biometry, 3rd edn. New York: Freeman and Co.
- Vitousek PM, Howarth RW. 1991. Nitrogen limitation on land and in the sea: how can it occur? Biogeochemistry 13: 87–115. [Google Scholar]
- Wardlaw IF. 1990. The control of carbon partitioning in plants. New Phytologist 116: 341–381. [DOI] [PubMed] [Google Scholar]
- Williams DR, Potts BM, Smethurst PJ. 2004. Phosphorus fertiliser can induce earlier vegetative phase change in Eucalyptus nitens. Australian Journal of Botany 52: 281–284. [Google Scholar]
- Windsor DM. 1990. Climate and moisture variability in a tropical forest: long-term records from Barro Colorado Island, Panamá. Washington, DC: Smithsonian Institution Press.
- Würth MKR, Peláez-Riedl S, Wright SJ, Körner C. 2005. Non-structural carbohydrate pools in a tropical forest. Oecologia 143: 11–24. [DOI] [PubMed] [Google Scholar]
- Zimmerman JK, Aide TM. 1989. Patterns of fruit production in a neotropical orchid: pollinator vs. resource limitation. American Journal of Botany 76: 67–73. [Google Scholar]
- Zotz G. 1998. Demography of the epiphytic orchid, Dimerandra emarginata. Journal of Tropical Ecology 14: 725–741. [Google Scholar]
- Zotz G. 1999. What are backshoots good for? Seasonal changes in mineral, carbohydrate, and water content of different organs of the epiphytic orchid, Dimerandra emarginata. Annals of Botany 84: 791–798. [Google Scholar]
- Zotz G. 2004. The resorption of phosphorus is greater than that of nitrogen in senescing leaves of vascular epiphytes from lowland Panama. Journal of Tropical Ecology 20: 693–696. [Google Scholar]
- Zotz G, Hietz P. 2001. The ecophysiology of vascular epiphytes: current knowledge, open questions. Journal of Experimental Botany 52: 2067–2078. [DOI] [PubMed] [Google Scholar]
- Zotz G, Königer M, Harris G, Winter K. 1995. High rates of photosynthesis in the tropical pioneer tree, Ficus insipida Willd. Flora 190: 265–272. [Google Scholar]
- Zotz G, Reichling P, Valladares F. 2002. A simulation study on the importance of size-related changes in leaf morphology and physiology for carbon gain of an epiphytic bromeliad. Annals of Botany 90: 437–443. [DOI] [PMC free article] [PubMed] [Google Scholar]
- Zotz G, Enslin A, Hartung W, Ziegler H. 2004. Physiological and anatomical changes during the early ontogeny of the heteroblastic bromeliad, Vriesea sanguinolenta, do not concur with the morphological change from atmospheric to tank form. Plant, Cell and Environment 27: 1341–1350. [Google Scholar]
- Zotz G, Laube S, Schmidt G. 2005. Long-term population dynamics of the epiphytic bromeliad, Werauhia sanguinolenta. Ecography 28: 806–814. [Google Scholar]