

Abstract
• Background and Aims Soil water deficit is a major abiotic stress with severe consequences for the development, productivity and quality of crops. However, it is considered a positive factor in grapevine management (Vitis vinifera), as it has been shown to increase grape quality. The effects of soil water deficit on organogenesis, morphogenesis and gas exchange in the shoot were investigated.
• Methods Shoot organogenesis was analysed by distinguishing between the various steps in the development of the main axis and branches. Several experiments were carried out in pots, placed in a greenhouse or outside, in southern France. Soil water deficits of various intensities were imposed during vegetative development of the shoots of two cultivars (‘Syrah’ and ‘Grenache N’).
• Key Results All developmental processes were inhibited by soil water deficit, in an intensity-dependent manner, and sensitivity to water stress was process-dependent. Quantitative relationships with soil water were established for all processes. No difference was observed between the two cultivars for any criterion. The number of leaves on branches was particularly sensitive to soil water deficit, which rapidly and strongly reduced the rate of leaf appearance on developing branches. This response was not related to carbon availability, photosynthetic activity or the soluble sugar content of young expanding leaves. The potential number of branches was not a limiting factor for shoot development.
• Conclusions The particularly high sensitivity to soil water deficit of leaf appearance on branches indicates that this process is a major determinant of the adaptation of plant leaf area to soil water deficit. The origin of this particular developmental response to soil water deficit is unclear, but it seems to be related to constitutive characteristics of branches rather than to competition for assimilates between axes differing in sink strength.
Keywords: Shoot, organogenesis, morphogenesis, branching, leaf area, stomatal conductance, photosynthesis, carbon availability, soil water deficit, Vitis vinifera L
INTRODUCTION
Soil water deficit is a major abiotic stress that dramatically affects the development and productivity of crops. Its effects can be extremely damaging because plant processes such as cell wall expansion and the control of stomatal aperture respond strongly to soil water deficit (Hsiao, 1973). At the whole-plant level, such responses are considered to be mechanisms of adaptation to drought because they allow the plant to manage the available soil water by varying its water flux density and evaporative surface (Sadras and Milroy, 1996).
Vineyard management practices take advantage of these plant responses (a) to optimize source/sink relationships, favouring fruit development, (b) to maximize the amount of incident solar radiation reaching leaves, giving high levels of photosynthetic activity in the leaves, and (c) to optimize fruit microclimate (temperature, radiation, humidity), with major consequences for fruit ripening and harvest quality (Smart et al., 1990). In most vineyards, the management of water deficit by soil preparation practices, scion and rootstock selection, or the presence of cover crops is used to manipulate shoot vigour and canopy characteristics. In cropping areas prone to frequent severe drought, where irrigation is required, water supplies can be managed according to the predicted changes in soil water status with time. These practices are called regulated deficit irrigation or partial root drying (Dry and Loveys, 1998; McCarthy et al., 2002; dos Santos et al., 2003).
There is a need to improve quantitative analyses of plant responses to soil water deficit in terms of organogenesis and morphogenesis, and of the consequences of these responses for canopy structure. Most previous studies of vine responses to soil water deficit have considered effects on vegetative development by assessing integrated variables, such as total length of branches or plant leaf numbers (Matthews et al., 1987; Hardie and Martin, 2000), total plant leaf area (Gomez-del-Campo et al., 2002; dos Santos et al., 2003) or final biomass of pruned wood (Stevens et al., 1995). Although these variables are useful for analysis of the overall plant response to soil water deficit, they cannot be used to model this response because the effects of soil water deficit cannot be attributed to different functions using these variables. Lebon et al. (2004) suggested a quantitative architectural approach in which vine branch development was resolved into elementary processes. In this approach, the plant is represented as a set of phytomers, organized into a main axis and several secondary and higher order axes, consisting of an internode, a set of foliar parts and an axillary bud. The development of plant architecture can be broken down into smaller elements based on four sets of variables: (1) the number of main axes; (2) the number of branches on the main axes; (3) the rate of phytomer production on axes; and (4) organ expansion. Each of these sets of variables can be affected by environmental conditions.
The objectives of the present study were to: (a) investigate the effects of soil water deficit on shoot architecture in the grapevine, focusing particularly on its components (axes and leaf numbers); (b) compare the relative sensitivities of the various shoot developmental processes to water stress, and to assess the effects on plant development; and (c) investigate whether the responses were controlled by assimilate supply. This analysis is based on a set of pot experiments carried out on two cultivars (‘Syrah’ and ‘Grenache N’) over several months, with various stabilized levels of soil water deficit. The cultivars used were chosen because they are known to differ in plant architecture and in responses to soil water deficits (Schultz, 2003).
MATERIALS AND METHODS
Experimental design and culture conditions
Four experiments were carried out on two cultivars (‘Syrah’, cl 174; ‘Grenache N’, cl 226) of grapevine (Vitis vinifera L.) from 2000 to 2004 at the AgroM – INRA Campus in Montpellier (France) (43°38′N, 3°53′E). Plants were grown in large pots (0·3 m diameter, 0·7 m high, with a volume of 0·050 m3 in expts 1–3) or small pots (0·18 m diameter, 0·15 m high, with a volume of 0·0038 m3; expt 4). Two experiments were conducted in a glasshouse (expts 1 and 4) and the other two were carried out outside (expts 2 and 3). Pots were filled with soil mixtures composed of clay, loam and sand, in the following proportions (by volume): 17 % clay, 36 % loam, 47 % sand in expt 1 (soil substrate 1); 16 % clay, 30 % loam, 54 % sand in expts 2–4 (soil substrate 2). The pots were irrigated daily with Hoagland N/5 nutrient solution in glasshouse experiments (expt 1 and 4) and treated once per month with 25 g of complex fertilizer (Osmocote 18-11-10 NPK, Scotts, France SAS) when the pots were placed outside (expts 2 and 3).
Large-pot experiments (expts 1–3)
Two- to four-year-old plants grafted on Fercal rootstocks were used. One plant per pot was planted in expts 1 (‘Grenache N’) and 2 (‘Syrah’). In expt 3, one plant of each cultivar was planted in each pot (giving two plants per pot). At the end of the growing season preceding the experiment, plants were pruned to two to three node spurs and placed in a cool room (4 °C). Budburst occurred, on average, 5–8 d after the plants were taken out of this room. At stage 12, five unfolded leaves (modified E.L. system; Coombe, 1995), plants were thinned to one (expts 2 and 3) or two shoots (expt 1) and tied to vertical stakes. Inflorescences were removed as soon as they became visible to avoid complex interactions between vegetative and reproductive organs. In expt 1, the soil was covered with a 0·01-m-deep layer of perlite to limit evaporation, whereas in experiments carried out outdoors, the surface of the pots was covered with polyethylene to prevent evaporation from the soil and the penetration of rainwater. In all cases, the sides of the pot were covered with reflective foil to reduce soil warming by incident radiation. Water was applied directly to the surface of the soil by means of a drip system in expt 1. Homogeneity of soil water content was improved in expts 2 and 3 by positioning the dripper on a geotextile stocking filled with sand (height 0·50 m, diameter 0·04 m) inserted vertically into the pot.
Small-pot experiment (expt 4)
Two-node dormant cuttings (‘Syrah’) were selected in winter and rooted in a perlite heat-bed (25 °C). They were transferred after 45 d, at stage 12 (five unfolded leaves), to pots, which were placed in a greenhouse. The pots were enclosed in polyethylene bags to prevent soil evaporation. Plants were well watered for 1 week and a ‘dry-down’ experiment was then initiated. Twenty-four plants, selected on the basis of uniformity of development were analysed, with eight replicates per treatment.
Microclimate, soil water status measurement and thermal time calculation
Air temperature (Ta) and relative humidity (RH) were measured with a capacitive thermohygrometer (HMP35A Vaisala; Oy, Helsinki, Finland) placed in a ventilated cylinder at a height of 1·5 m (expts 1 and 4) or in a standard naturally aspirated radiation shield at a height of 2·5 m (expts 2 and 3). Photosynthetic photon flux density (PPFD) was measured with a PPFD sensor (LI-190SB; LI-COR, Lincoln, NE, USA). Data were collected every 30 s, averaged over 1800 s and stored in a datalogger (CR10X; Campbell Scientific Ltd, Shepshed, Leicestershire, UK). Mean diurnal temperature ranged from 19·5 °C in expt 1 to 23·4 °C in expt 2. Photosynthetic photon flux density (PPFD) was the most variable climatic parameter, with cumulative diurnal values ranging from 2·5 (expt 1) to 54·78 mol m2 d−1 (expt 2). Mean daily cumulative PPFD in the greenhouse was about one-third (approx. 14 mol m−2 d−1) that recorded in experiments carried out outside (approx. 42 mol m−2 d−1). Daily mean vapour pressure deficit ranged from 0·8 (expt 1) to 1·7 kPa (expt 4).
In expt 2, leaf temperature (Tl) was measured for each treatment (three replicates), using a copper-constantan thermocouple (0·004 m diameter) pressed into the lower side of the leaf blade. Mean Tl was calculated for the entire 44-d period and was 23·2 for WS0 (no water stress), 23·6 for WS1 (the milder of the two water stress conditions) and 23·7 for WS2 (the most severe water stress conditions tested) whereas Ta over the same period was 23·5 °C. As the difference between Ta and Tl was <0·5 °C for all three treatments, Ta was used directly in the analysis. Thermal time was calculated by daily integration of air temperature (Ta) minus the base temperature of 10 °C common to both cultivars (Winkler et al., 1974; Lebon et al., 2004) and expressed in cumulative degree-days (°Cd).
In large-pot experiments, soil water status was estimated by measuring soil moisture content daily, using a time-domain reflectometry device (TDR Trase System I; Soil Moisture Equipment Corp., Santa Barbara, CA, USA). A pair of 0·60-m steel wave guides was inserted vertically into each pot. Vertical soil moisture distribution was estimated at regular intervals with a pair of 0·15-m steel wave guides inserted vertically from the surface of the soil. TDR calibration curves were plotted at the end of the drying-down experiments, by relating measurements with soil samples at two depths (0·15 and 0·55 m) for the two substrates. The regression parameters were estimated with TableCurve 2D (SYSTAT Software Inc., Richmond, CA, USA). The regression coefficients (r2) and coefficients of variation of error (CVe) values were 0·915 and 13·8 %, respectively, for substrate 1 and 0·879 and 7·0 %, respectively, for substrate 2.
In the small-pot experiment, soil water content was measured by weighing pots daily, between 0900 and 1100 h, and adjusting soil water content to the desired level by watering.
Water deficit treatments
Three water regimes were imposed: pots were well watered (WS0) or subjected to one of two drought stress treatments with increasing intensities WS1 (mild to medium) and WS2 (severe). Five or six replicates in expts 1–3 and eight replicates in expt 4 were used. For each experiment, the total plant-available water was calculated as the difference between soil water content at field capacity estimated at the beginning of the experiment and soil water content at 10 % of maximal stomatal conductance (Sinclair and Ludlow, 1986). The fraction of transpirable soil water (FTSW) remaining in the soil at a given date was calculated as the ratio of actual plant-available soil water content to the total plant-available soil water content. Changes in the remaining fraction of transpirable water against time were plotted for each experiment (Fig. 1). The consistency of stomatal conductance responses in large and small pots, and across a wide range of growth conditions, confirmed previous findings (Ray and Sinclair, 1998) and demonstrated the utility of fraction of transpirable soil water as a variable.
Fig. 1.
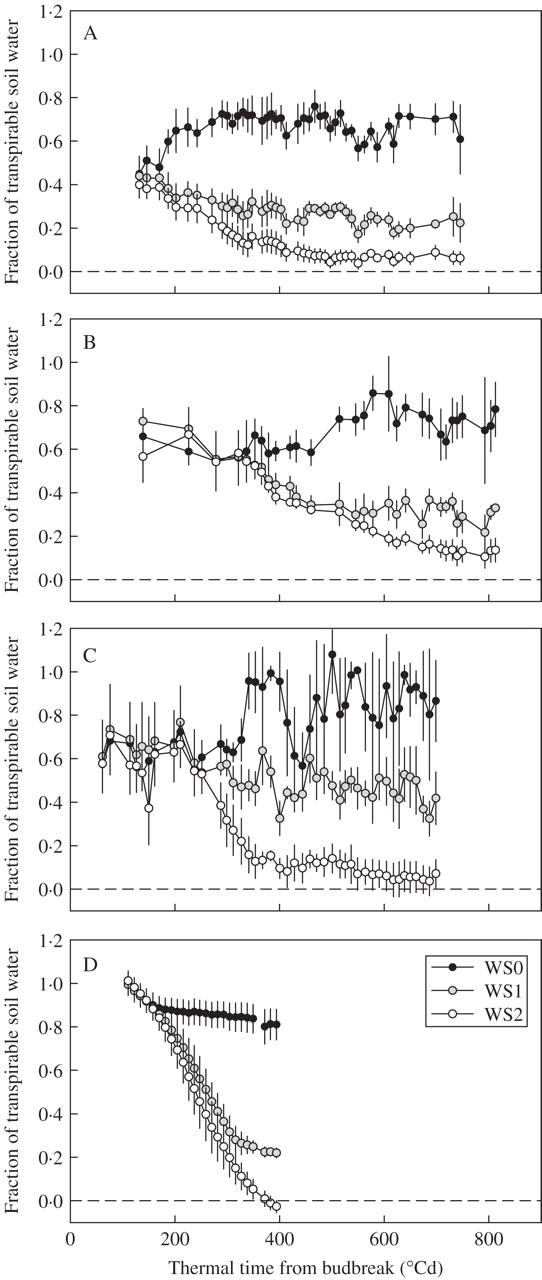
Time course of fraction of transpirable soil water (FTSW) (A) in experiment 1, (B) in expt 2, (C) in experiment 3 (cultivar ‘Grenache N’) and (D) in expt 4. Means of five to eight pots and confidence intervals at P = 0·05. Treatments (see Table 1): WS0, well-watered; WS1, mild to medium drought stress; WS2, severe drought stress.
Leaf conductance measurements
Leaf conductance was measured under saturating sunlight (PPFD > 800 μmol m−2 s−1) on one fully expanded leaf per plant (five to eight measurements per treatment) in the morning (0900–1130 h) in expts 2 and 3 and at the solar zenith (1300–1530 h) in expts 1 and 4. Leaf conductance was measured with an LCA3 open system gas analyser (ADC BioScientific Ltd, Hoddesdon, Herts, UK) equipped with a Parkinson leaf chamber (expts 1–3), and with an AP4 dynamic diffusion porometer (Delta-T Devices Ltd, Burwell, Cambridge, UK) (expt 4).
Plant measurements
Phytomer production on main stems and branches
The number of phytomers on main stems was recorded every 2–4 d. The rate of phytomer production was calculated over short periods (4–7 d), by linear regression analysis of the number of phytomers recorded against thermal time. Branch development was analysed at the overall shoot level, following a standard crop physiological approach (Moulia et al., 1999) adapted to the indeterminate development pattern and modular stem structure of the grapevine (Lebon et al., 2004). This structure was built up from three types of phytomer which produce branches differing in development potential. The first phytomer of the structure (P0) carried no tendril, whereas the second (P1) and the third (P2) phytomers carried tendrils in alternate positions. Branch development was described by a set of three variables: (1) the number of potential branching sites, determined by the rate of phytomer production on the main stem because each phytomer has an axillary bud that may develop into an axillary axis; (2) axillary bud development; (3) the mean rate of leaf appearance on axillary axes. These rates were calculated for phytomer positions 10–15 on the main stem in expt 1 and for positions 16–18 in expts 2 and 3. For each plant, the rates of development of the main stem and axillary axes are expressed as the ratio of the value obtained for that plant over the mean value for well-watered plants (WS0). These normalized rates of phytomer production are expressed as a function of mean daily fraction of transpirable water during the corresponding measurement period.
Leaf area measurements
The length of the lamina of all leaves on the main stem and branches was determined in expt 1. The corresponding leaf areas were estimated according to a quadratic relationship between laminar length and leaf area (Schultz, 1992). The parameters of this relationship were estimated from an independent set of fully expanded leaves. Laminar lengths and leaf areas were determined for each leaf by image analysis (Optimas V6.5; Media Cybernetics, Silver Spring, MD, USA). The quadratic relationships obtained were different for ‘Syrah’ (n = 248, LA = 0·0100L2 + 0·1620L, r2 = 0·956, CVe = 10·6 %) and ‘Grenache N’ (n = 233, LA = 0·0134L2 – 0·0762L, r2 = 0·971, CVe = 11·7 %). In expts 1–3, the final lengths of all laminas and internodes were measured on five or six shoots per treatment. Single leaf area responses to water stress were calculated according to the main stem development, on phytomers subjected to stabilized water stress during the period of leaf unfolding. Relative expansion rates were calculated by dividing the value obtained for each plant by the mean for well-watered plants. Expansion rates were estimated for leaves in positions 19–21 in expt 1, positions 22–44 in expt 2 and positions 16–18 in expt 3.
Branch leaf area was estimated in expts 2 and 3, by quadratic adjustment of leaf number and total branch leaf area. The relationships were different for ‘Syrah’ (n = 335, BLA = 0·9306LN2 + 56·632LN, r2 = 0·972, CVe = 24·6 %) and for ‘Grenache N’ (n = 387, BLA = 1·0314LN2 + 52·68LN, r2 = 0·979, CVe = 20·0 %).
Extraction and analysis of water-soluble carbohydrate
At the end of expt 1, young leaf laminas were harvested from main stems and P0 branches, and small discs (0·016 m diameter) from fully expanded leaves in positions 10–15 on the main stem just before dawn. These samples were taken from three plants for each treatment. Samples were immediately weighed, frozen in liquid nitrogen and stored at –80 °C. Each sample was placed in 200 μL of 80 % ethanol and heated at 90 °C for 15 min. This extraction process was repeated twice and the three extracts were pooled. Water-soluble carbohydrate concentration of extracts was determined by colorimetry, with detection at 490 nm after a reaction with acidic phenol solution (2 % phenol/26 % ethanol/N/5 H2SO4) (Dubois et al., 1956).
Statistical analysis
ANOVA/MANOVA procedure of Statistica 6.0 (Statsoft, Tulsa, OK, USA) was used to test for significant differences between means. Differences in non-linear adjustments between data sets were tested by comparing ΣSSi (sum of the residual sums of squares for individual fits to each data set) with SSc (residual sum of squares for the common fit to the whole data set) using the statistic:
 |
(1) |
which follows Fisher's law with (n − 1)k and (Ndata − k) degrees of freedom. Ndata is the total number of data points, n is the number of individual regressions and k is the number of fitted parameters for each regression. The adjustments were made using TableCurve 2D.
RESULTS
Treatments obtained
Management of water supply in the four experiments resulted in a broad range in soil water status, characterized by the fraction of transpirable soil water (FTSW) (Fig. 1). This value was maintained above 0·7 in well-watered treatments (WS0), whereas it ranged from 0·0 to 0·5 in water deficit treatments (WS1 and WS2). The thermal time at which water supplies were stopped varied, with irrigation continuing for 150–350 °Cd. Once irrigation was stopped, all water deficit treatments entered a transition period, lasting from 150 to 200 °Cd, during which transpirable soil water decreased gradually to the target water status. This transitory period lasted. After the target soil water status was reached, small amounts of water were applied to maintain the water status at a fairly constant value, except in expt 4, in which measurements were stopped before water status stabilized.
Daily variation in transpirable soil water content differed according to treatment and experiment, due to differences in environmental demand, affecting the amount of water lost by transpiration to be balanced by irrigation. The amount of transpired water per pot was highest in outdoor experiments with large leaf areas (Table 1) (WS0 treatment in expt 3), and the greatest daily variation in water status was observed for WS0 treatments. Nevertheless, the remaining fraction of plant-available water did not fall below 0·6 in these treatments.
Table 1.
Main architectural characteristics of the plants at the end of the various experiments
| Expt | Cultivar | Treatment | FTSW* (#) | Harvest time (°Cd) | Leaf no. on main stem | Leaf no. on branches | Main stem leaf area (m2) | Branch leaf area (m2) |
|---|---|---|---|---|---|---|---|---|
| 1 | ‘Grenache N’ | WS0 | 0·67 | 607 | 29·0a | 106·7a | 0·513a | 0·775a |
| WS1 | 0·24 | 25·8b | 42·5b | 0·355b | 0·206b | |||
| WS2 | 0·07 | 24·2b | 21·5c | 0·339b | 0·097b | |||
| 2 | ‘Syrah’ | WS0 | 0·74 | 803 | 40·0a | 174·6a | 0·496a | 1·146a |
| WS1 | 0·31 | 37·0b | 123·4b | 0·411b | 0·783b | |||
| WS2 | 0·18 | 30·8c | 60·6c | 0·279c | 0·388c | |||
| 3 | ‘Grenache N’ | WS0 | 0·89 | 799 | 37·8a | 279·8a | 0·603a | 1·519a |
| WS1 | 0·47 | 35·4a | 195·7b | 0·532b | 1·007b | |||
| WS2 | 0·09 | 23·3b | 59·4c | 0·238c | 0·307c | |||
| 3 | ‘Syrah’ | WS0 | 0·87 | 799 | 39·2a | 247·9a | 0·644a | 1·444ab |
| WS1 | 0·47 | 34·7b | 152·2b | 0·513b | 0·830b | |||
| WS2 | 0·05 | 21·8c | 47·8c | 0·219c | 0·276c |
Values followed by different letters are significantly different (P < 0·05).
*Mean fraction of transpirable soil water (FTSW) value calculated over the period in which it was stable.
Shoot architectural components at the end of experiments
The overall response of shoot architecture to soil water deficit by the end of each experiment is summarized for ‘Grenache N’ and ‘Syrah’ in Table 1. Experiment 1 ended at 600 °Cd (approx. stage 31, berries pea-size stage), whereas expts 2 and 3 ended at 800 °Cd (approx. stage 32, bunch-closure stage). Variability in shoot architectural components was largely accounted for by time of harvest and treatment effects. In the absence of water stress, the number of phytomers on the main stem depended only on the thermal time at which the plants were harvested. No differences in the number of phytomers were observed if comparisons were made at similar harvest thermal times (‘Syrah’ in expts 2 and 3). By contrast, the number of leaves on secondary axes differed considerably between WS0 treatments, even for similar harvest thermal times, ranging from 248 in expt 3 to 175 in expt 2 for ‘Syrah’. All shoot architectural components were reduced by water deficit treatments except the number of leaves on the main stem in expt 3 for ‘Grenache N’ This reduction was always greater in WS2 treatments than in WS1 and was inversely proportional to soil water availability. Leaf number on branches and branch leaf area were the most affected components (maximal reduction about 80 %). while the reduction in main stem leaf number was about 40 %. The reduction in main stem leaf area was intermediate (about 60 %).
The shoot leaf area response to water deficit stress was analysed in terms of modifications in axis development (number of unfolded leaves on the main stem and first order branches), branching and the mean area of individual leaves borne by each type of axis. The effects of water deficit on the components of shoot leaf area were investigated by carrying out a stepwise multiple regression on an 18-shoot data set from expt 1. The number of leaves produced by the first-order branches was found to account for most of the observed variation in shoot leaf area (62·7 %) (P < 0·001) (Table 2). Mean individual leaf area on the main stem and branches accounted for 12·4 % (P < 0·01) and 23·2 % (P < 0·001), respectively, of the variation in shoot leaf area.
Table 2.
Stepwise regression results for total shoot leaf area. r2 = 0·998, n = 18, F(3,14) = 1553·8, P < 0001
| Beta coefficients | Parameter value | Proportion variance explained | P-level | |
|---|---|---|---|---|
| y-intercept | −3440·09 | 0·000031 | ||
| Leaf number on branches | 0·646 | 66·31 | 0·627 | 0·000000 |
| Individual leaf area on branches | 0·239 | 66·94 | 0·232 | 0·000660 |
| Individual leaf area on main stem | 0·139 | 24·16 | 0·124 | 0·001199 |
Responses of organogenesis, morphogenesis and gas exchange to soil water deficit
Responses to soil water deficit under different treatments could not be compared directly by comparing numbers of axes or leaves and leaf areas at a given date, because the extent of soil drying differed between treatments. Therefore, a covariance analysis was carried out, using the fraction of transpirable soil water as an environmental covariable, to evaluate the relative sensitivities to soil water deficit of the two genotypes and of various processes, such as organogenesis, morphogenesis and gas exchange.
As axillary bud organogenesis follows the development of primary leaves on the main stem, the number of potential branching sites is determined primarily by development of the main stem. The rate of leaf appearance on the main stem, expressed with respect to control treatments and water status, remained steady until the fraction of transpirable soil water reached approx. 0·40 (Fig. 2A). The rate of leaf appearance on the main stem decreased rapidly once soil water status decreased below this value, except for the WS2 treatment of expt 1 (FTSW = 0·07), in which it decreased slightly later. This behaviour may result from the low demand for water observed in the greenhouse during this experiment, together with the frequent application of very small amounts of water to keep the plant alive. The data obtained under such conditions were excluded from subsequent analysis. Individual fits for each of the cultivars did not differ significantly (P = 0·05). A common logistic regression curve was fitted to data for both cultivars and all treatments (r2 = 0·832, CVe = 12·4 %):
 |
(2) |
Following the production of a new phytomer on the main stem, the fate of the axillary bud determines whether branching will occur. All axillary buds have the potential to produce a new secondary axis (Fig. 3), but there is a time lag between the appearance of an axillary bud on the main stem and the initiation of development of that bud to produce a new branch. This time lag was about four to five phyllochrons for ‘Syrah’ and five to six phyllochrons for ‘Grenache N’ (Fig. 3A, B). For a given cultivar, branching behaviour was the same for all treatments, indicating that soil water deficit did not affect the potential number of branches.
Fig. 2.
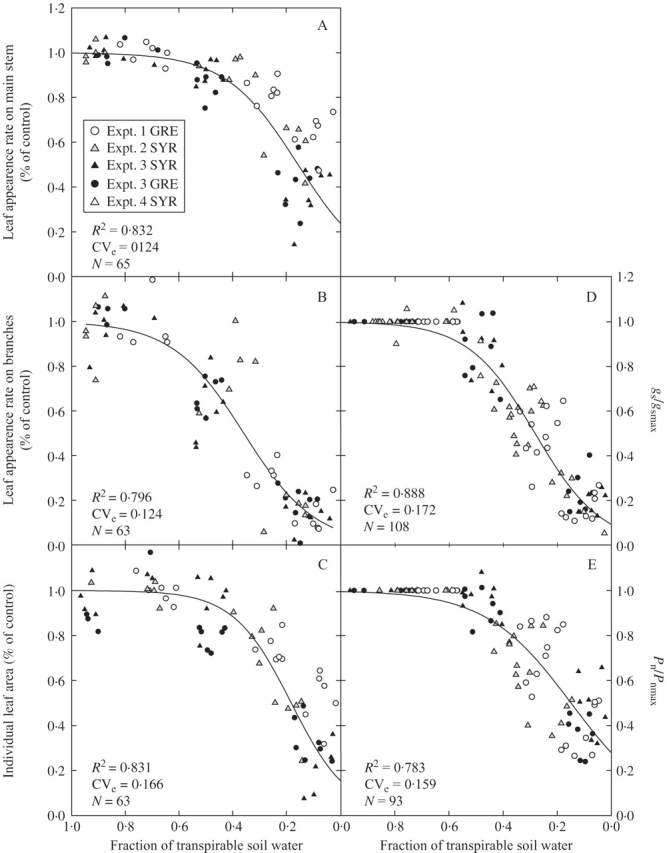
Relationships between fraction of transpirable soil water (FTSW) and leaf appearance rate on (A) main stem and (B) branches, (C) individual primary leaf area, (D) stomatal conductance and (E) net photosynthesis, all normalized to the mean value for plants in well-watered treatments.
Fig. 3.
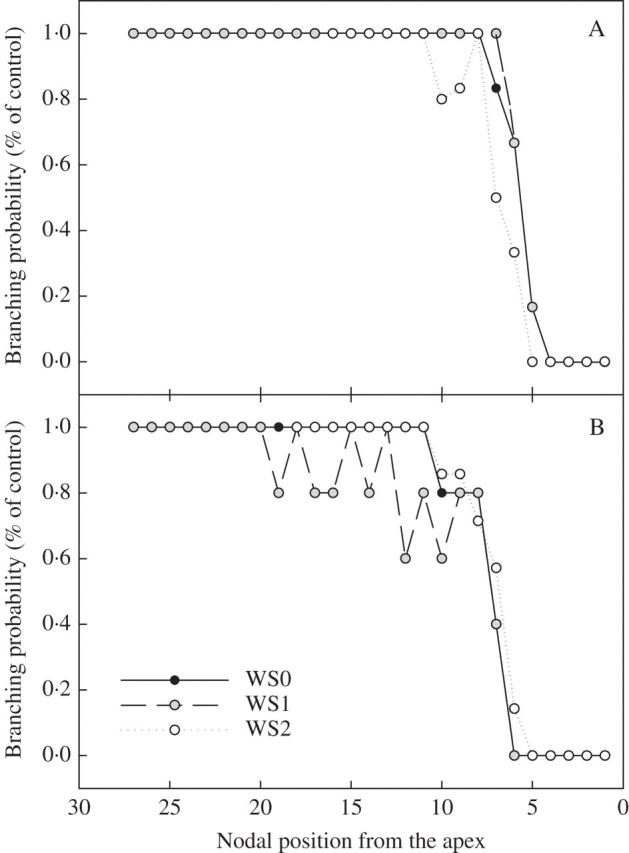
Distribution of branching development probability according to the position of the node with respect to the apex for three watering regimes (well-watered control WSO and the water deficit treatments WS1 and WS2; see Table 1) in expt 3 for cultivars ‘Syrah’ (A) and ‘Grenache N’ (B).
As axial budburst was not limited by soil water status, the effect of water deficit on the rate of leaf appearance can be analysed directly by comparing leaf production on branches for control and water-deficit treatments. However, before this analysis could be carried out, the behaviour of the different types of branch had to be compared to take into account the modular structure of the main stem. The decrease in rate of development from phytomers P1 and P2 (designated R1–R2) was first compared with the decrease in rate of development from phytomer P0 (R0), for expts 1–3 (Fig. 4). The relationship between the reduction in leaf appearance rate of R1–R2 and R0 branches of the same modular unit shows a very small deviation from a 1 : 1 relationship and calculated residuals displayed no particular pattern. The two types of branch (R1–R2 and R0) therefore had similar responses to soil water deficit, and these responses were similar for both cultivars. The response of branch development to soil water deficit was assessed by plotting the rate of leaf appearance on branches divided by that for the well-watered treatments against the remaining fraction of transpirable soil water for the water deficit treatments of experiments 1–3 (Fig. 2B). Leaf appearance on branches was closely related to water status (r2 = 0·796, CVe = 12·4 %), according to the following equation:
 |
(3) |
Leaf appearance rate on branches changed, in response to decreasing soil water status, in a similar fashion to leaf appearance rate on the main stem, but with a shorter plateau and an earlier, slower decrease.
Fig. 4.

Reduction in leaf appearance rates on R1–R2 branches versus R0 branches in expts 1–3. All decreases are normalized to the mean value for plants in well-watered treatments. The continuous line is the linear regression fitted to all data on the plot. Dashed lines represent a 1 : 1 relationship.
The final area of individual leaves was also affected by soil water deficit treatments. This response, as for responses involving organogenesis (e.g. leaf appearance rate) was strongly correlated with soil water status. A similar and consistent pattern was found for final leaf area expressed as a function of control treatment leaf area, and for leaf appearance rate on the main stem and branches (Fig. 2C). The individual fits for the two cultivars did not differ significantly (P = 0·05), and a common logistic curve was used (r2 = 0·787, CVe = 16·7 %):
 |
(4) |
The individual leaf area response to soil water deficit was statistically intermediate between that of leaf appearance rates on main stem and on branches, characterized by an initial plateau similar to that for leaf appearance rate on main stem, but a rapid decrease as soil water deficit intensified, similar to the response of leaf appearance rate on branches.
The characterization of the plant response to soil water deficit was completed by estimating decreases in stomatal conductance, expressed as a function of the control treatment (gs/gsmax), and decreases in net photosynthesis (Pn/Pnmax). The general pattern observed for both stomatal conductance and net photosynthesis was similar to that observed for organogenesis and morphogenesis (Fig. 2). Stomatal conductance remained maximal until the fraction of transpirable soil water reached 0·45 (Fig. 2D), whereas photosynthesis remained stable until the value fell to 0·35 (Fig. 2E). Below these threshold values, gs and Pn decreased linearly. At the point where transpirable soil water reached 0, both cultivars maintained significant levels of photosynthesis, at about 30 % of Pnmax. The individual fits for the two cultivars did not differ significantly (P = 0·05) and a common logistic regression curve was used for stomatal conductance (r2 = 0·888, CVe = 17·2 %):
 |
(5) |
and net photosynthesis (r2 = 0·782, CVe = 15·9 %):
 |
(6) |
but the similarity of the relationships between stomatal conductance and soil water status expressed as FTSW is not strictly sufficient to establish that the two genotypes do not react differently to water deficit. Genotypes could differ in the amount of water they were able to extract (Sinclair and Ludlow, 1986). However, in expt 3 in which each pot contained a plant of each cultivar, the level of soil water content calculated when gs/gmax reached 0·1 (defined as the lower limit of transpirable soil water content) was approximately the same (0·164 g g−1 and 0·172 g g−1 for ‘Grenache N’ and ‘Syrah’, respectively).
Comparison of the sensitivity to soil water deficit of various process
The sensitivities to soil water deficit of the various processes considered were compared by deriving response thresholds from the fitting of logistic curves, using an arbitrarily fixed value of 0·8 for reduction rates (e.g. ratio between plants subjected to water stress and well-watered plants) common to all variables. Using this approach, the estimated thresholds ranged from 0·32 to 0·57, respectively, for the rate of leaf appearance on branches and individual leaf area (Fig. 5). No significant difference was found between ‘Syrah’ and ‘Grenache N’, and the ranking of processes according to their sensitivity was similar for the two cultivars. When the soil dried out, the rate of appearance of new leaves on branches was the main parameter affected by water deficit. The threshold values for this process were significantly (P = 0·05) higher than those for all other processes, at 0·57 for ‘Syrah’ and 0·53 for ‘Grenache N’. Stomatal conductance displayed an intermediate pattern of behaviour, with threshold values of 0·45. The processes least affected by water deficit stress were the rate of leaf appearance on main stem, leaf expansion and net photosynthesis.
Fig. 5.

Estimated fraction of transpirable soil water (FTSW) value for a 20 % reduction of leaf appearance rate on main stem and branches, individual leaf area, stomatal conductance (gs) and net photosynthesis (Pn) for ‘Syrah’ (black bars) and ‘Grenache N’ (open bars). Vertical bars indicate confidence intervals at P = 0·05.
Sugar concentration in the growing zone
In expt 1 an investigation of whether assimilate supply was responsible for the changes in branch development observed under conditions of soil water deficit was done by determining the concentration of soluble sugars in the growing zone of the main stem and R0 branches. This concentration was determined by sampling the last unfolded leaf. The concentration of soluble sugars in mature leaves from the main stem was also determined. Statistical analysis showed that the soluble sugar content was not affected by soil water deficit (P = 0·05), whereas mature leaves had a lower soluble sugar concentration than young leaves (respectively, 19·04 μg mg−1 and 22·26 μg mg−1 fresh mass, P < 0·05).
DISCUSSION
The responses of grapevine shoot architecture and gas exchange to a broad range in soil water status, representative of the agronomic conditions usually encountered during the period of vegetative growth (from the start of May to mid-July) in vineyards located in the south of France, were investigated (Fig. 1). These soil water deficits were combined with a range of evaporative demands, by the manipulation of conditions in and out of the greenhouse, making it possible to isolate the specific developmental and physiological effects of soil water deficit.
Shoot architecture of grapevine results from the addition of phytomers on varying numbers of axes. According to the limiting-factor paradigm, the number of leaves per branch is the main variable involved in the adjustment of shoot leaf area to fluctuations in water availability (Table 1). The number of leaves is determined by three intermediate variables: (1) the potential number of axillary buds; (2) the probability of each of these axillary buds developing; and (3) the rate of leaf appearance on each secondary axis (Moulia et al., 1999). Analysis of the responses of these variables to soil water deficit showed large differences in sensitivity. The probability of an initiated axillary bud developing into a branch was found to be independent of soil water status (Fig. 3), and was therefore not involved in changes in shoot architecture in response to water stress. By contrast, the rate of axillary bud production, which depends on phytomer production on the main stem, and the rate of leaf appearance on branches were significantly reduced by soil water deficit. However, the relative importance of these two variables under conditions in which the soil was allowed to dry out depended on their sensitivity to soil water deficit. For instance, when transpirable soil water reached a value of 0·3, which is usually considered to correspond to the start of water deficit (Sinclair and Ludlow, 1986), the rate of production of new branches fell by 25 %, whereas the rate of leaf appearance on branches fell by 60 %. This decrease in the rate of leaf appearance on branches occurred well before any decrease in gas exchange (Fig. 5). Gomez-del-Campo et al. (2002) showed, from experiments with 3-year-old grapevine grown in pots, that the sensitivities of primary and secondary shoot development to soil water deficit were comparable. However, total leaf area (approx. 1·0 m2) and the contribution of secondary branch leaf area (approx. 40 % of total leaf area) in the control treatments were much smaller than in the present study (approx. 1·6–2·1 m2 for 70 % of total leaf area), suggesting a limitation in secondary axis development. This discrepancy makes comparisons between experiments difficult to resolve. The present study suggests that differences in axis sensitivity for organogenesis and organ expansion to soil water deficit represent an advantage in a fluctuating environment. For instance, this behaviour, with preferential investment in less-sensitive branches, may increase the probability of completing the plant growth cycle by favouring the development of a few axes rather than following the pattern of augmenting plant size by increasing the number of axes, which is typical of unstressed plants (Novoplansky, 2003). A major role for branching in the adjustment of plant leaf area in response to soil water deficit has been suggested for other woody species with an indeterminate development pattern. For instance, in peach (Prunus persicae) (Steinberg et al., 1990; Hipps et al., 1995) and eucalyptus (Eucalyptus globulus) (Osorio et al., 1998), the probability of branching and leaf appearance on axes are major variables in the adjustment of plant leaf area. In grapevine, plant leaf area is determined primarily by the rate of leaf appearance on branches, because the number of primary stems per plant is controlled by winter pruning. This practice generally involves the removal of 90 % of the primary buds, strongly increasing the vigour of the remaining buds. This particular aspect of grapevine management may account for the observed growth of all axillary buds, regardless of soil water status.
The present results show that the developmental response to soil water deficit depends on the type of axis. The hierarchy of primary and secondary axes under soil water deficit seems to be similar to that established where there is competition for assimilates (Lebon et al., 2004). However, the observed decrease in branch growth is (a) not dependent on the developmental stage of the axes (leaf number, biomass) which results in different sink strengths, and (b) the same for all types of axes (R0 or R1–R2) (Fig. 4). Furthermore, the rate of leaf appearance on branches decreases before any decrease is observed in photosynthetic activity or in the soluble sugar content of young expanding leaves. This early decrease in the area of leaves carried by branches does not seem to be determined by carbon availability. Such a lack of connection between axis ontogeny and carbon metabolism has been observed in other species with an indeterminate growth pattern (e.g. Ney and Turc, 1993; Turc and Lecoeur, 1997). Soluble sugar accumulation may even be observed if sink demand is reduced by a decrease in the growth rate of organs before any decrease in photosynthetic activity (Wardlaw, 1990; Tardieu et al., 1999).
Such early decreases in organ expansion may result from a hormonal signal originating from the root (Davies and Zhang, 1991; Sobeih et al., 2004), and ABA transport from the root to the shoot is thought to be particularly important in this respect. Grapevine plants grown in split-root systems, with part of the root system in drying conditions (Dry and Loveys, 1999) or in the field with limited water supplies (Dry and Loveys, 1998), display lower rates of branch development and lower levels of cytokinin (CK) in buds and meristematic zones than well-watered plants. The resulting changes in ABA/CK equilibrium may increase apical dominance in plants subjected to a soil water deficit (Stoll et al., 2000). However, no spatial pattern of decrease in the rate of leaf appearance on branches was identified here, with all branches appearing to show similar reductions (Fig. 4), but hydraulic control over the decrease in branch development cannot be ruled out, since hydraulic resistance to water flux may be higher in branches than in the main stem (Wilson, 2000). This assumption is consistent with experimental observations indicating that leaf-specific conductivity decreases with increasing branching order (Zimmermann, 1978; Cruiziat et al., 2002). As a result, when the soil starts to dry out, organ water status may decline earlier in branches than in the main stem, resulting in the rapid reduction of branch development.
Under the conditions of the present experiments, no difference was observed between cultivars for any criterion. This result seems to contradict a previous field study (Schultz, 2003), which highlighted differences in leaf area between cultivars in the absence of water deficit at the end of the growing season (7·54 m2 and 12·38 m2 per vine, respectively, for ‘Grenache N’ and ‘Syrah’) (compare with Table 1). A possible cause of this discrepancy could be the fact that ‘Rupestris’ × ‘Berlandieri’ rootstocks are known to induce significant differences in the vigour of the scion (Climaco et al., 2003). Experiments were conducted in pots on vines grafted on the same rootstock to avoid the effects of differences in soil volume exploration among root systems. No differences in stomatal behaviour of the cultivars were observed, in disagreement with the previous study, but it must be stressed that the range of soil water deficit observed in the present study was smaller than in Schultz's study. Furthermore, the decrease in sensitivity of this analysis, when the fraction of transpirable soil water was lower than 0·2, could have masked differences in stomatal conductance under more severe soil water deficit. Indeed, within this range of soil water status, a small variation in FTSW can induce high variation in pre-dawn leaf water potential (see Pellegrino et al., 2004). Differences in stomatal control between cultivars could result from differences in water supply (soil volume explored by the root system) or evaporative demand (exposed leaf area) mediated by hydraulic or chemical (ABA concentration) messages (Tardieu and Simonneau, 1998).
CONCLUSIONS
In grapevine, the production of leaves by branches is a major determinant of plant leaf area adaptation to soil water deficit. This response occurs very soon after the soil begins to dry out. It is not related to carbon availability, photosynthetic activity or the soluble sugar content of young expanding leaves. The origin of this particular response of branch development to soil water deficit remains unclear, but it seems to be related to a constitutive factor rather than trophic competition between axes of varying sink strength. The similarity of the responses observed in ‘Grenache N’ and ‘Syrah’ in the present study suggests a low phenotypic variability of the responses of architectural and gas exchange parameters.
Improved understanding of this response could inform the management of grapevines because the branches may compete with berries for assimilate during ripening. Moreover, the development of branches greatly increases foliage density, resulting in negative modification of the local microclimate of the grapes clusters: reducing incident solar radiation, increasing relative air humidity and decreasing air temperature. These indirect effects of branch development may have a major effect on berry ripening and harvest quality (Crippen and Morrison, 1986; Haselgrove et al., 2000; Spayd et al., 2002). The observed relationships between soil water status and shoot organogenesis, morphogenesis and gas exchanges, together with a soil water budget model (Lebon et al., 2003), could be used to analyse the impact of various changes in soil water status during the plant cycle on canopy structure and on ripening conditions.
Acknowledgments
We thank Leonardo Borsi and Marie Elsie Bouvret for their help in data collection in expt 3; Philippe Barrieu, Yvan Bouisson, Myriam Dauzat and Philippe Naudin for their technical assistance and also Sarah Wright for improving the English of this manuscript.
LITERATURE CITED
- Climaco P, Lopes C, Carneiro LC, Castro R. 2003. Effect of grapevine and rootstock varieties on vigour and yield. Ciencia e Tecnica Vitivinicola 18: 1–14. [Google Scholar]
- Coombe BG. 1995. Adoption of a system for identifying grapevine growth stages. Australian Journal of Grape and Wine Research 1: 100–110. [Google Scholar]
- Crippen DD, Morrison JC. 1986. The effect of sun exposure on the compositional development of Cabernet Sauvignon berries. American Journal of Viticulture and Enology 37: 235–242. [Google Scholar]
- Cruiziat P, Cochard H, Améglio T. 2002. Hydraulic architecture of trees: main concepts and results. Annals of Forest Sciences 59: 723–752. [Google Scholar]
- Davies WJ, Zhang J. 1991. Root signals and the regulation of growth and development of plants in drying soil. Annual Reviews of Plant Physiology and Plant Molecular Biology 42: 55–76. [Google Scholar]
- Dry P, Loveys BR. 1998. Factors influencing grapevine vigour and the potential for control with partial rootzone drying. Australian Journal of Grape and Wine Research 4: 140–148. [Google Scholar]
- Dry P, Loveys BR. 1999. Grapevine shoot growth and stomatal conductance are reduced when part of the root system is dried. Vitis 38: 151–156. [Google Scholar]
- Dubois M, Gilles KA, Hamilton JK, Rebus PA, Smith F. 1956. Colorimetric method for the determination of sugars and related substances. Analytical Chemistry 28: 350–356. [Google Scholar]
- Gomez-del-Campo M, Ruiz C, Lissarrague JR. 2002. Effect of water stress on leaf area development photosynthesis, and productivity in Chardonnay and Airén Grapevines. American Journal of Enology and Viticulture 53: 138–143. [Google Scholar]
- Hardie WJ, Martin SR. 2000. Shoot growth on de-fruited grapevines: a physiological indicator for irrigation scheduling. Australian Journal of Grapes and Wine Research 6: 52–58. [Google Scholar]
- Haselgrove L, Botting D, van Heeswijck R, Hoj PB, Dry PR, Ford C, et al. 2000. Canopy microclimate and berry composition: the effect of bunch exposure on the phenolic composition of Vitis vinifera L. cv. Shiraz grape berries. Australian Journal of Grapes and Wine Research 6: 141–149. [Google Scholar]
- Hipps NA, Pagès L, Huguet JG, Serra V. 1995. Influence of controlled water supply on shoot and root development of young peach trees. Tree Physiology 15: 95–103. [DOI] [PubMed] [Google Scholar]
- Hsiao TC. 1973. Plant responses to water stress. Annual Review of Plant Physiology 24: 519–570. [Google Scholar]
- Lebon E, Dumas V, Pieri P, Schultz HR. 2003. Modelling the seasonal dynamics of the soil water balance of vineyards. Functional Plant Biology 30: 699–710. [DOI] [PubMed] [Google Scholar]
- Lebon E, Pellegrino A, Tardieu F, Lecoeur J. 2004. Shoot development in grapevine (Vitis vinifera) is affected by the modular branching pattern of the stem and intra- and inter-shoot trophic competition. Annals of Botany 93: 263–274. [DOI] [PMC free article] [PubMed] [Google Scholar]
- McCarthy MG, Loveys B, Dry P, Stoll M. 2002. Regulated deficit irrigation and partial rootzone drying as irrigation management techniques for grapevines. In: Deficit irrigation practices. Water reports no. 22, FAO, Rome. 79–87.
- Matthews MA, Anderson MM, Schultz HR. 1987. Phenologic and growth responses to early and late season water deficits in Cabernet franc. Vitis 26: 147–160. [Google Scholar]
- Moulia B, Loup C, Chartier M, Allirand JM, Edelin C. 1999. Dynamics of architectural development of isolated plants of maize (Zea mays L.), in a non-limiting environment: the branching potential of modern maize. Annals of Botany 84: 645–656. [Google Scholar]
- Ney B, Turc O. 1993. A heat unit-based description of the reproductive development of pea. Crop Science 33: 510–514. [Google Scholar]
- Novoplansky A. 2003. Ecological implications of the determination of branch hierarchies. New Phytologist 160: 111–118. [DOI] [PubMed] [Google Scholar]
- Osorio J, Osorio ML, Chaves MM, Pereira JS. 1998. Water deficits are more important in delaying growth than in changing patterns of carbon allocation in Eucalyptus globulus. Tree Physiology 18: 363–373. [DOI] [PubMed] [Google Scholar]
- Pellegrino A, Lebon E, Voltz M, Wery J. 2004. Relationships between plant and soil water status in vine (Vitis vinifera L.). Plant and Soil 266: 129–142. [Google Scholar]
- Ray JD, Sinclair TR. 1998. The effect of pot size on growth and transpiration of maize and soybean during water deficit stress. Journal of Experimental Botany 49: 1381–1386. [Google Scholar]
- Sadras VO, Milroy SP. 1996. Soil-water thresholds for the responses of leaf expansion and gas exchanges: a review. Fields Crops Research 47: 253–266. [Google Scholar]
- dos Santos TP, Lopes CM, Rodriguez ML, Souza CR, Maroco JP, Pereira JR, et al. 2003. Partial root drying: effects on growth and fruit quality of field-grown grapevines (Vitis vinifera). Functional Plant Biology 30: 663–671. [DOI] [PubMed] [Google Scholar]
- Schultz HR. 1992. An empirical model for the simulation of the leaf area development of primary shoots for four grapevine (Vitis vinifera L.) canopy systems. Scientia Horticulturae 52: 179–200. [Google Scholar]
- Schultz HR. 2003. Differences in hydraulic architecture account for near-isohydric and anisohydric behaviour of two field-grown Vitis vinifera L. cultivars during drought. Plant, Cell and Environment 26: 1393–1405. [Google Scholar]
- Sinclair TR, Ludlow MM. 1986. Influence of soil water supply on the plant water balance of four tropical grain legumes. Australian Journal of Plant Physiology 13: 329–341. [Google Scholar]
- Smart RE, Dick JK, Gravett IM, Fisher BM. 1990. Canopy management to improve grape yield and wine quality: principles and practices. South African Journal of Enology and Viticulture 11: 1–17. [Google Scholar]
- Sobeih W, Dodd IC, Bacon MA, Grierson D, Davies WJ. 2004. Long-distance signals regulating stomatal conductance and leaf growth in tomato (Lycopersicon esculentum) plants subjected to partial root-zone drying. Journal of Experimental Botany 55: 2353–2363. [DOI] [PubMed] [Google Scholar]
- Spayd SE, Tarara JM, Mee DL, Ferguson JC. 2002. Separation of sunlight and temperature effects on the composition of Vitis vinifera cv. Merlot berries. American Journal of Enology and Viticulture 53: 171–182. [Google Scholar]
- Stevens RM, Harvey G, Aspinall D. 1995. Grapevine growth of shoots and fruit linearly correlate with water stress indices based on root-weight soil matric potential. Australian Journal of Grape and Wine Research 1: 58–66. [Google Scholar]
- Steinberg SL, Miller JC, McFarland Jr, McFarland MJ. 1990. Dry matter partitioning and vegetative growth of young peach trees under water stress. Australian Journal of Plant Physiology 17: 23–36. [Google Scholar]
- Stoll M, Loveys B, Dry P. 2000. Hormonal changes induced by partial rootzone drying of irrigated grapevine. Journal of Experimental Botany 51: 1627–1634. [DOI] [PubMed] [Google Scholar]
- Tardieu F, Simonneau T. 1998. Variability among species of stomatal control under fluctuating soil water status and evaporative demand: modelling isohydric and anisohydric behaviours. Journal of Experimental Botany 49: 419–432. [Google Scholar]
- Tardieu F, Granier C, Muller B. 1999. Modelling leaf expansion in a fluctuating environment: should we use equations describing carbon budget, tissue expansion or cell division? New Phytologist 143: 33–43. [Google Scholar]
- Turc O, Lecoeur J. 1997. Leaf primordium initiation and expanded leaf production are co-ordinated through similar response to air temperature in pea (Pisum sativum L.). Annals of Botany 80: 265–273. [Google Scholar]
- Wardlaw IF. 1990. The control of carbon partitioning in plants. New Phytologist 116: 341–381. [DOI] [PubMed] [Google Scholar]
- Wilson BF. 2000. Apical control of branch growth and angle in woody plants. American Journal of Botany 87: 601–607. [PubMed] [Google Scholar]
- Winkler AJ, Cook JA, Kliewer WM, Lider LA. 1974. General viticulture. Berkeley, CA: University of California Press.
- Zimmermann MH. 1978. Hydraulic architecture of some diffuse-porous trees. Canadian Journal of Botany 56: 2286–2295. [Google Scholar]