

Abstract
• Background and Aims New wall deposition usually accompanies plant growth. External osmotica inhibit both processes but wall precursors continue to be synthesized, and exocytosis follows. Consequently, the osmotica appear to act outside of the plasma membrane. Because this implies an action of turgor pressure (P) on the periplasm by unknown mechanisms, the following study was undertaken to determine whether P could act in a way that altered wall deposition and assembly in the periplasm while the cells grow.
• Methods Cells of Chara corallina were exposed to P slightly below normal by using a pressure probe while supplying inorganic carbon in light. After labelling, the walls were isolated and the amount of new wall was determined. Similar measurements were made after treatment with osmotica. Chlortetracycline-stimulated exocytosis was determined microscopically. Polysaccharide properties were determined by confocal microscopy and vapour pressure osmometry in an ‘artificial periplasm’ in isolated Chara cell walls, using labelled dextran as an anologue of hemicellulose, and polygalacturonate as pectin.
• Key Results Rapid growth and wall deposition occurred at normal P of 0.5 MPa but both processes decreased when P was lowered 0.1 MPa. Inorganic carbon uptake and exocytosis were unaffected. In the artificial periplasm, normal P caused high polysaccharide concentrations and rapid polysaccharide entry into the wall, and gel formation in the pectin. Lowering P decreased entry and gel formation.
• Conclusions This is the first indication that normal P of 0.5 MPa can concentrate periplasmic polysaccharides sufficiently to cause cross-linking and gel formation in pectins while simultaneously fostering the entry of large polysaccharides into small interstices in the existing wall. This P-action would thicken the primary wall and form a smooth transition between the new and old structure, suggesting a molecular mechanism of wall deposition and assembly while the wall extends.
Keywords: 13C, 14C, osmotica, polymers, chlortetracycline, exocytosis, plant growth
INTRODUCTION
Plant cells become larger when their cell walls extend irreversibly because of the hydrostatic pressure inside the cell (turgor pressure, P). As the walls yield, water enters osmotically from the outside. The yielding occurs because the primary wall contains matrix polymers whose interpolymeric bonds are under tension from P, and the tension causes the polymers to slip past each other as the bonds spontaneously break and reform (Cleland, 1971; Taiz et al., 1981; Taiz, 1984; Ray, 1992). The slippage would make the wall proportionately thinner if it were not for the deposition of new wall material. Some thinning or thickening sometimes is observed, typically as much as 2-fold (Taiz, 1984; Kutschera, 1990 and references therein; Bret-Harte et al., 1991), but plant cells enlarge much more, typically 10- to 100-fold. This indicates that most of the extended wall is new at maturity (Roberts, 1994), which is essential to prevent the wall from becoming too thin to resist the pressure.
The new wall forms as a composite of cellulose microfibrils embedded in a matrix of cross-linked polysaccharides (Carpita and Gibeaut, 1993). Special complexes on the plasma membrane synthesize the microfibrils as individual cellulose chains in close proximity, and the chains crystallize spontaneously to form inert microfibrils of great strength (Giddings et al., 1980; Kimura et al., 1999). At the same time, the matrix precursors are secreted essentially fully formed from Golgi-derived vesicles by exocytosis (Boffey and Northcote, 1975; Robinson et al., 1976; Perrin et al., 2001). The precursors gather in a periplasmic layer, and Kutschera (2001) reviews possible roles for this layer in cell enlargement. The precursors in the layer surround the microfibrils and create the cross-linked gel-like matrix. Because the embedded microfibrils are often oriented and restrict extension along the microfibril axis, the matrix yields to the action of P mostly in a direction perpendicular to the microfibril axis (Baskin, 2005). This generally leads to lengthening rather than widening of the cell. In the alga Chara corallina, the matrix contains water-filled interstices with cross-sectional dimensions of 4.6–4.8 nm (Shepherd and Goodwin, 1989; Proseus and Boyer, 2005). Inter-penetrating polysaccharides would enter the wall through these interstices. Detailed autoradiographic analyses indicate that the new wall forms a layer on the inner wall face but also penetrates the old wall (Northcote and Pickett-Heaps, 1966; Ray, 1967). In this situation, the new wall is deposited on and in an existing wall that is extending during the deposition, and the wall appears homogeneous in the electron microscope (Morrison et al., 1993).
The co-ordination between deposition and wall extension was explored with external osmotica to decrease P (Ordin, 1960; Baker and Ray, 1965; Cleland, 1967; Loescher and Nevins, 1973). Generally, the amount of new wall declined at low P, and it was often concluded that the rate of wall biosynthesis had decreased when extension decreased. However, it was later found that pea stem cells plasmolysed for 15–30 min and thus having no P were synthesizing new wall precursors as rapidly as normal cells (Robinson and Cummins, 1976). Somero (1992) and Northrop (2002) review P effects on metabolic activities and point out that P in the range found in plant cells are too small to alter metabolic rates. In general, there are no effects until P is above 5–100 MPa.
Nevertheless, no new wall was deposited in the plasmolysed cells used by Robinson and Cummins (1976). If the cells were deplasmolysed and P restored, the cells resumed wall deposition (Robinson and Cummins, 1976). Tobacco pollen tubes (Kroh and Knuimann, 1985) and Microasterias cells (Ueda and Yoshioka, 1976) showed similar behaviour, synthesizing new matrix material, packaging it into vesicles, and secreting it via exocytosis during periods of low P, but similarly not inserting it into the wall. This indicated that at low P, there was a block in wall deposition after the matrix precursors had been synthesized and perhaps after the secretion step. P appeared to act outside of the plasma membrane.
However, it was also possible that solute in the osmoticum had caused the inhibition because the solute would have been present throughout the wall. High quantities of solutes such as sugars and their analogues were reported to inhibit wall enzymes (Hughes and Street, 1974; Nagahashi et al., 1990) or alter wall physical properties (Zhu and Boyer, 1992). In a recent paper, polysaccharides were subjected to P without using osmotica, and their movement was explored in walls isolated from Chara corallina cells (Proseus and Boyer, 2005). All of the polysaccharides were concentrated in the periplasmic space previously bounded by the plasma membrane and the wall. Polysaccharides with molecular (Stokes) diameters larger than the interstices in the wall did not enter the wall spontaneously but, if P was high, some began to enter. This indicates that P might directly affect wall deposition in living cells. Therefore, the following study was undertaken to determine whether P alone could affect wall deposition in living cells and, if so, what the molecular mechanism might be.
MATERIALS AND METHODS
The experiments were made with Chara corallina (Klien ex. Willd., em. R.D.W.) maintained in laboratory cultures as previously described (Zhu and Boyer, 1992; Proseus et al., 1999). The cultures consisted of anaerobic sediment in which the rhizoids of Chara were anchored while the thallus extended into water above. The water was occasionally supplied with 1 mm chloride salts of Na, K, Mg and Ca, and the sediment and plants kept the cultures at pH 7–8. The plants grew in continuous photosynthetically active radiation (PAR) of 10–15 μmol m−2 s−1 from sunlight and fluorescent bulbs. The osmotic potential of the medium was about −0.01 MPa. Under these conditions, P balanced the osmotic potential (Ψs) of the cell solution to within 0.01 MPa (Zhu and Boyer, 1992), i.e. Ψs + P = −0.01 ± 0.01 MPa.
Single internode cells were excised from apical portions of the algal thallus, where the cells were elongating and thus possessed primary walls. One end of the cell was fastened in a gate in a trough containing the culture medium. The light intensity (10–15 μmol m−2 s−1), temperature (23 °C) and pH (8.0) were essentially the same as in the parent cultures. After excision, the cells grew at rates similar to those in the intact plants for many hours (Zhu and Boyer, 1992). The microcapillary tip of a pressure probe (Steudle and Zimmermann, 1974) was inserted into the immobilized end of the cell. The tip entered the vacuole, and cytosol could be seen streaming around the tip and would seal the tip if the opening was small (μm and sub-μm). By grinding the tip to an opening of about 75 μm, sealing was prevented although small amounts of cytosol might enter the tip. With the probe, P initially in the cell was measured by maintaining the cytoplasmic solution at the boundary of the cell wall. Decreasing P caused the cytoplasmic solution (vacuole plus small amounts of cytosol) to enter the microcapillary. Because this created a non-equilibrium condition, water immediately entered the cell. Withdrawing further small amounts of solution maintained P at the new low level until enough water entered the cell to dilute the solution remaining in the cell. This required about 10 min after which the cell was ‘permanently’ at the new low P and it was not necessary to manipulate the pressure probe further. It should be noted that the cytoplasmic solution in the microcapillary remained in contact with the cell. It could be returned to the cell by reversing the process, thus returning P to the original level. This method of measuring, altering and controlling P was described in detail for the living cells by Zhu and Boyer (1992) and Proseus et al. (1999, 2000). Elongation was monitored with a position transducer attached to the other free end of the same cell, as described in Proseus et al. (1999, 2000).
For isolated walls, the cytoplasm was removed by cutting off one nodal end in culture medium and gently stroking the wall with a soft, plastic-tipped spatula until all green colour was removed. Because the chloroplasts occupied a stiff cytoplasmic layer adherent to the plasma membrane, a lack of green colour indicated when the cytoplasm had been completely removed. After the open end had been glued to the microcapillary while the wall remained in the culture medium, mineral oil could be injected into the lumen previously occupied by the cytoplasm. After enough oil had entered to develop P, the oil/water meniscus came to rest at the position previously occupied by the plasma membrane. The oil did not enter the wall. Injecting or removing oil changed P. This method of altering and controlling P was described in detail by Proseus and Boyer (2005).
13C labelling
After the glass microcapillary was inserted into the immobilized end of a cell and the other, free end of the cell was attached to the position transducer, a stable elongation rate and stable P were established. P was either maintained at the original value or, for low P treatments, the pressure probe was used to rapidly decrease P by 0.10 MPa. The culture medium was then immediately replaced with filtered culture medium (to 0.2 μm) supplemented with 5 mm NaH13CO3 (Aldrich Chemical Co., Milwaukee, WI, USA) at pH 8. A lid was placed over the trough and partially sealed with petroleum jelly. The cells were incubated on the pressure probe in the 13C medium in light under culture conditions for various times. At the end of the incubation, each cell was removed from the probe and trough, the nodal ends were removed, and the cytoplasm was gently scraped out as described above. Each wall was measured for length, rinsed in water several times, blotted, placed in a tin foil cup, and dried for 15 min at 80 °C. Walls from four identically treated cells were pooled together in a single cup, and the cup was sent for combustion analysis of the δ13C ratio in a mass spectrometer (δ13C ratio = 1000 × (Rsample − Rstandard)/(Rstandard), where R = 13C/12C and the standard is Pee Dee Belemnite).
14C labelling
In a separate experiment, whole cells were incubated for various times in NaH14CO3-containing culture medium using mannitol as an osmoticum to decrease P. For each trial, growing internode cells were harvested simultaneously from a single culture and allowed to acclimate for 30–40 min in a dish of the culture medium. Half of the cells were placed into an acrylic trough containing filtered culture medium with 6 μCi of NaH14CO3 (Sigma-Aldrich, St Louis, MO, USA) and adjusted to pH 8 at 23 °C. The remaining cells were placed into an identical trough containing the 14C medium supplemented with 60 mm mannitol to decrease P by 0.15 MPa. A clear acrylic lid was elevated 0.5 mm above each trough to permit gas exchange while minimizing evaporation. The cells were supplied with PAR of 300 μmol m−2 s−1 during the incubation to maximize assimilation. The incubation medium was stirred by pipette every 15 min. Whole cells were removed from each trough at various times, blotted on absorbent paper, rinsed three times in water (with or without 60 mm mannitol), blotted after each rinse, measured for length, transferred individually to a scintillation vial containing 0.4 mL of 15 % sodium hypochlorite, and incubated at room temperature overnight. Ten millilitres of HionicFluor scintillation fluid (Packard, Meriden, CT, USA) was added to each vial and allowed to stand for 1 h, then counted by liquid scintillation to give the total 14C uptake by the whole cells. In other cells of the same group, the deposition in the walls was measured by excising the ends of the cells and releasing the cytoplasm by gentle, lengthwise scraping under water with a blunt plastic blade as above. The radioactivity in the isolated walls was counted in a scintillation vial in the same way as for the whole cells.
Chlortetracycline treatments
To determine whether P affected exocytosis, growing Chara cells were exposed to 0.25 mm chlortetracycline (CTC) at pH 7.5 and allowed to produce callose deposits via exocytosis at the inner wall face for 30 min, as described by Foissner (1991). The cells were mounted on the pressure probe to allow simultaneous measurement of P, elongation and cytoplasmic streaming while the deposits were forming. The number of deposits was counted under a fluorescence microscope with UV excitation at 310–330 μm.
Pressurizing dextran in the periplasm
The fate of polysaccharides in contact with isolated walls was monitored by supplying 6 mg of dextran [poly-α-(1,6)-glucan with occasional α-1,3- and α-1,4-links, polymer about 5 % α-1,3-branched] per gram of water to the wall lumen at various P. The dextran had been labelled with fluorescein isothiocyanate (FITC-dextran; Sigma). To generate P, the FITC-dextran was pushed into the lumen by mineral oil. The method of pre-loading the microcapillary with dextran, glueing the isolated wall onto the microcapillary, and injecting solutions was described in detail by Proseus and Boyer (2005). Briefly, the solution entered the lumen of the isolated wall and was compressed between the inner wall face and the pressurized oil behind the solution. The pressurized oil forced water out of the solution into the culture medium outside of the wall, forming a concentrate in a layer lining the inner face of the wall. The interface between the oil and concentrate was at the position of the plasma membrane in the living cell (the forces were the same for the oil/concentrate and plasma membrane/periplasm interfaces), creating an ‘artificial P’ bearing on an ‘artificial periplasm’ in the isolated wall.
The fate of the pressurized FITC-dextran concentrate was monitored with a Zeiss LSM510 laser scanning confocal microscope (Carl Zeiss, Thornwood, NY, USA) with excitation at 488 nm and emission at 505–530 nm controlled with a bandpass filter. The isolated walls were stained with 0.1 % aqueous Congo Red solution (Sigma) for 30 min prior to mounting on the microcapillary of the pressure probe. Congo Red was simultaneously imaged with excitation at 543 nm and emission at 560 nm with a longpass filter. Dual channel time-series images of the injection, pressurization and movement of fluorescent FITC and FITC-dextrans were made, as in Proseus and Boyer (2005).
Physical properties of pectin and dextran
Pectin and hemicellulose constitute the main solution constituents of the periplasm destined for the wall matrix (Morrison et al., 1993). Their general physical properties and osmotic potentials were determined separately at the concentrations likely to be present in the periplasm. For pectin, the potassium salt of polygalacturonate was used [PGA, poly-α-(1–4)-d-galacturonate, 80 % potassium salt; Sigma]. Obtained from citrus albedo, the PGA had a molecular weight of 170 kDa (about 945 sugar and uronic acid residues) measured by size exclusion chromatography at the Complex Carbohydrate Research Center, Athens, GA, USA. As a hemicellulose analogue, dextran was used [poly-α-(1,6)-glucan with occasional α-1,3- and α-1,4-links, polymer about 5 % α-1,3-branched; Sigma]. The dextran had a molecular weight of 40 kDa (about 220 glucose residues).
The PGA solution was made at 70 mg g−1 water, and the water was evaporated at room temperature to achieve higher concentrations. Lower concentrations were made directly. The pH of the solutions was adjusted with KOH or HCl to 7.0 or 4.0. The dextran was dissolved in water at each concentration.
Samples of about 5 μL were obtained from the various concentrations and placed on a thermocouple of an isopiestic thermocouple psychrometer (Isopiestics Co., Lewes, DE, USA). When a gel was formed, a similar volume was removed and placed on the thermocouple so that it enclosed the temperature-sensitive junction, and measurements were continued as with solution samples. The osmotic potential of the samples was measured by the isopiestic method according to Boyer (1995). This method balanced the potential of the sample with the potential of sucrose standards that identified vapour equilibrium without concentrating or diluting the sample significantly.
RESULTS
Test of methods
Deposition can be determined in isolated walls only if the walls are sufficiently clean to release molecules that were not deposited or bound to the wall in the intact cells. To test for this requirement, FITC was supplied to the lumen of some of the walls isolated in this study. The freedom of FITC movement was monitored to and through the wall. The FITC had a molecular weight of 389 and diameter of 0.8 nm (Ekani-Nkodo and Fygenson, 2003), which was small enough to move freely through the 4.6–4.8 nm interstices in the wall matrix. Figure 1A shows that FITC (6 mg g−1 water) did not bind to the wall when supplied to the lumen of an isolated wall and followed by mineral oil pressurized at 0.5 MPa for 15 s. The FITC moved into and through the wall rapidly and uniformly. Its fluorescence obscured the wall, as expected if the FITC was in the wall matrix. After 3 min, most of the FITC had moved outside, and the wall became clearly visible (Fig. 1B). In expanded view, the wall showed no evidence of cytoplasmic detritus (Fig. 1C, D). Additional images of these preparations were reported in Proseus and Boyer (2005), where the isolated walls were used in a detailed study of molecular movement to and through the walls. Because there was no evidence of restricted movement, non-uniform distribution or leaks in any of the preparations, identically isolated walls were used in all of the following deposition experiments.
Fig. 1.

Small molecule movement through isolated cell walls of Chara. (A) FITC solution (green) has been pushed into isolated wall by mineral oil (black in lumen) and pressurized at 0.5 MPa for about 15 s. Some FITC is inside but is moving through the red-stained wall to unstirred culture medium outside. Scale bar = 0.5 mm. (B) Same wall after 3 min. Most FITC is outside. Red wall is now clearly visible. (C) Enlarged view of boxed area in (A). Note uniform passage of FITC through wall and absence of cytoplasmic organelles. (D) Enlarged view of box in (B). Detail of inner wall face is visible. Walls were stained with Congo Red.
If the living cells were exposed to 13C-labelled bicarbonate in the external culture medium and the walls were subsequently isolated as above, large amounts of label were detected in the walls (Fig. 2). The deposition began slowly, probably because time was necessary to label pools of wall intermediates. By 6 h, however, the rate had accelerated and became steady for as long as the experiment continued (24 h), which indicates that label in the intermediate pools had reached a steady level. Because it was unnecessary to wait for steady conditions, labelling times were generally shorter than 6 h in the following work. The mass spectrometer had a detection limit below 0.1 for the δ13C ratio and readily detected deposition from the earliest times.
Fig. 2.

13C deposition in cell walls of intact, growing internode cells of Chara having normal P of about 0.5 MPa. 13C was supplied as NaH13CO3 to the culture medium in the light. Data points are pooled samples each containing four cell walls isolated at times shown.
Effect of P on wall deposition
13C-labelled bicarbonate was supplied to living cells mounted on the pressure probe, and P was held constant (control) or changed (treatment) while the elongation rate of each cell was monitored. If P was held constant, wall deposition of labelled carbon was detected at 1 h and subsequently accelerated (Fig. 3, Normal P). If P decreased 0.1 MPa below normal P, deposition was less than at normal P and it was apparent from the earliest measurement (Fig. 3, Low P). By the end of the experiment, deposition at low P gave a δ13C ratio of about 450–600 while at normal P it was 850–1075 (Fig. 3). In mature cells, the δ13C ratio remained unchanged, indicating no wall deposition was occurring (Fig. 3, Mature, Normal P).
Fig. 3.

Wall deposition in growing cells at normal P (closed squares, about 0.5 MPa) and low P (open squares, 0.10 MPa below normal P). Wall deposition for mature cells is also shown. Points labelled α, β, γ, δ and ε have details for elongation and P shown in Fig. 4α–ε. Zero time indicates the start of the low P and 13C exposure, as shown in Fig. 4. P was controlled by removing/restoring cell solution with a pressure probe. Each point represents four walls isolated, pooled and analysed as a single sample, with replicate samples shown.
Figure 4 gives the P and elongation of the cells in Fig. 3. For the control cells of Fig. 3, elongation was rapid (Fig. 4α, β and γ, lower graphs) when P was normal (Fig. 4α, β and γ, upper graphs). P was constant except for the small amount of decrease occurring when 13C-labelled bicarbonate was supplied to the cells (Fig. 4β and γ, upper graphs). For the treated cells in Fig. 3, elongation was immediately inhibited (Fig. 4δ and ε, lower graphs) when P was lowered 0.1 MPa (Fig. 4δ and ε, upper graphs). For the mature cells in Fig. 3, no elongation occurred (data not shown).
Fig. 4.

Details of P and change in length (ΔL) of cells contributing to data points α–ε in Fig. 3. (α) ΔL and P measured simultaneously in the same cell at the start of the treatment. 13C was supplied at the arrow, immediately after which the cell was harvested and the wall was isolated for analysis. (β) Same as (α) but exposed to 13C for 2 h before harvest. P decreased slightly at the arrow because of the osmotic effect of added 5 mm H13CO3. (γ) Same as (β) but exposed to 13C for 3 h. (Δ) Same as (β) but P was decreased 0.10 MPa with the pressure probe when 13C was added at the arrow. Note decreased dL/dt after P was stepped down. (ε) Same as (γ) except P was decreased 0.10 MPa with the pressure probe when 13C was added at the arrow. Each graph shows performance of one of the cells contributing to the pooled samples in Fig. 3. Similar results were obtained for the other three cells contributing to each pool.
It should be emphasized that P, elongation and wall deposition were measured simultaneously in all of the cells in Figs 3 and 4. These are reported in separate figures only for clarity. All the cells at normal P were mounted on the pressure probe and were treated identically to the cells at low P. The cells differed only in P inside the cells. No osmoticum was used. Supplying label continuously after the arrow in Fig. 4 ensured that wall deposition shown in Fig. 3 reflected the difference in P alone, which also affected elongation.
Effect of P on bicarbonate uptake
It was necessary to test whether the differences in wall deposition in Fig. 3 were caused by differences in uptake of labelled carbon by the whole cells. Cells could not be removed from the pressure probe intact. Therefore, label was supplied as [14C]bicarbonate to cells without mounting on the pressure probe. P was varied with mannitol. With P decreased by 0.15 MPa with mannitol, uptake began immediately and was at least as rapid in the presence of mannitol as in its absence (Fig. 5A). At 4 h, the intact cells at normal P had a mean activity of 24 500 dpm mm−1 while the intact mannitol-treated cells had a mean activity of 26 600 dpm mm−1.
Fig. 5.
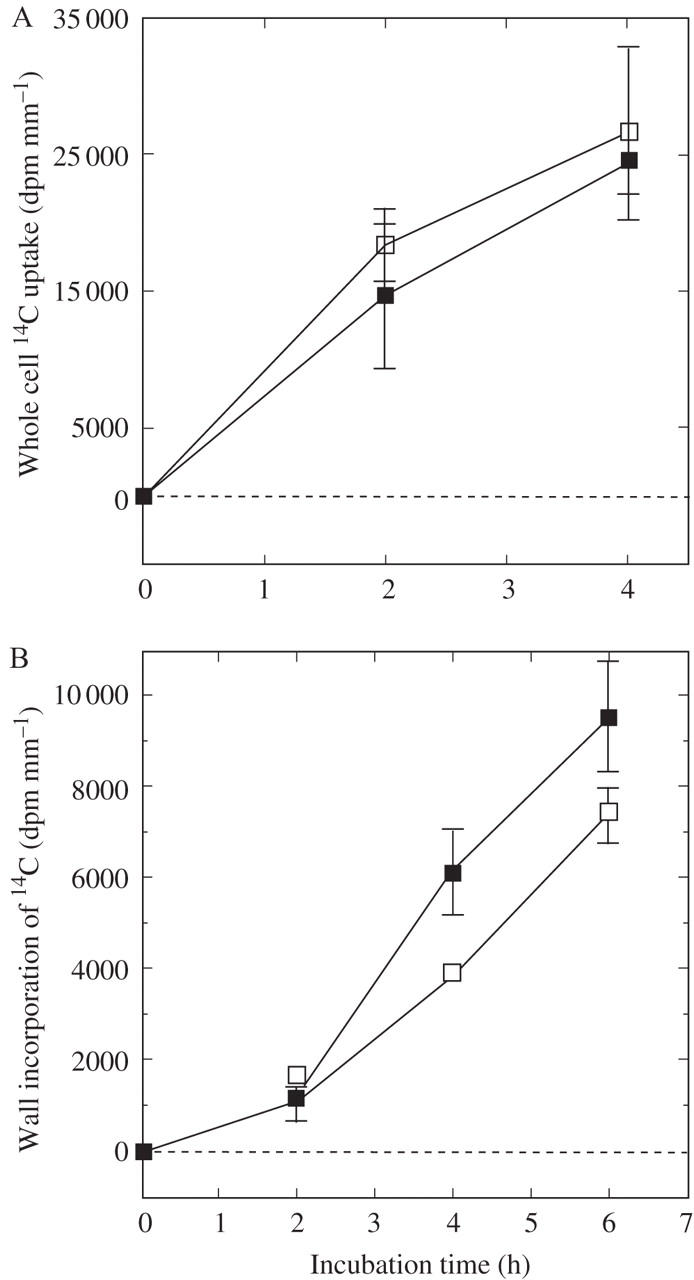
Effect of osmoticum on 14C uptake by whole cells (A) and 14C deposition in the cell walls (B) of Chara internodes. Cells were at normal P (closed squares) or were exposed to –0.15 MPa mannitol (open squares) during the uptake period. 14C was supplied as NaH14CO3 to intact cells in the light in culture medium throughout the times shown. Each point shows the mean and standard error of 8 or 12 cells.
Part of this label found its way into the walls (Fig. 5B). After a slow deposition at 2 h, the rate accelerated somewhat at 4 h and 6 h. No difference in deposition could be seen at 2 h but was obvious at 4 h and 6 h where mannitol was inhibitory. By 6 h, 14C deposition in the walls was 9538 dpm mm−1 at normal P but only 7380 dpm mm−1 in the mannitol-treated cells.
Effect of P on exocytosis
Although the movement of inorganic carbon into the cell was unaffected by P, it seemed possible that the movement of wall precursors out of the cytoplasm to the wall might occur at a rate dependent on P. Foissner (1991) reported that Chara internode cells synthesize and secrete callose-rich wall deposits by exocytosis to the inner wall face when exposed to the calcium ionophore CTC. The callose precursors were synthesized in Golgi bodies maturing into vesicles that docked with the plasma membrane and released their contents, resembling the normal synthesis and delivery of matrix polysaccharides to the cell wall.
To test whether the exocytosis responded to P, growing cells were exposed to CTC for 30 min at high or low P. No deposits were seen in controls growing rapidly at high P (Fig. 6A, D). When CTC was present, deposits became apparent (Fig. 6B). With the CTC, there was rapid initial elongation that diminished after 50 min, probably because P decreased slightly below normal P at that time (Fig. 6E). With mannitol (Fig. 6C), P and elongation were markedly inhibited but callose deposits continued to be seen (Fig. 6F). Table 1 indicates that similar numbers of deposits formed at normal P (mean = 2.31 deposits mm−1, s.e. = 0.25) and at low P (mean = 2.12 deposits mm−1, s.e. = 0.27). Tests with transmitted light indicated that cells exposed to CTC maintained normal cytoplasmic streaming.
Fig. 6.

Effect of low P on chlortetracycline (CTC)-induced exocytosis in Chara internodes. (A) Autofluorescence and (D) P and change in length (ΔL) in a control cell with no CTC. Red autofluorescence is visible from the chloroplasts but no callose is present. (B) Autofluorescing callose deposits (yellow) are visible in a cell exposed to 0.25 mm CTC for 30 min and (E) P and elongation in an identically treated cell exposed to CTC at the arrow. Callose is being deposited in clumps at the inner face of the wall. Elongation rates are shown alongside the length trace. (C) Autofluorescing callose in cell exposed to 0.25 mm CTC plus 0.16 m (−0.4 MPa) mannitol for 30 min and (F) P and elongation in an identically treated cell exposed to CTC and low P at the arrow. Callose is being deposited at the inner face of the wall. Scale bar = 100 μm. See Table 1 for replicates.
Table 1.
P, elongation, number of CTC-induced callose deposits released by exocytosis to the inner wall face, and cytoplasmic streaming in Chara internode cells
| Treatment | P (MPa) | Elongation rate (μm s−1) | Deposits (per cell) | Deposits (per mm) | Cytoplasmic streaming |
|---|---|---|---|---|---|
| Control | 0.519 (0.042, 5) | 0.0177 (0.0019, 18) | 0 | 0 | Yes |
| 0.25 mm CTC | 0.493 (0.032, 5) | 0.0102 (0.0016, 18) | 34.7 (4.43, 18) | 2.31 (0.25, 18) | Yes |
| 0.25 mm CTC + 0.16 m mannitol | 0.126 (0.031, 5) | 0 (0, 5) | 32.7 (4.02, 18) | 2.12 (0.27, 18) | Yes |
Data are means (± s.e., n) for each treatment, which lasted 30 min. See Fig. 6 for details.
Additional tests were made with inhibitors to determine whether exocytosis or other aspects of cell metabolism were affected without altering P. KCN, NaN3, FCCP, DCMU, brefeldin A, ABA or RNase were supplied to living cells on the pressure probe at various concentrations alone or in combination. In those that inhibited elongation (KCN, NaN3, FCCP, DCMU), all caused a large loss in P immediately or in a few minutes. The most effective in maintaining P while inhibiting elongation were DCMU (5 μm) + FCCP (15 μm) which allowed elongation to continue for 5–10 min before P collapsed to zero, as reported by Zhu and Boyer (1992).
Pressurizing dextran in the periplasm
FITC-dextran of 580 kDa entered the lumen of the isolated walls when P was applied at 0.05 MPa (Fig. 7A). A thick layer of concentrate (green, Fig. 7A) formed in the artificial periplasm between the oil and the inner wall face. In the layer along the wall (Fig. 7A, white square), the thickness was about 45 μm and depended on the amount of FITC-dextran pre-loaded into the pressure probe. Greater amounts of FITC-dextran caused greater thickness at any specific P (data not shown). After P was increased to 0.5 MPa in the same wall lumen (normal P for cell elongation), the dextran layer became thin (23 μm), bright, and sharply defined inside the same wall face (Fig. 7B, white square). The thinning occurred when only P had been changed. After thinning, the layer remained unchanged for several hours. No FITC-dextran moved through the wall.
Fig. 7.

Concentrating effect of P on solution of dextran too large to move through cell wall. (A) 580-kDa FITC-dextran (green) has Stokes' diameter of 27 nm and is pushed into the wall lumen by mineral oil (black in lumen) at low P of 0.05 MPa. Dextran is a thick layer of 45 μm adjacent to the inner wall face (measured in white box). Wall is stained with Congo Red. Scale bar = 0.5 mm. (B) Same cell after 15 min at high P of 0.5 MPa. Dextran is concentrated in a thin layer (23 μm) adjacent to the inner wall face. No dextran moved through the wall for 5 h.
Similarly, if FITC-dextran of 38 kDa was presented to the isolated wall, a thick layer formed in the artificial periplasm at P of 0.05 MPa (Fig. 8A) and became thinner when P was increased to 0.5 MPa (Fig. 8B). But in contrast to the 580-kDa FITC-dextran, the 38-kDa FITC-dextran slowly moved through the wall to the external solution at the high P. FITC-dextran of 70 kDa exhibited similar behaviour (Fig. 8C). The 70-kDa dextran moved through the wall only if P was above 0.25 MPa.
Fig. 8.

P-induced movement of dextran through Chara cell walls. (A) Low P of 0.05 MPa applied to oil in lumen (black inside the wall) for 25 min did not move 38-kDa FITC-dextran (green) through wall (red). FITC-dextran remained in lumen for 6 h. Scale bar = 0.5 mm. (B) Normal P of 0.5 MPa applied to oil in lumen for 3 min moved 38-kDa FITC-dextran into and through the wall, and into the unstirred culture medium outside. (C) Same as (B) but for 70-kDa FITC-dextran after P of 0.5 MPa for about 5 min. Movement through wall is apparent. At low P of 0.05 MPa or 0.25 MPa, however, no 70-kDa FITC-dextran moved through the wall (not shown, but appeared as in A). Walls were stained with Congo Red.
Physical properties of pectin and dextran
Because pectins and hemicelluloses are the main matrix polysaccharides delivered to the periplasm, their concentration in the periplasm might alter their properties. The Ψs of PGA became more negative as its concentration increased (Fig. 9). At 100 mg g−1 water, the Ψs of the PGA was −0.4 MPa and formed a viscous solution. At a concentration 40 % higher (140 mg g−1 water), the Ψs was −0.5 MPa, and the concentrate precipitated, forming a loose gel. At 250 mg g−1 water, the PGA formed a firm gel. The same result was obtained with PGA solutions of pH 4.0 or 7.0. If CaCl2 (50 mm) was added to the PGA, a firm gel formed at all the concentrations (not shown).
Fig. 9.

Osmotic potential of various concentrations of pectin (open circles, PGA, 170 kDa) or dextran (closed circles, 40 kDa). Osmotic potential of 70-kDa FITC-dextran (open triangles) and 580 kDa FITC-dextran (closed triangles) also is shown at 500 mg g−1 water. Dashed and dotted lines show concentrations of PGA at −0.5 MPa and −0.4 MPa, respectively. Data are individual isopiestic measurements.
The Ψs of dextran was not as negative as for PGA at the same concentration, but like PGA it became more negative as the concentration increased. At a concentration of 450 mg g−1, the dextran Ψs was −0.4 MPa. At a concentration 11 % higher (500 mg g−1 water) its Ψs was −0.5 MPa. Unlike PGA, there was no gelling as the concentration increased. The dextran became more viscous until it solidified at a concentration above 600 mg g−1, at Ψs of −1 to −1.5 MPa. The Ψs of 70-kDa FITC-dextran could not be distinguished from that of 40-kDa dextran when the two were compared at 500 mg g−1, but 580 kDa FITC-dextran had a significantly lower Ψs in comparison with the 40-kDa dextran at the same concentration (Fig. 9).
DISCUSSION
Lowering P by removing cytoplasmic solution inhibited both elongation and wall deposition. Because the method of lowering did not change the wall environment or any other cell property, both processes depended directly on P. It is known that P is required to deform the wall for the elongation process, but the P-link to wall deposition is less obvious (Cleland, 1971; Taiz, 1984; Ray, 1992). To explore the link, the P response was determined for several steps leading to wall deposition. The absorption of inorganic carbon from the external medium was unaffected by P, and Robinson and Cummins (1976) showed that rates of precursor biosynthesis were unaltered by P over times as long as 0.5 h. With exocytosis similarly showing no response, P appeared to act outside the plasma membrane.
P and concentration effects in the periplasm
Using 580-kDa FITC-dextran to simulate the response of large wall precursors in an artificial periplasm outside of the plasma membrane, Chara walls filtered all of the FITC-dextran from the solution when P was applied to the periplasm. The water in the solution passed through the walls into the external medium, and the periplasm became highly concentrated. Net water movement soon ceased but the FITC-dextran was permanently retained in the periplasm. Proseus and Boyer (2005) found water movement was complete in 3 min with no sign of FITC-dextran movement through the wall for 5 h. The wall thus acted as a perfect differentially permeable membrane, and P balanced the Ψs of the concentrated FITC-dextran solution. In this situation, P extended from the oil across the periplasm to the inner wall face.
Because P extended to the inner wall face, the water flux J through the wall can be represented by:
 |
(1) |
where Lp is the hydraulic conductivity of the wall, σ is the reflection coefficient of the wall for the solute, and subscripts i and o represent the artificial periplasm inside of the lumen and the culture medium outside of the wall, respectively. Note that P is numerically positive and Ψs is numerically negative.
At equilibrium, J = 0 and
 |
(2) |
Assuming Po and Ψso are essentially zero:
 |
(3) |
which shows that P balances −σΨsi in the periplasmic solution. Accordingly, at equilibrium, changing P a small amount causes Ψs to change:
 |
(4) |
For the 580-kDa FITC-dextran, the perfect membrane-like behaviour of the isolated Chara wall indicates that σ, i.e. the fraction of solute reflected by the membrane, was 1.0. Therefore, according to eqn 3, a 1 : 1 relationship existed between P and −Ψs in the periplasm. It follows that a higher concentration of FITC-dextran existed in the periplasm at P of 0.5 MPa than at 0.4 MPa (eqn 4).
For smaller polysaccharides around 38 kDa or 70 kDa, the wall also acted as a perfect membrane if P was low. Around P of 0.05 MPa, the confocal images indicated that the FITC-dextrans remained in the periplasm and formed an osmotic equilibrium with P (the volume of the periplasm did not change with time). However, when P was increased, the FITC-dextrans began moving through the wall. This indicates that the reflection coefficient became <1.0 at high P, i.e. some of the solute was not reflected by the wall. The solute moving through the wall was indistinguishable from water except for the slower movement of the solute. Because of the low reflection coefficient, the concentration of FITC-dextran had to be inversely higher (Ψs more negative) in order to balance P (eqn 3). As a result, raising P from 0.4 MPa to 0.5 MPa with the small FITC-dextrans would cause a wider concentration excursion than with 580-kDa dextran. The concentration change of about 11 % measured for 40-kDa dextran is thus conservative for these pressures, and actual concentration changes are likely to be larger.
Although the membrane-like behaviour of the wall was not explored for other polysaccharides in this study, it seems safe to assume that ultra-filtration would follow similar principles for any solute. Accordingly, for a polysaccharide such as 170-kDa PGA, the concentration would increase at least 40 % when P increased to 0.5 MPa from 0.4 MPa as measured in this work.
P and chemical effects in the periplasm
The walls of Chara and closely related Nitella are pectin-rich, mostly with PGA and small amounts of polyglucuronic acid (Morrison et al., 1993; Popper and Fry, 2003), implying that the periplasm would also be PGA-rich. PGA displayed lower Ψs than dextran mostly because the galacturonate residues could dissociate. For potassium PGA of 170 kDa, about 80 % of the 945 residues could dissociate, or potentially about 756 residues per PGA molecule. The K+ released by the dissociation created additional osmoticum that was missing for the non-dissociating dextran. This effect together with the prevalence of PGA in the periplasm would cause Ψs in the periplasm to approach the behaviour reported here for PGA.
As PGA approached the concentration at equilibrium with P of 0.5 MPa, it began to gel. Gelling is a central step in the assembly of new wall and would encase new cellulose microfibrils and hemicellulose in a water-filled matrix. Because multivalent cations such as Ca2+ accelerated the gelling process, the ionic environment would also influence wall assembly.
In addition, the smaller polysaccharides mimicked by dextrans entered the wall at P of 0.5 MPa. Consequently, depending on molecular size, some new wall precursors would penetrate into the existing wall and thus anchor and create a continuum between the gelling new layer and the old wall layers. The gelling and inter-penetration have sometimes been termed ‘apposition’ and ‘intussusception’, respectively, and occasionally are considered to cause growth (reviewed by Ray, 1992). However, no such causal link to growth is implied by the present experiments and instead both processes are viewed simply as components of wall assembly.
Proseus and Boyer (2005) found that the molecular basis for the inter-penetration of the periplasm polymers lies in the diameter of the polysaccharides. Laurent and Killander (1964) considered small branched dextrans to be rods with a cross-section of 0.8 nm (0.4 nm diameter of a single sugar in the main chain plus a linear branch lying alongside on average to give about 0.8 nm total diameter). With longer chains, rapid movement of chain segments caused random coiling that increased the effective diameter. Although the chain cross-section of 0.8 nm might enter a matrix with water-filled interstices of 4.6−4.8 nm, the coiled chain might not. Coiling in 40-kDa dextran gives an effective Stokes' diameter of 9 nm, which is too large to enter the wall spontaneously (Peters, 1986; Read and Bacic, 1996). Proseus and Boyer (2005) found that no entry occurred at low P. Concentrating the dextran with normal P of 0.5 MPa in the wall lumen allowed entry to begin, and dextrans as large as 11 nm entered the wall. The high concentration appeared to restrict coiling in the polysaccharides, overcoming the entropic barrier created by the coils and allowing a polymer end or segment to start into the wall. Inside the walls, the steep downward P gradient supplied a mechanical force that further uncoiled the dextran into the wall. P around 0.5 MPa thus caused elongation of the cell and simultaneous gelling of the pectin in the periplasm, but also entry of polysaccharides into the existing wall.
Combined effects of concentration and chemistry in the periplasm
These effects of periplasm concentration and chemistry are summarized in Fig. 10 showing that the plasma membrane is separated from the inner wall face by the periplasm. P extends across the plasma membrane to the inner wall face, subjecting the entire periplasm to the concentrating and chemical consequences of P. There is no P difference across the plasma membrane. At the inner wall face, there is a steep P gradient sloping downwards a short, sub-polymer distance into the wall. Polymer entry into the wall is controlled at this face. The pressure in the wall is atmospheric in Chara, assuming swelling pressures are negligible in the wall matrix.
Fig. 10.

Summary of P action in the periplasm of growing Chara internodes. (A) Upper graph: P is present across plasma membrane and periplasm, and decreases abruptly at inner wall face. Lower image: section through cell corresponding to P in the upper graph. Matrix polysaccharide (black) is visible in cytosol (actually inside Golgi-derived vesicle, not shown for clarity). After exocytosis, periplasm polysaccharide (red) is slightly deformed by concentrating effects of P. No polysaccharide is entering wall (white hatch on blue). (B) Same as (A) but at high P. Periplasm is thinner than in (A) as water is forced into outside medium by increased P. Periplasm polysaccharide is strongly deformed by concentrating effects in periplasm and pressing against wall. Some polysaccharides begin entering the wall. (C) Same as (B) but high concentration allows inter-polymer cross-links to form and create gel layer (red cross-hatch) that inter-penetrates existing wall. Wall has been thickened by new wall assembly. Dimensions of the various cell compartments are not to scale. CY, Cytosol; PM, plasma membrane; PP, periplasm; W, wall; M, culture medium.
At low P, the periplasm is less concentrated and thus thicker (Fig. 10A) than at high P (Fig. 10B). Matrix precursors delivered by exocytosis to the periplasm have slightly restricted coiling because of the concentrating effects of the low P (Fig. 10A). At high P of 0.5 MPa (Fig. 10B), coiling becomes more restricted and some of the polymers begin to enter the wall matrix. Gelling also occurs because of the high contact between polymers (Fig. 10C) and causes wall to be deposited against the inner wall face. The new wall layer is anchored to the existing wall by the interpenetrating new polysaccharides. Ray (1967) observed this pattern of new wall assembly when labelled glucose was supplied to rapidly elongating plant tissues. Northcote and Pickett-Heaps (1966) observed label throughout the wall in elongating wheat roots.
P effects in existing cell wall
The new polysaccharides were not flushed into the wall. The polymers were retained in the periplasm by the filtering action of the existing wall. Only after equilibrium occurred and net water movement had ceased did appreciable amounts of FITC-dextran enter the wall. This confirms the results of Proseus and Boyer (2005) who directly measured water movement simultaneously with polymer movement and found water forced out of the periplasm before most polysaccharides began to enter the wall. Because net water movement through the wall had ceased, there was no ‘solvent drag’ that could aid polymer entry into the wall. Similar conditions occur in the periplasm of living cells. Net water movement is negligible in Chara depositing new wall, and the P-dependent movement of polysaccharides into the existing wall is explained more by effects in Fig. 10 than by water flow.
In living cells, the size of polysaccharides recently entering the wall has been difficult to measure. Talbott and Ray (1992a) extracted recently labelled xyloglucans from pea cell walls and reported molecular weights of about 30 kDa. Slightly lower molecular weights were obtained if the cells were exposed to external osmotica, in agreement with the concept that large polymers would be less likely to enter the wall than small ones after a decrease in P. Pectins extracted by Talbott and Ray (1992a) had molecular weights of about 1000 kDa but they may have aggregated during the isolation. Gillet et al. (1992) reported that the PGA extracted from the Nitella cell wall by chelators were smaller than in pea (Talbott and Ray, 1992a). The Nitella PGA had an average degree of polymerization of 25 GalA units, a ratio of GalA to rhamnose of about 10, and blocks of 10 or more consecutive non-esterified GalA residues. This agrees well with the description of PGA released from the Nitella walls by concentrated chelators (Morrison et al., 1993). It further indicates that the PGA in the charophyte cell wall was chemically similar to the PGA used here, although the molecular weight may have differed.
It would be desirable to know more about the molecular weight of new cell wall polymers as they are delivered to the periplasm. Such data are rare (Northcote, 1969; Preston, 1974; Fry, 1988) because delivered polymers cross-link in a variety of ways thereby constructing new wall (Carpita and Gibeaut, 1993; Fry, 2004) and masking the molecular weight of the original material. The most commonly used cell wall extraction protocols (Fry, 1988) involve extensive chemical breakage of inter- and intra-polymer bonds to solubilize the wall constituents. Talbott and Ray (1992b) used especially gentle extraction procedures but newly deposited pectin, identified after 10 min of [14C]glucose labelling, had already attained the same molecular weight as the pectin in the bulk wall. Likewise, the peak molecular weight of newly deposited xyloglucan more than doubled in 30 min. A different experimental approach seems necessary before the qualitative effects of P on wall deposition can be directly determined.
Lack of P effects on exocytosis
Exocytosis in plants is sometimes considered to be enhanced by P because of an assumed P difference across the plasma membrane situated at the inner wall face (Fricke et al., 2000). But as shown in the present experiments, the plasma membrane is not located at the inner wall face. The membrane lies against a periplasm that separates it from the inner wall face. As long as exocytosis delivers polymers to the periplasmic space, this separation will occur. Simulating this condition in isolated walls with an artificial periplasm, no P difference existed across the oil/periplasm interface. Likewise, no P difference would exist across the plasma membrane during exocytosis of polymers in living cells. Without a P difference across the membrane, P would not be expected to affect exocytosis.
In agreement with this prediction, low P for short times had little direct effect on Chara exocytosis induced with CTC. While the exocytosis may not have been identical to that occurring with wall precursors, exocytosis clearly occurred (Foissner, 1991) and allowed the effect of P to be tested. The results show that, over times as long as 30 min, exocytosis in growing cells can be excluded from a dependency on P. This result indicates that for a few minutes after a change of P, none of the steps leading to the release of wall precursors to the periplasm were affected by P.
It must be emphasized that this conclusion applies only in the first few minutes because over longer times signals must eventually feed back to control the delivery of new polysaccharides to the periplasm. Without feedback, new polymers would accumulate or be depleted in the periplasm. Although the nature of the feedback is unknown, the inability of low P to affect wall biosynthesis (Robinson and Cummins, 1976) or exocytosis (present study) in 10–30 min indicates that the feedback occurs mostly after this time. From the present results, the signal could consist of changes in periplasm thickness because thickness clearly was larger at low P than at high P. In Nitella, the periplasm appeared to be about 100 nm thick judging from electron micrographs of Morrison et al. (1993). A small accumulation of polymers might cause relatively large changes in such a thin periplasm.
The inability of large polysaccharides to enter the wall at low P would also change the periplasm composition. The matrix would become enriched in large polymers at low P, which could act as a feedback signal. On the other hand, stretch-activated channels probably are not involved because the plasma membrane is unlikely to shrink significantly when P decreases. Chara has a high elastic modulus of the walls, exceeding 100 MPa (Proseus et al., 1999). Shrinkage of the plasma membrane would be <0.1 % when P decreased by 0.1 MPa, which is much smaller than usually found to activate stretch-activated channels (Ding and Pickard, 1993; Zorec and Tester, 1993; Demidchik et al., 2002).
The experiments were designed to detect other forms of feedback using metabolic inhibitors that might decrease Chara elongation without decreasing P. However, none of them maintained P longer than a few minutes after growth was inhibited, and they appeared to act primarily on the integrity of the plasma membrane. The only success in decreasing growth without diminishing P occurred when cells matured naturally. The cells had been mature for several weeks and displayed no wall deposition or elongation despite normal P of about 0.5 MPa. Morrison et al. (1993) similarly observed decreased rates of elongation and wall deposition in Nitella cells approaching maturity. As the cells stopped elongating, new wall was deposited in one or more discrete helicoidal bands of secondary wall inside the primary wall. Completely mature cells below the fifth internode displayed no further banding.
Comparison with P lowered with osmotica
Osmoticum inhibited P, elongation, and wall deposition somewhat differently from directly altering P with the pressure probe. As shown by Zhu and Boyer (1992), osmoticum took longer than the pressure probe to inhibit elongation even in the same cell. In the present work, the cell had to be exposed to osmotica for a longer time than with the pressure probe before wall deposition was altered. These effects probably can be attributed to additional time for solute to move through the wall and periplasm to the plasma membrane where it affected P. In addition, however, Zhu and Boyer (1992) reported stronger inhibition of elongation with osmoticum than with the pressure probe. Wall physical properties or enzymatic activities may have been altered by the solute, adding to the elongation inhibition. Nevertheless, Zhu and Boyer (1992) also found that the inhibition with the pressure probe accounted for most of the inhibition with osmoticum. Low P itself was thus the primary cause of the inhibition, and the solute in the osmoticum added only a moderate secondary amount to the inhibition. Likewise, low P using the pressure probe accounted for the inhibited wall deposition with osmoticum in the present study. Therefore, the conclusions linking wall deposition to elongation were in basic agreement whether they were derived from direct changes in P or from osmoticum.
CONCLUSIONS
These experiments show that, in addition to extending the cell wall during enlargement, P is directly involved in the deposition and assembly of new wall. P causes both processes to occur simultaneously, and reducing P inhibits both processes. P acts primarily outside of the plasma membrane. Although P is often considered to be absent outside of this membrane, in reality P exists there because a concentrated solution of polysaccharides is present in a periplasm between the membrane and inner wall face. P extends across the periplasm to the inner wall face, and the wall assumes the properties of a membrane for wall polymers.
The P acted to concentrate the polysaccharides in the periplasm, and large concentration changes were demonstrated with small P changes. Proseus and Boyer (2005) reported that the higher concentrations act to restrict polysaccharide coiling, allowing a molecular end or segment to begin to enter the wall matrix. The rest of the molecule is uncoiled into the wall by the P gradient. In addition, the present work shows that as P approached normal levels that cause the wall to extend, the concentrating action initiates inter-polymeric cross-linking among the pectins. The cross-linking together with entry into the wall matrix are central components necessary to assemble the wall and account for patterns of wall deposition previously observed by Northcote and Pickett-Heaps (1966) and Ray (1967). As a result, the P-responsiveness of wall deposition in living cells appears to be traceable to a deformation of large polymers in the periplasmic space that is necessary for their entry into the wall while cross-linking to each other and the existing wall, leading to seamless wall assembly while the wall extends.
Acknowledgments
This paper is dedicated to Peter Ray for his extensive, seminal work on wall deposition. We thank Larry Giles formerly at Duke University for the mass spectrometer analyses. Early phases of this work were supported by DOE grant DE-FG02-87ER13776 to J.S.B. Later phases were supported by an Okie Fellowship from the College of Marine Studies to T.E.P.
LITERATURE CITED
- Baker DB, Ray PM. 1965. Relation between effects of auxin on cell wall synthesis and cell elongation.Plant Physiology 40: 360–368. [DOI] [PMC free article] [PubMed] [Google Scholar]
- Baskin TI. 2005. Anisotropic expansion of the plant cell wall. Annual Review of Cell Developmental Biology 21: 203–222. [DOI] [PubMed] [Google Scholar]
- Boffey SA, Northcote DH. 1975. Pectin synthesis during the wall regeneration of plasmolysed tobacco leaf cells. Biochemical Journal 150, 433–440. [DOI] [PMC free article] [PubMed] [Google Scholar]
- Boyer JS. 1995. Measuring the water status of plants and soils. San Diego, CA: Academic Press.
- Bret-Harte MS, Baskin TI, Green PB. 1991. Auxin stimulates both deposition and breakdown of material in the pea outer epidermal cell wall, as measured interferometrically. Planta 185: 462–471. [DOI] [PubMed] [Google Scholar]
- Carpita NC, Gibeaut DM. 1993. Structural models of primary cell walls in the flowering plants: consistency of molecular structure with the physical properties of walls during growth. The Plant Journal 3: 1–30. [DOI] [PubMed] [Google Scholar]
- Cleland RE. 1967. Dual role of turgor pressure in auxin-induced cell elongation in Avena coleoptiles. Planta 77: 182–191. [DOI] [PubMed] [Google Scholar]
- Cleland RE. 1971. Cell wall extension. Annual Review of Plant Physiology 22: 197–222. [Google Scholar]
- Demidchik V, Davenport RJ, Tester M. 2002. Nonselective cation channels in plants. Annual Review of Plant Biology 53: 67–107. [DOI] [PubMed] [Google Scholar]
- Ding JP, Pickard BG. 1993. Mechanosensory calcium-selective cation channels in epidermal cells. The Plant Journal 3: 83–110. [DOI] [PubMed] [Google Scholar]
- Ekani-Nkodo A, Fygenson D. 2003. Size exclusion and diffusion of fluoresceinated probes within collagen fibrils. Physical Review E 67: 021909–1–7. [DOI] [PubMed] [Google Scholar]
- Foissner I. 1991. Induction of exocytosis in characean internodal cells by locally restricted application of chlortetracycline and the effect of cytochalasin B, depolarizing and hyperpolarizing agents. Plant, Cell and Environment 14: 907–915. [Google Scholar]
- Fricke W, Jarvis MC, Brett CT. 2000. Turgor pressure, membrane tension and the control of exocytosis in higher plants. Plant, Cell and Environment 23: 999–1003. [Google Scholar]
- Fry SC. 1988. The growing plant cell wall: chemical and metabolic analysis. New York, NY: John Wiley and Sons.
- Fry SC. 2004. Primary cell wall metabolism: tracking the careers of wall polymers in living plant cells. New Phytologist 161: 641–675. [DOI] [PubMed] [Google Scholar]
- Giddings Jr TH, Brower DL, Staehelin LA. 1980. Visualization of particle complexes in the plasma membrane of Micrasterias denticulata associated with the formation of cellulose fibrils in primary and secondary cell walls. Journal of Cell Biology 84: 327–339. [DOI] [PMC free article] [PubMed] [Google Scholar]
- Gillet C, Cambier P, Liners F. 1992. Release of small polyuronides from Nitella cell walls during ionic exchange. Plant Physiology 100: 846–852. [DOI] [PMC free article] [PubMed] [Google Scholar]
- Hughes R, Street HE. 1974. Galactose as an inhibitor of the expansion of root cells. Annals of Botany 38: 555–564. [Google Scholar]
- Kimura S, Laosinchai W, Itoh T, Cui X, Linder CR, Brown Jr RM. 1999. Immunogold labeling of rosette terminal cellulose-synthesizing complexes in the vascular plant Vigna angularis. The Plant Cell 11: 2075–2085. [DOI] [PMC free article] [PubMed] [Google Scholar]
- Kroh M, Knuiman B. 1985. Exocytosis in non-plasmolysed and plasmolysed tobacco pollen tubes. Planta 166: 287–299. [DOI] [PubMed] [Google Scholar]
- Kutschera U. 1990. Cell-wall synthesis and elongation growth in hypocotyls of Helianthus annuus L. Planta 181: 316–323. [DOI] [PubMed] [Google Scholar]
- Kutschera U. 2001. Stem elongation and cell wall proteins in flowering plants. Plant Biology 3: 466–480. [Google Scholar]
- Laurent TC, Killander J. 1964. A theory of gel filtration and its experimental verification. Journal of Chromatography 14: 317–330. [Google Scholar]
- Loescher WH, Nevins DJ. 1973. Turgor-dependent changes in Avena coleoptile cell wall composition. Plant Physiology 52: 248–251. [DOI] [PMC free article] [PubMed] [Google Scholar]
- Morrison JC, Greve LC, Richmond, PA. 1993. Cell wall synthesis during growth and maturation of Nitella internodal cells. Planta 189: 321–328. [DOI] [PubMed] [Google Scholar]
- Nagahashi G, Tu SI, Fleet G, Namgoong SN. 1990. Inhibition of cell wall-associated enzymes in vitro and in vivo with sugar analogs. Plant Physiology 92: 413–418. [DOI] [PMC free article] [PubMed] [Google Scholar]
- Northcote DH. 1969. The synthesis and metabolic control of polysaccharides and lignin during the differentiation of plant cells. In: Campbell PN and Greville GD, eds. Essays in biochemistry, Vol. 5. London: Academic Press, 89–137. [PubMed]
- Northcote DH, Pickett-Heaps JD. 1966. A function of the Golgi apparatus in polysaccharide synthesis and transport in root-cap cells of wheat. Biochemical Journal 8: 159–167. [DOI] [PMC free article] [PubMed] [Google Scholar]
- Northrop DB. 2002. Effects of high pressure on enzymatic activity. Biochimica et Biophysica Acta 1595: 71–79. [DOI] [PubMed] [Google Scholar]
- Ordin L. 1960. Effect of water stress on cell wall metabolism of Avena coleoptile tissue. Plant Physiology 35: 443–450. [DOI] [PMC free article] [PubMed] [Google Scholar]
- Perrin R, Wilkerson C, Keegstra K. 2001. Golgi enzymes that synthesize plant cell wall polysaccharides: finding and evaluating candidates in the genomic era. Plant Molecular Biology 47, 115–130. [PubMed] [Google Scholar]
- Peters R. 1986. Fluorescent microphotolysis to measure nucleocytoplasmic transport and intracellular mobility. Biochimica et Biophysica Acta 864: 305–359. [DOI] [PubMed] [Google Scholar]
- Popper ZA, Fry SC. 2003. Primary cell wall composition of bryophytes and charophytes. Annals of Botany 91: 1–12. [DOI] [PMC free article] [PubMed] [Google Scholar]
- Preston RD. 1974. The physical biology of plant cell walls. London: Chapman and Hall.
- Proseus TE, Boyer JS. 2005. Turgor pressure moves polysaccharides into growing cell walls of Chara corallina. Annals of Botany 95: 967–979 [DOI] [PMC free article] [PubMed] [Google Scholar]
- Proseus TE, Ortega JKE, Boyer, JS. 1999. Separating growth from elastic deformation during cell enlargement. Plant Physiology 119: 775–784. [DOI] [PMC free article] [PubMed] [Google Scholar]
- Proseus TE, Zhu G-L, Boyer JS. 2000. Turgor, temperature, and the growth of plant cells: using Chara corallina as a model system. Journal of Experimental Botany 51: 1481–1494. [DOI] [PubMed] [Google Scholar]
- Ray PM. 1967. Radioautographic study of cell wall deposition in growing plant cells. Journal of Cell Biology 35: 659–674. [DOI] [PMC free article] [PubMed] [Google Scholar]
- Ray PM. 1992. Mechanisms of wall loosening for cell growth. Current Topics in Plant Biochemistry and Physiology 11: 18–41. [Google Scholar]
- Read SM, Bacic A. 1996. Cell wall porosity and its determination. Modern Methods of Plant Analysis 17: 63–80. [Google Scholar]
- Roberts K. 1994. The plant extracellular matrix: in a new expansive mood. Current Opinion in Cell Biology 6: 688–694. [DOI] [PubMed] [Google Scholar]
- Robinson DG, Cummins WR. 1976. Golgi apparatus secretion in plasmolysed Pisum sativum L. Protoplasma 90: 369–379. [Google Scholar]
- Robinson DG, Eisinger WR, Ray PM. 1976. Dynamics of the Golgi system in wall matrix polysaccharide synthesis and secretion by pea cells. Berichte der Deutschen Botanischen Gesellschaft 89: 147–161. [Google Scholar]
- Shepherd VA, Goodwin PB. 1989. The porosity of permeabilised Chara cells. Australian Journal of Plant Physiology 16: 213–219. [Google Scholar]
- Somero GN. 1992. Adaptations to high hydrostatic pressure. Annual Review of Physiology 54: 557–577. [DOI] [PubMed] [Google Scholar]
- Steudle E, Zimmermann U. 1974. Determination of the hydraulic conductivity and reflection coefficients in Nitella flexilis by means of direct cell-turgor pressure measurements. Biochimica et Biophysica Acta 332: 399–412. [Google Scholar]
- Taiz L. 1984. Plant cell expansion: regulation of cell wall mechanical properties. Annual Review of Plant Physiology 35: 585–657. [Google Scholar]
- Taiz L, Metraux JP, Richmond PA. 1981. Control of cell expansion in the Nitella internode. In: Kiermeyer O, ed. Cytomorphogenesis in plants. New York, NY: Springer-Verlag, 231–264.
- Talbott LD, Ray PM. 1992a. Changes in molecular size of previously deposited and newly synthesized pea cell wall matrix polymers. Plant Physiology 98: 369–379. [DOI] [PMC free article] [PubMed] [Google Scholar]
- Talbott LD, Ray PM. 1992b. Molecular size and separability features of pea cell wall polysaccharides: implications for models of primary structure. Plant Physiology 98: 357–368. [DOI] [PMC free article] [PubMed] [Google Scholar]
- Ueda K, Yoshioka S. 1976. Cell wall development of Micrasterias americana, especially in isotonic and hypertonic solutions. Journal of Cell Science 21: 617–631. [DOI] [PubMed] [Google Scholar]
- Zhu G-L, Boyer JS. 1992. Enlargement in Chara studied with a turgor clamp: growth rate is not determined by turgor. Plant Physiology 100: 2071–2080. [DOI] [PMC free article] [PubMed] [Google Scholar]
- Zorec R, Tester M. 1993. Rapid pressure-driven exocytosis-endocytosis cycle in a single plant cell. FEBS Letters 333: 283–286. [DOI] [PubMed] [Google Scholar]